. 2017 Dec 31:609:1483-1499.
doi: 10.1016/j.scitotenv.2017.07.193. Epub 2017 Aug 8.

The landscape model: A model for exploring trade-offs between agricultural production and the environment

Affiliations

The landscape model: A model for exploring trade-offs between agricultural production and the environment

Kevin Coleman et al. Sci Total Environ. .

Abstract

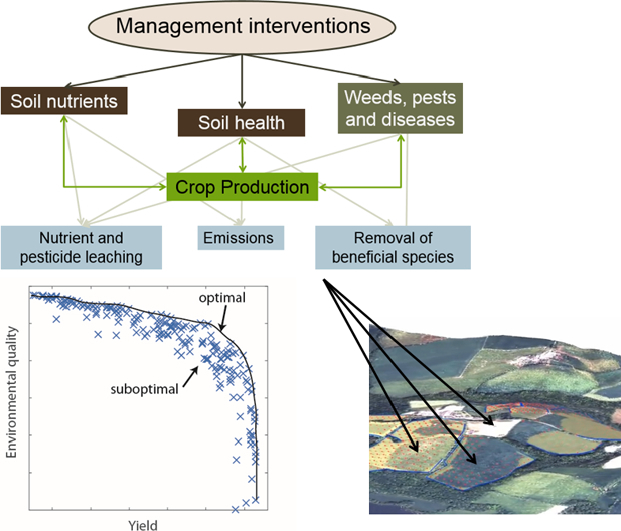
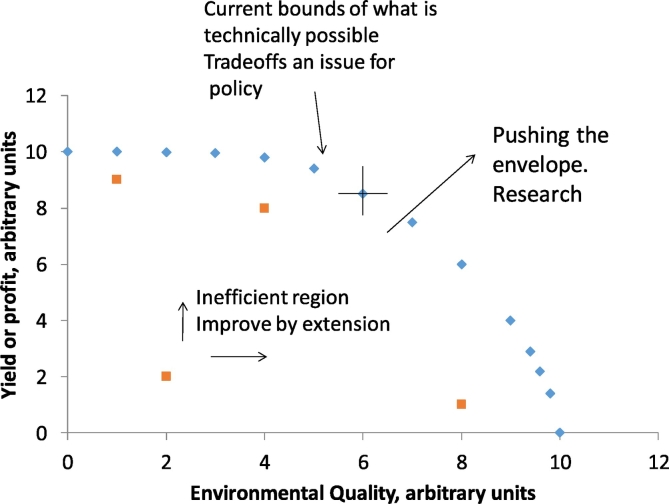
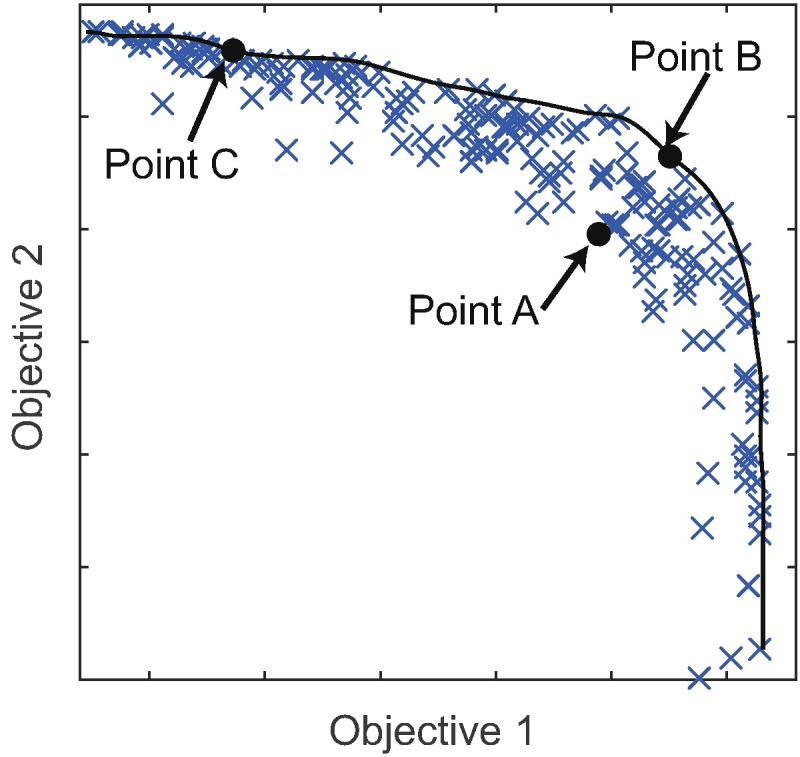
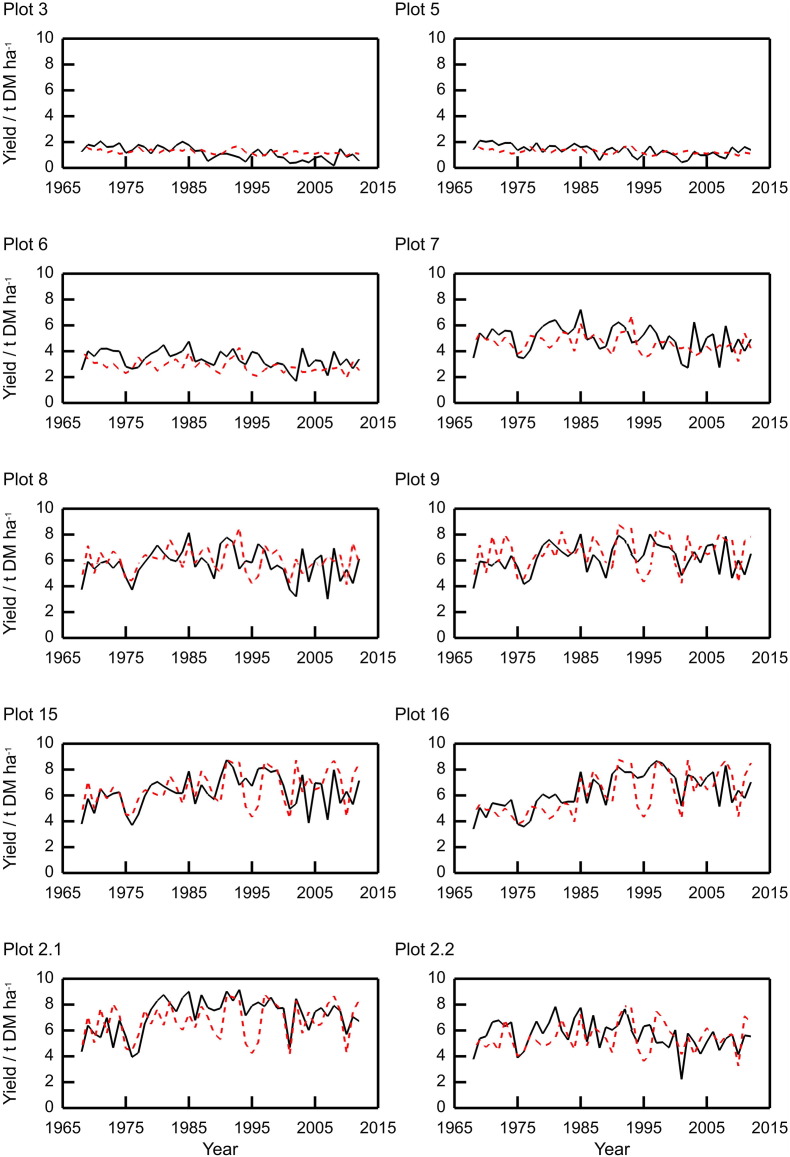
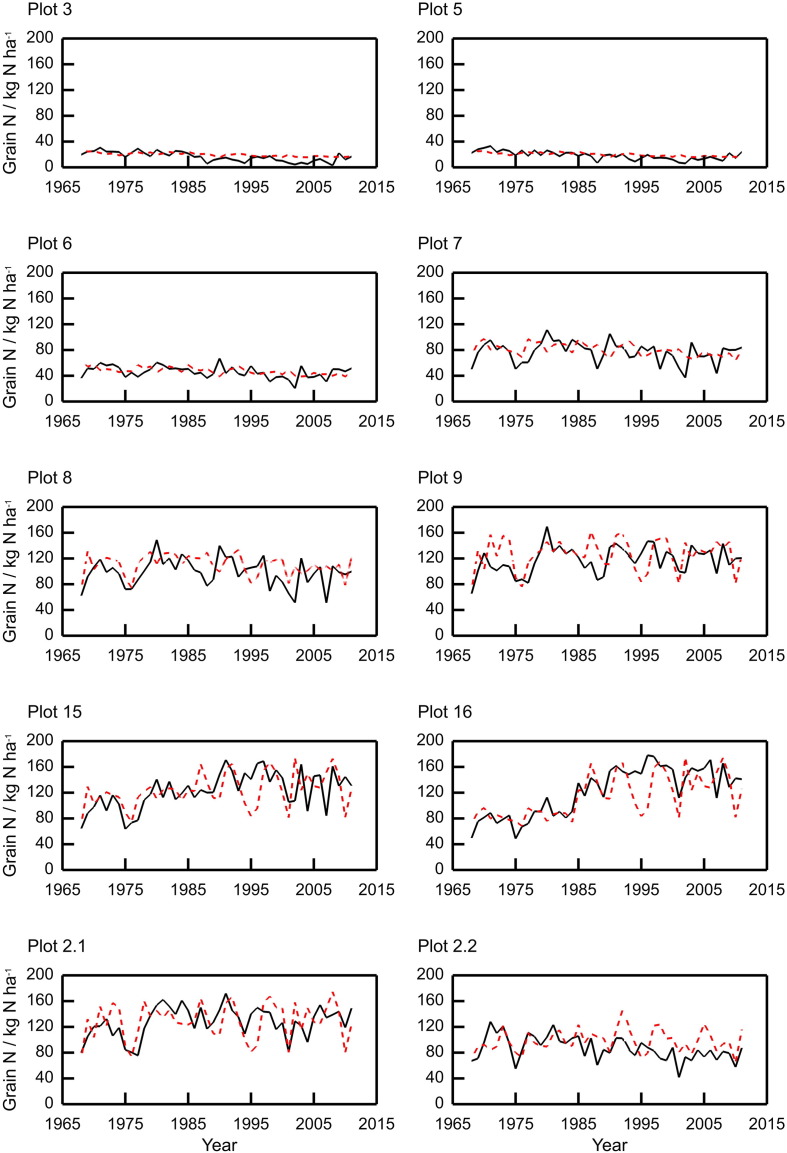
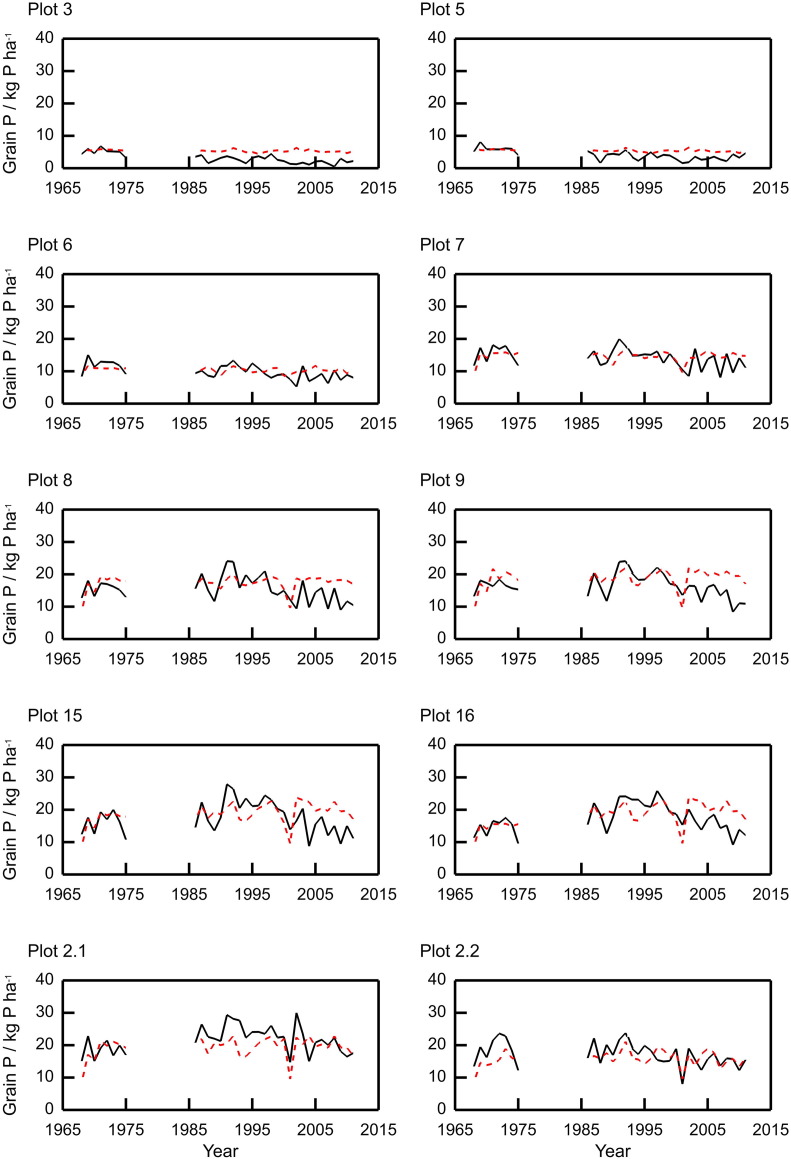
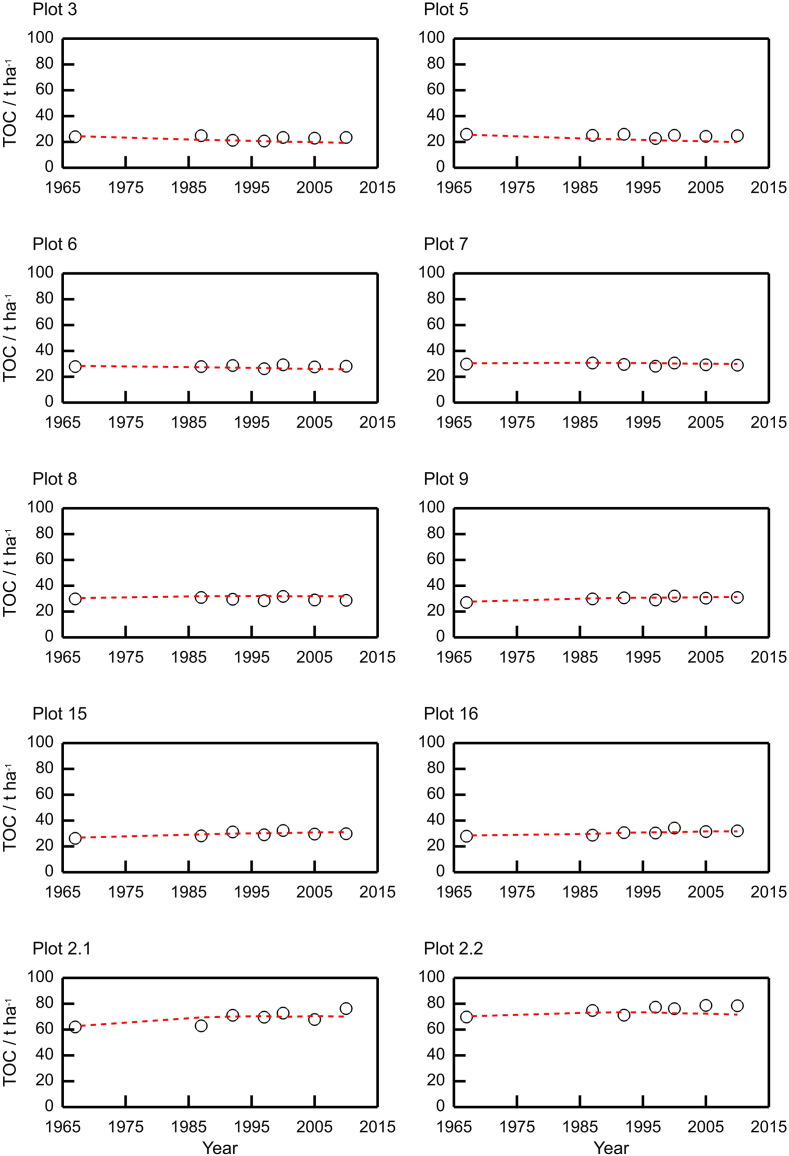
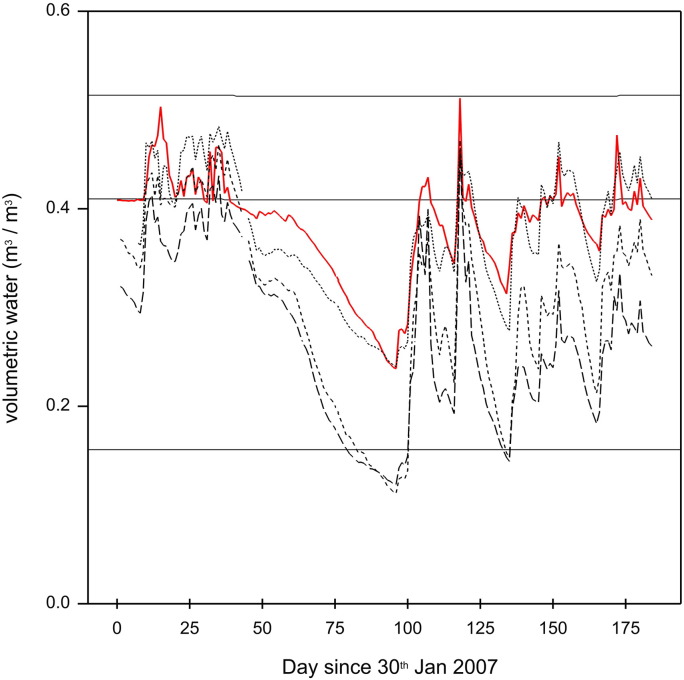
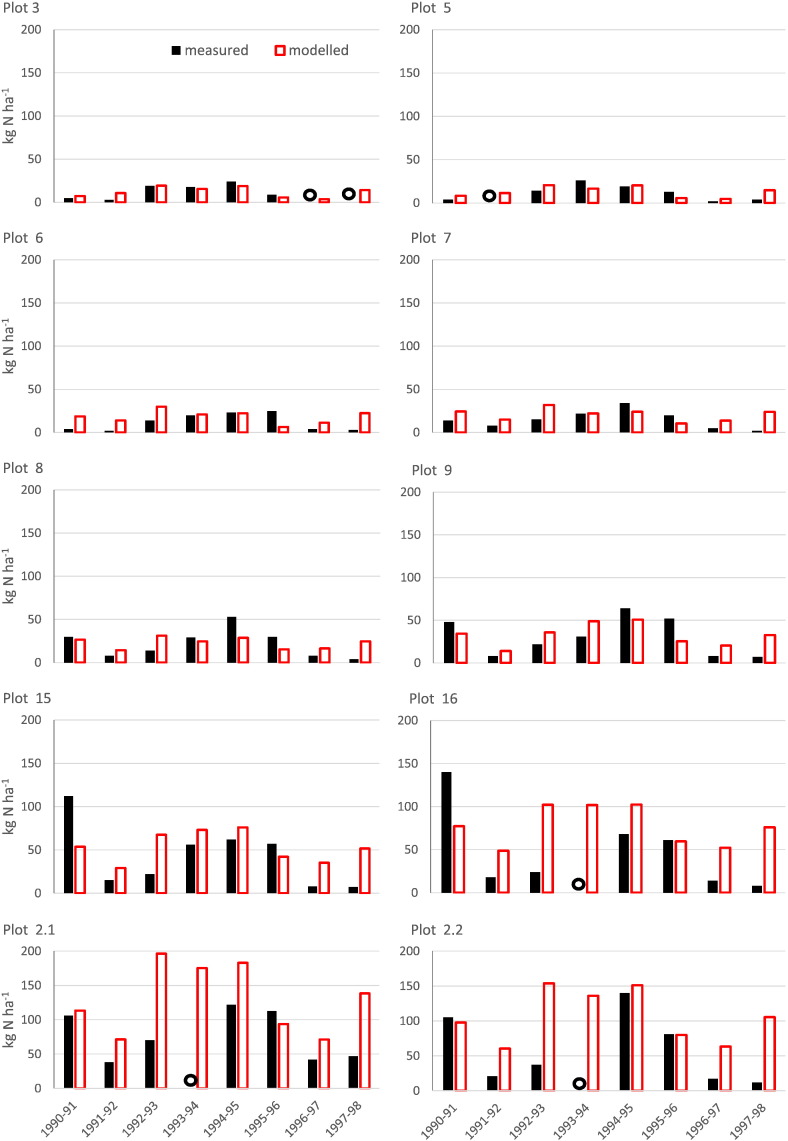
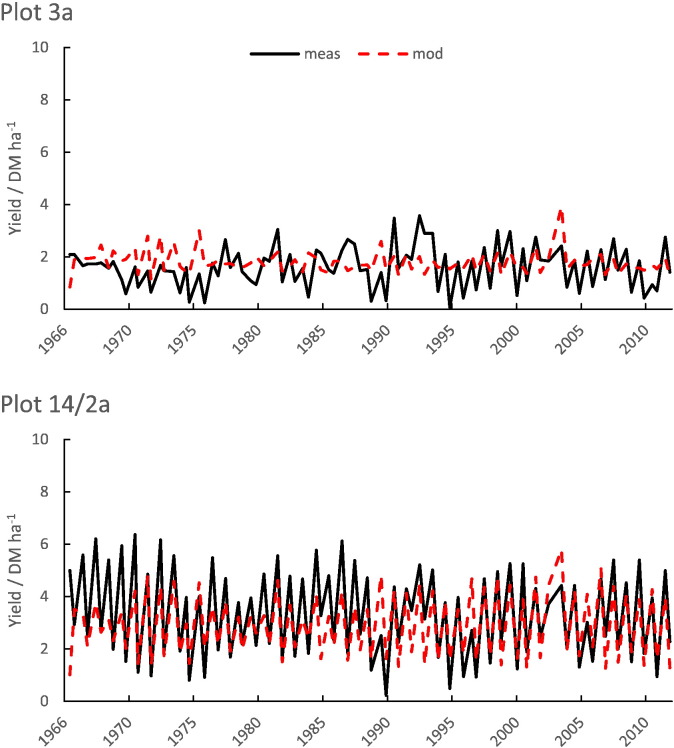
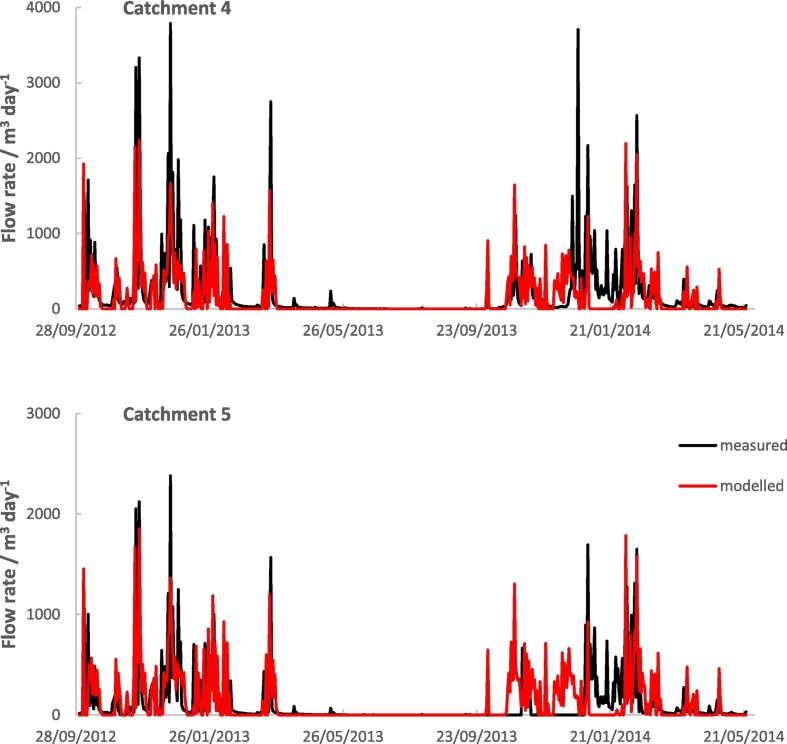
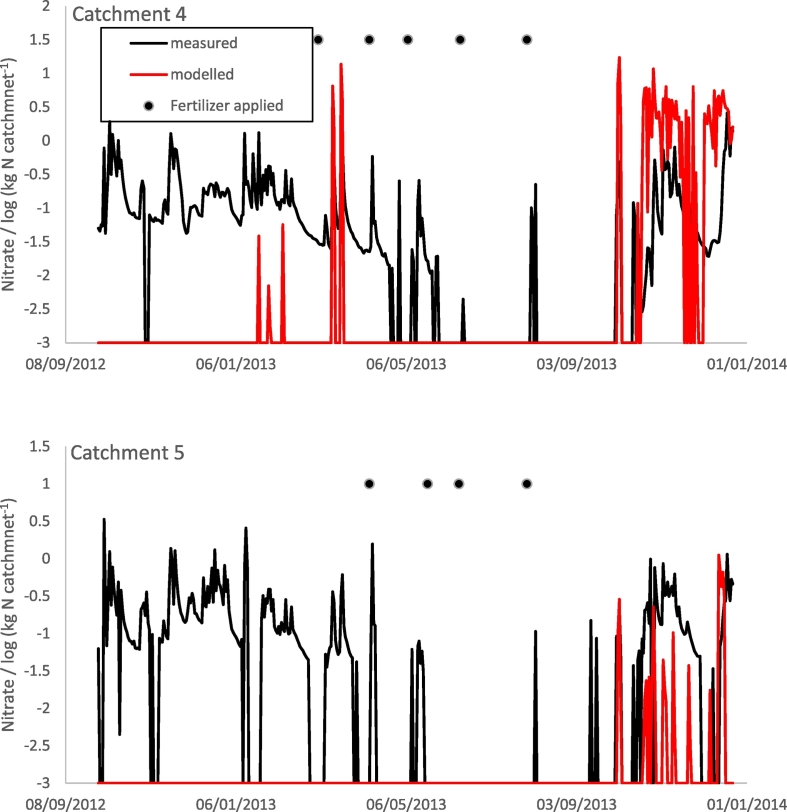
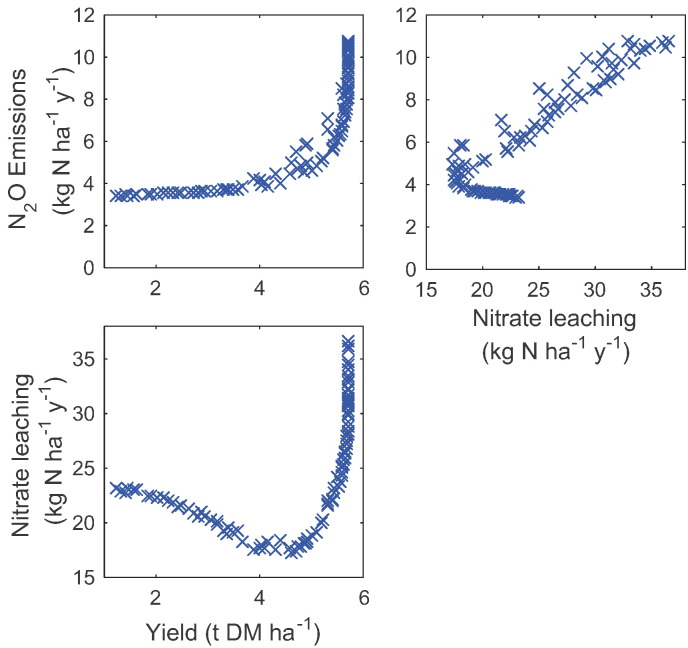
We describe a model framework that simulates spatial and temporal interactions in agricultural landscapes and that can be used to explore trade-offs between production and environment so helping to determine solutions to the problems of sustainable food production. Here we focus on models of agricultural production, water movement and nutrient flow in a landscape. We validate these models against data from two long-term experiments, (the first a continuous wheat experiment and the other a permanent grass-land experiment) and an experiment where water and nutrient flow are measured from isolated catchments. The model simulated wheat yield (RMSE 20.3-28.6%), grain N (RMSE 21.3-42.5%) and P (RMSE 20.2-29% excluding the nil N plots), and total soil organic carbon particularly well (RMSE3.1-13.8%), the simulations of water flow were also reasonable (RMSE 180.36 and 226.02%). We illustrate the use of our model framework to explore trade-offs between production and nutrient losses.

Keywords: Agriculture; Crops; Modelling; Nutrient flow; Soil processes; Water movement.


Figures

Image 1
Graphical abstract
Fig 1
Fig 1
Representation of an environmental-economic production possibility frontier. The blue diamonds are independent outcomes of management that optimises both yield and environmental quality at the same time. A decision along this line is a matter for policy. The orange squares within the envelope are inefficient in the sense that either production or environmental quality could be improved without impacting the other. This is the region for extension. Beyond the envelope is a zone where outcomes are currently infeasible and this is the area which research addresses. An origin placed over any point (for example the cross shown in the figure on the middle of the envelope), facilitates the definition of the envelope algorithmically: if another point can be found in the first quadrant (North East) then the first point in not on the envelope.
Fig. 2
Fig. 2
Example of how a Pareto front is identified from a number of points simulated by the model with the aim to improve multiple objectives (1 & 2) simultaneously. Point B is selected over point A because B scores better for both objectives. It can be seen that neither of points B or C dominates the other, because point B does better at objective 1 whilst point C improves on objective 2. Consequently, both are retained. The Pareto front (line) can be identified by connecting together all of the non-dominated points.
Fig. 3
Fig. 3
Measured (black lines) and modelled (red dashed lines) grain yields for ten plots from the Broadbalk long-term wheat experiment, 1968–2012, continuous wheat (Sections 1 and 9). The measured values were averaged over Sections 1 and 9 (see 2.9.1).
Fig. 4
Fig. 4
Measured (black lines) and modelled (red dashed lines) grain N content for ten plots from the Broadbalk long-term wheat experiment, 1968–2012, continuous wheat. The measured values were from Section 1 only (see 2.9.1).
Fig. 5
Fig. 5
Measured (black lines) and modelled (red dashed lines) grain P content for ten plots from the Broadbalk long-term wheat experiment (1968–1975 and 1986–2011), continuous wheat. The measured values were from Section 1 only (see 2.9.1).
Fig. 6
Fig. 6
Measured (black circles) and modelled (red dashed lines) soil total organic carbon (TOC) for ten plots from the Broadbalk long-term wheat experiment. The measured values were averaged over Sections 1 and 9.
Fig. 7
Fig. 7
Measured for three replicates (black dashed lines) and modelled (red line) volumetric water content in soil from plot 8 of the Broadbalk experiment.
Fig. 8
Fig. 8
Estimated and modelled N leached from study plots on the Broadbalk wheat experiment 1990–1998. Measurements are from Section 9 only. The black open circle indicates that no measurement was taken.
Fig. 9
Fig. 9
Simulated (red dashes) and measured (black lines) yields for plots 3a and 14/2a Park Grass permanent grassland experiment, showing both cuts each year.
Fig. 10
Fig. 10
Simulated (red) and measured (black) flow rates (m3 day− 1) for catchments 4 and 5 of the North Wyke Farm Platform.
Fig. 11
Fig. 11
Simulated (red line) and measured (black line) log nitrate (kg N/catchment) for catchments 4 and 5 of the North Wyke Farm Platform. The black discs show when nitrogen fertilizer was applied. For details see http://www.rothamsted.ac.uk/farmplatform.
Fig. 12
Fig. 12
Illustrative example of use of the model to identify trade-offs between multiple objectives such as maximising yield, minimising nitrate leaching and minimising N2O emissions. As maximising or minimising any one of these objectives affects the others, the optimisation identifies points on a multi-dimensional frontier with Pareto optimality. On this frontier no objective can be improved upon without a detrimental effect on at least one of the other objectives. This frontier therefore represents the best trade-offs that can be achieved.

References

    1. Addiscott T.M., Whitmore A.P. Simulation of solute leaching in soils of differing permeabilities. Soil Use Manag. 1991;7:94–102.
    1. Andam K.S., Ferraro P.J., Pfaff A., Sanchez-Azofeifa G.A., Robalino J.A. Measuring the effectiveness of protected area networks in reducing deforestation. Proc. Natl. Acad. Sci. U. S. A. 2008;105:16089–16094. - PMC - PubMed
    1. Andrew I.K.S., Storkey J. Using simulation models to investigate the cumulative effects of sowing rate, sowing date and cultivar choice on weed competition. Crop. Prot. 2017;95:109–115. - PMC - PubMed
    1. Anon . IACR-Rothamsted and MAFF; Harpenden, UK: 1998. Sundial-FRS user guide; p. 60.
    1. Avery B.W. Soil Survey, Technical Monograph No. 14. Rothamsted Experimental Station; Harpenden, England: 1980. Soil classification for England and Wales (Higher categories) http://dx.doi.org/10.1002/jpln.19811440221. - DOI

LinkOut - more resources