. 2017 Aug 11;12(1):18.
doi: 10.1186/s13062-017-0188-z.

Cell adhesion heterogeneity reinforces tumour cell dissemination: novel insights from a mathematical model

Affiliations

Cell adhesion heterogeneity reinforces tumour cell dissemination: novel insights from a mathematical model

David Reher et al. Biol Direct. .

Abstract

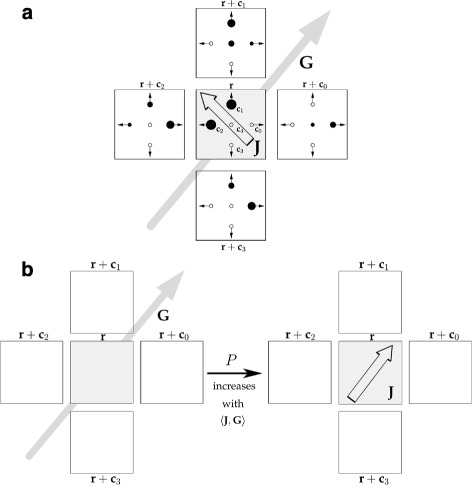
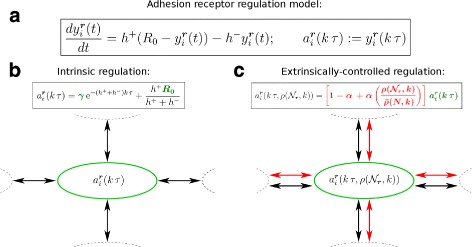
Background: Cancer cell invasion, dissemination, and metastasis have been linked to an epithelial-mesenchymal transition (EMT) of individual tumour cells. During EMT, adhesion molecules like E-cadherin are downregulated and the decrease of cell-cell adhesion allows tumour cells to dissociate from the primary tumour mass. This complex process depends on intracellular cues that are subject to genetic and epigenetic variability, as well as extrinsic cues from the local environment resulting in a spatial heterogeneity in the adhesive phenotype of individual tumour cells. Here, we use a novel mathematical model to study how adhesion heterogeneity, influenced by intrinsic and extrinsic factors, affects the dissemination of tumour cells from an epithelial cell population. The model is a multiscale cellular automaton that couples intracellular adhesion receptor regulation with cell-cell adhesion.

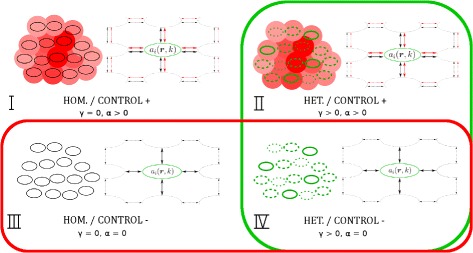
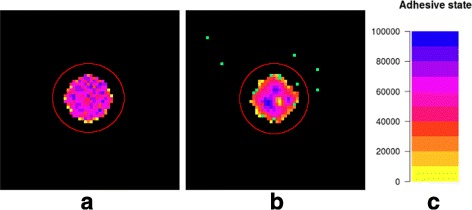
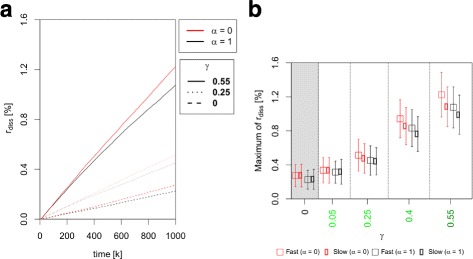
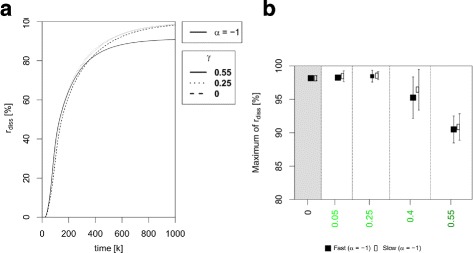
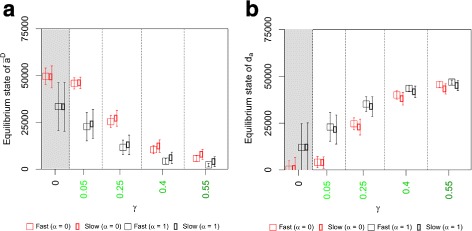
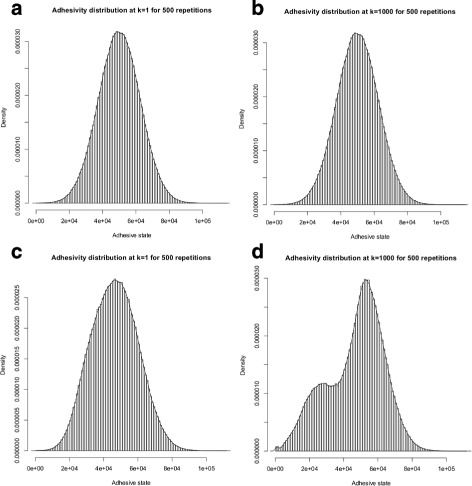
Results: Simulations of our mathematical model indicate profound effects of adhesion heterogeneity on tumour cell dissemination. In particular, we show that a large variation of intracellular adhesion receptor concentrations in a cell population reinforces cell dissemination, regardless of extrinsic cues mediated through the local cell density. However, additional control of adhesion receptor concentration through the local cell density, which can be assumed in healthy cells, weakens the effect. Furthermore, we provide evidence that adhesion heterogeneity can explain the remarkable differences in adhesion receptor concentrations of epithelial and mesenchymal phenotypes observed during EMT and might drive early dissemination of tumour cells.

Conclusions: Our results suggest that adhesion heterogeneity may be a universal trigger to reinforce cell dissemination in epithelial cell populations. This effect can be at least partially compensated by a control of adhesion receptor regulation through neighbouring cells. Accordingly, our findings explain how both an increase in intra-tumour adhesion heterogeneity and the loss of control through the local environment can promote tumour cell dissemination.

Reviewers: This article was reviewed by Hanspeter Herzel, Thomas Dandekar and Marek Kimmel.

Keywords: Cellular automaton; EMT; Intercellular adhesion; Mathematical model; Metastasis; Tumour heterogeneity; Tumour invasion.


Conflict of interest statement

Ethics approval and consent to participate

Not applicable.

Consent for publication

Not applicable.

Competing interests

The authors declare that they have no competing interests.

Publisher’s Note

Springer Nature remains neutral with regard to jurisdictional claims in published maps and institutional affiliations.

Figures

Fig. 1
Fig. 1
Adhesive cell-cell interaction in the LGCA model. a Example configuration of the LGCA; additionally, momentum J(r) (framed arrow) of the central node and local adhesivity gradient G(r) (gray arrow) are indicated. State space: Cells are placed on a square lattice where each node has a substructure with four velocity channels c i,i=0,...,3, and six rest channels (merged into one rest channel in the figure). Accordingly, nodes can host up to ten cells. Adhesive states a i(r) of single cells (indicated by filled dots) are determined by an adhesion receptor regulation model (see Fig. 2 and Additional file 1 for details). The momentum J(r) (framed arrow) at a given node r is the vector sum of all occupation states η i(r,k), weighted by the adhesive states a i(r) (dot size symbolises adhesivity strength). The local adhesivity gradient vector G(r) (gray arrow) at a given node r is the vector sum of the momenta in the next-neighbour neighbourhood, excluding r (see Additional file 1). b Adhesive interaction is characterised by a reorientation probability P that increases with the degree of alignment between local adhesivity gradient G(r) (left, gray arrow) and momentum J(r) of the reoriented configuration (right, framed arrow)
Fig. 2
Fig. 2
Adhesive state changes of individual cells is modelled by an intracellular adhesion receptor regulation model. a Adhesive interactions between cells [black arrows in (b), (c)] are modelled by the probabilistic reorientation operator R in the LGCA model that depends on adhesive states a i(r,k) of individual cells determined by the deterministic intracellular adhesion receptor regulation model (Additional file 1). b Intrinsic adhesion heterogeneity is modelled by stochastic initial adhesive states y 0 (proportional to c, see Additional file 1) and random maximum adhesive states R 0 (green). c Extrinsically-controlled adhesion heterogeneity is modelled by multiplying adhesive states of single cells by a weight (red) that increases linearly with the cell density in the local environment, resulting in an adhesion receptor regulation model that also depends on the occupation states in neighbouring nodes (red arrows)
Fig. 3
Fig. 3
Adhesion receptor regulation scenarios. At the beginning of simulations the tumour cell population of interest can either be homogeneous, i.e. γ=0 (HOM), or heterogeneous, i.e. γ>0 (HET), regarding intrinsic cell-cell adhesivity. Furthermore, the regulation of single cell adhesion receptor concentration can either be independent, i.e. α=0 (CONTROL ), or controlled by the environment, i.e α>0 (CONTROL +), the latter via a weight that increases adhesion receptor expression with increasing local cell density. With this weight, we model a cellular adhesion phenotype under environmental control. Combination of these possibilities gives four adhesion receptor regulation scenarios: Scenario I corresponds to a healthy tissue which we assume to be homogeneous and in which adhesion receptor concentration is under environmental control (γ=0 and α>0). Scenario II corresponds to adhesion heterogeneity caused by differential adhesion receptor expression in the cells, for example due to mutations which are expected to be found in malignant cells (γ>0 and α>0). Scenario III corresponds to a tissue in which cells are still homogeneous but the environmental control is impaired (γ=0 and α=0). This is also expected in malignant cells. Scenario IV is a combination of both heterogeneity and impaired environmental control (γ>0 and α=0)
Fig. 4
Fig. 4
Circular core population and the cell dissemination threshold. a Snapshot of an initial configuration and the cell dissemination threshold distance (red circle). Nodes without cells are black, whereas nodes with occupied channels are coloured [colour bar legend for adhesive states shown in (c)]. The cell population is heterogeneous regarding single cell adhesive states. Note that the mean adhesive states is averaged over all ten channels in a given node. Accordingly, the mean adhesive state at the border nodes of the occupied area is lower due to unoccupied channels. b Snapshot of the simulation after 900 time steps. Several cells disseminated from the population and reached the threshold distance indicated by the red line. These cells are considered as disseminated cells (green dots). Note that disseminated cells are shown in green here, independent of their adhesive state
Fig. 5
Fig. 5
Comparison of the ratio of disseminated cells rdiss between simulation scenarios. a The plot shows the ratio of disseminated cells [Eq. (3)] over time for all scenarios. The disseminated cell ratio increases linearly over time for all scenarios and γ-values. b The plot shows the maximum value of the disseminated cell ratio rdiss [Eq. (3)] in percent as a function of the adhesion heterogeneity parameter γ. The maximum of rdiss significantly (p<0.001) increases with higher γ-values for all scenarios with γ>0. For fixed γ-values the difference between scenarios III and IV (α=0, CONTROL ) and scenarios I and II (α=1, CONTROL +) is significant for all γ (p<0.05). See Additional file 4 for full statistics. Colours of data points are in accordance with scenario colours in Fig. 3
Fig. 6
Fig. 6
Comparison of the ratio of disseminated cell r diss between simulation scenarios with inverted environmental control. In this case adhesive states decrease with increasing local cell density (see Additional file 1). (a) The plot shows the ratio of disseminated cells [Eq. (3)] over time for all scenarios. r diss-values are strongly increased. (b) The plot shows the maximum value of the disseminated cell ratio r diss [Eq. (3)] in percent as a function of the adhesion heterogeneity parameter γ. The maximum of r diss is higher than 90 % for all scenarios. Note the differences in the y-axis compared to Fig. 5
Fig. 7
Fig. 7
Comparison of adhesion phenotypes between simulation scenarios. a The plot shows the mean adhesive state of disseminated cells āD [Eq. (4)] in equilibrium (k=1000) as a function of the adhesion heterogeneity parameter γ for α=1). āD decreases significantly with higher γ-values for all four scenarios (p<0.001). For fixed γ-values, āD is always significantly higher for scenarios III and IV (α=0, CONTROL ) than for scenarios I and II (α=1, CONTROL +, p<0.01). See Additional files 6 and 7 for full statistics. b The plot shows the difference between mean adhesion phenotypes in the distance measure da [Eq. (5)] as a function of the adhesion heterogeneity parameter γ. Significance levels are similar to (a). See Additional files 8 and 9 for full statistics. Colours of data points are in accordance with scenario colours in Fig. 3
Fig. 8
Fig. 8
Equilibrium mean adhesive state distributions in cell populations with adhesion heterogeneity (γ=0.25) and fast regulation mode. a and b show the distributions of mean adhesive states ā in equilibrium for cell populations with only intrinsic adhesion heterogeneity (γ>0 and α=0) and the fast regulation mode at time k=1 and k=1000 (CONTROL /FAST, Scenario I). There is one expected peak at the steady state of the adhesion receptor regulation model [Eq. (1)]. The distribution stays constant over time. c and d show the distributions of ā in equilibrium for cell populations with additional extrinsic adhesion heterogeneity (γ>0 and α=1) and the fast regulation mode at time k=1 and k=1000 (CONTROL +/FAST, Scenario III). At k=1 the distribution is equal to (a). At k=1000 a second peak at lower adhesive states occurs. The equilibrium adhesivity distributions do not differ when the slow regulation mode is considered (Additional file 10)

Similar articles

Cited by

References

    1. Hanahan D, Weinberg RA. The hallmarks of cancer. Cell. 2000;100(1):57–70. doi: 10.1016/S0092-8674(00)81683-9. - DOI - PubMed
    1. Hanahan D, Weinberg RA. Hallmarks of cancer: the next generation. Cell. 2011;144(5):646–74. doi: 10.1016/j.cell.2011.02.013. - DOI - PubMed
    1. Friedl P, Wolf K. Tumour-cell invasion and migration: diversity and escape mechanisms. Nat Rev Cancer. 2003;3(5):362–74. doi: 10.1038/nrc1075. - DOI - PubMed
    1. Thiery JP. Epithelial-mesenchymal transitions in tumour progression. Nat Rev Cancer. 2002;2(6):442–54. doi: 10.1038/nrc822. - DOI - PubMed
    1. Tulotta C, He S, van der Ent W, Chen L, Groenewoud A, Spaink HP, Snaar-Jagalska BE. Imaging cancer angiogenesis and metastasis in a zebrafish embryo model. In: Langenau DM, editor. Cancer and Zebrafish: Mechanisms, Techniques, and Models. Cham: Springer; 2016. - PubMed

Publication types

LinkOut - more resources