Lack of high BMI-related features in adipocytes and inflammatory cells in the infrapatellar fat pad (IFP)
- PMID: 28800775
- PMCID: PMC5553811
- DOI: 10.1186/s13075-017-1395-9
Lack of high BMI-related features in adipocytes and inflammatory cells in the infrapatellar fat pad (IFP)
Abstract
Background: Obesity is associated with the development and progression of osteoarthritis (OA). Although the infrapatellar fat pad (IFP) could be involved in this association, due to its intracapsular localization in the knee joint, there is currently little known about the effect of obesity on the IFP. Therefore, we investigated cellular and molecular body mass index (BMI)-related features in the IFP of OA patients.
Methods: Patients with knee OA (N = 155, 68% women, mean age 65 years, mean (SD) BMI 29.9 kg/m2 (5.7)) were recruited: IFP volume was determined by magnetic resonance imaging in 79 patients with knee OA, while IFPs and subcutaneous adipose tissue (SCAT) were obtained from 106 patients undergoing arthroplasty. Crown-like structures (CLS) were determined using immunohistochemical analysis. Adipocyte size was determined by light microscopy and histological analysis. Stromal vascular fraction (SVF) cells were characterized by flow cytometry.
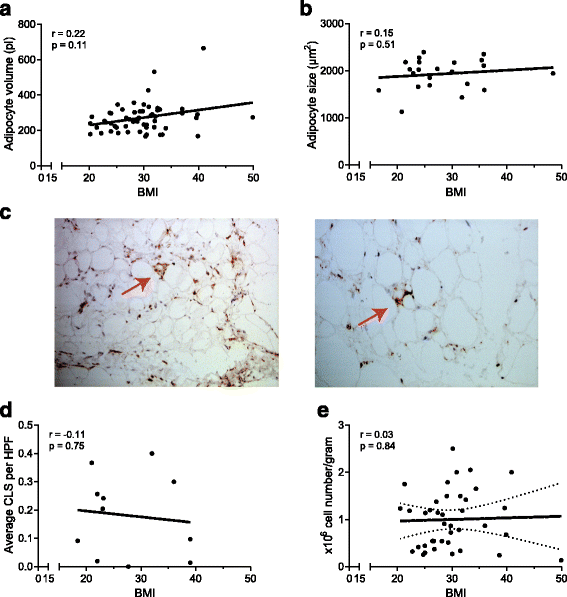
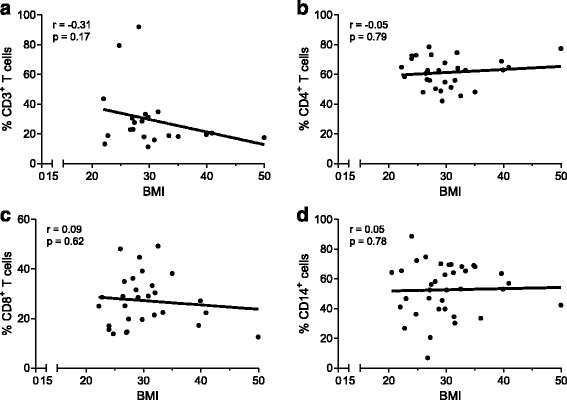
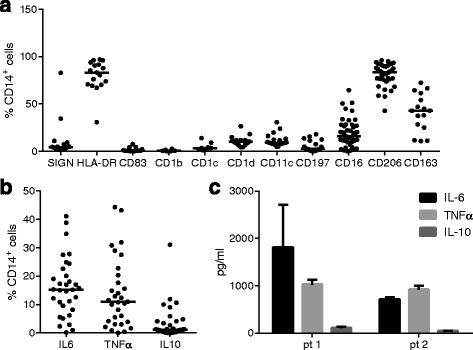
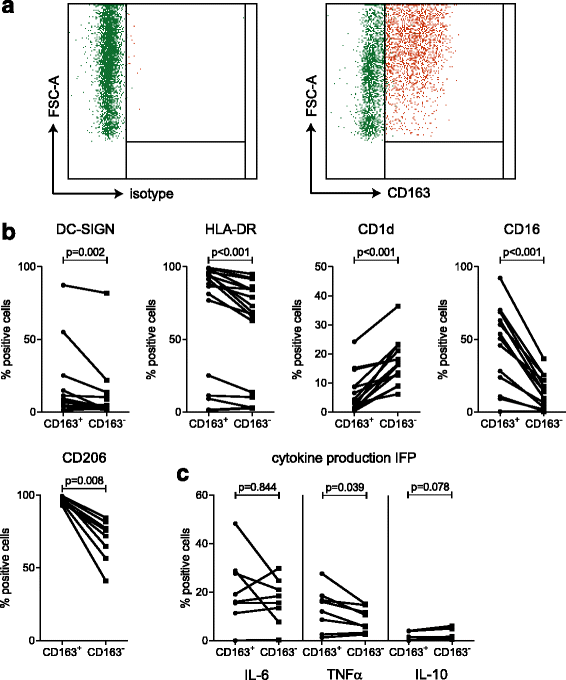
Results: IFP volume (mean (SD) 23.6 (5.4) mm3) was associated with height, but not with BMI or other obesity-related features. Likewise, volume and size of IFP adipocytes (mean 271 pl, mean 1933 μm) was not correlated with BMI. Few CLS were observed in the IFP, with no differences between overweight/obese and lean individuals. Moreover, high BMI was not associated with higher SVF immune cell numbers in the IFP, nor with changes in their phenotype. No BMI-associated molecular differences were observed, besides an increase in TNFα expression with high BMI. Macrophages in the IFP were mostly pro-inflammatory, producing IL-6 and TNFα, but little IL-10. Interestingly, however, CD206 and CD163 were associated with an anti-inflammatory phenotype, were the most abundantly expressed surface markers on macrophages (81% and 41%, respectively) and CD163+ macrophages had a more activated and pro-inflammatory phenotype than their CD163- counterparts.
Conclusions: BMI-related features usually observed in SCAT and visceral adipose tissue could not be detected in the IFP of OA patients, a fat depot implicated in OA pathogenesis.
Keywords: Inflammation; Infrapatellar fat pad; Macrophages; Obesity; Osteoarthritis.
Conflict of interest statement
Ethics approval and consent to participate
This study was approved by the local medical ethics committee of the LUMC, The Netherlands and the local ethics committee Erasmus MC, The Netherlands. Written informed consent is available from all patients participating in the geMstoan study.
Consent for publication
Not applicable.
Competing interests
The authors declare that they have no competing interests.
Publisher’s Note
Springer Nature remains neutral with regard to jurisdictional claims in published maps and institutional affiliations.
Figures


Similar articles
-
Profibrotic Infrapatellar Fat Pad Remodeling Without M1 Macrophage Polarization Precedes Knee Osteoarthritis in Mice With Diet-Induced Obesity.Arthritis Rheumatol. 2017 Jun;69(6):1221-1232. doi: 10.1002/art.40056. Epub 2017 Apr 28. Arthritis Rheumatol. 2017. PMID: 28141918 Free PMC article.
-
The infrapatellar fat pad of patients with osteoarthritis has an inflammatory phenotype.Ann Rheum Dis. 2011 May;70(5):851-7. doi: 10.1136/ard.2010.140046. Epub 2011 Jan 17. Ann Rheum Dis. 2011. PMID: 21242232
-
Increased Ratio of CD14++CD80+ Cells/CD14++CD163+ Cells in the Infrapatellar Fat Pad of End-Stage Arthropathy Patients.Front Immunol. 2021 Nov 26;12:774177. doi: 10.3389/fimmu.2021.774177. eCollection 2021. Front Immunol. 2021. PMID: 34899727 Free PMC article.
-
Pathophysiology of obesity on knee joint homeostasis: contributions of the infrapatellar fat pad.Horm Mol Biol Clin Investig. 2016 May 1;26(2):97-108. doi: 10.1515/hmbci-2015-0067. Horm Mol Biol Clin Investig. 2016. PMID: 26812879 Review.
-
Inflammation of the infrapatellar fat pad.Joint Bone Spine. 2016 Jul;83(4):389-93. doi: 10.1016/j.jbspin.2016.02.016. Epub 2016 Apr 7. Joint Bone Spine. 2016. PMID: 27068617 Review.
Cited by
-
The interrelation of osteoarthritis and diabetes mellitus: considering the potential role of interleukin-10 and in vitro models for further analysis.Inflamm Res. 2018 Apr;67(4):285-300. doi: 10.1007/s00011-017-1121-8. Epub 2017 Dec 1. Inflamm Res. 2018. PMID: 29196771 Review.
-
Metabolism-Related Adipokines and Metabolic Diseases: Their Role in Osteoarthritis.J Inflamm Res. 2025 Jan 25;18:1207-1233. doi: 10.2147/JIR.S499835. eCollection 2025. J Inflamm Res. 2025. PMID: 39886385 Free PMC article. Review.
-
Infrapatellar Fat Pad Gene Expression and Protein Production in Patients with and without Osteoarthritis.Int J Mol Sci. 2020 Aug 21;21(17):6016. doi: 10.3390/ijms21176016. Int J Mol Sci. 2020. PMID: 32825633 Free PMC article.
-
Infrapatellar Fat Pad and Knee Osteoarthritis.Aging Dis. 2020 Oct 1;11(5):1317-1328. doi: 10.14336/AD.2019.1116. eCollection 2020 Oct. Aging Dis. 2020. PMID: 33014539 Free PMC article. Review.
-
PLOD2 gene expression in infrapatellar fat pad is correlated with fat mass in obese patients with end-stage knee osteoarthritis.Osteoarthr Cartil Open. 2024 Apr 16;6(2):100469. doi: 10.1016/j.ocarto.2024.100469. eCollection 2024 Jun. Osteoarthr Cartil Open. 2024. PMID: 38694906 Free PMC article.
References
-
- Visser AW, de Mutsert R, le Cessie S, den Heijer M, Rosendaal FR, Kloppenburg M, Group NEOS. The relative contribution of mechanical stress and systemic processes in different types of osteoarthritis: the NEO study. Ann Rheum Dis. 2015;74(10):1842–7. doi: 10.1136/annrheumdis-2013-205012. - DOI - PubMed
MeSH terms
Substances
Grants and funding
LinkOut - more resources
Full Text Sources
Other Literature Sources
Research Materials

