. 2018 Aug;26(8):1087-1097.
doi: 10.1016/j.joca.2017.07.020. Epub 2017 Aug 8.

Parkin clearance of dysfunctional mitochondria regulates ROS levels and increases survival of human chondrocytes

Affiliations

Parkin clearance of dysfunctional mitochondria regulates ROS levels and increases survival of human chondrocytes

M Y Ansari et al. Osteoarthritis Cartilage. 2018 Aug.

Abstract

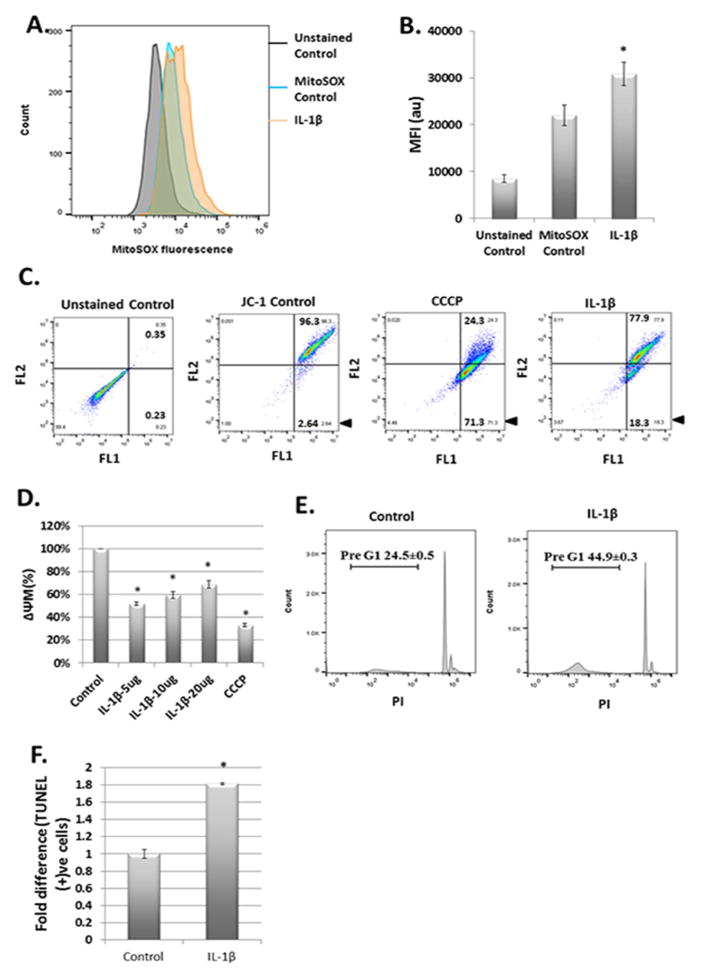
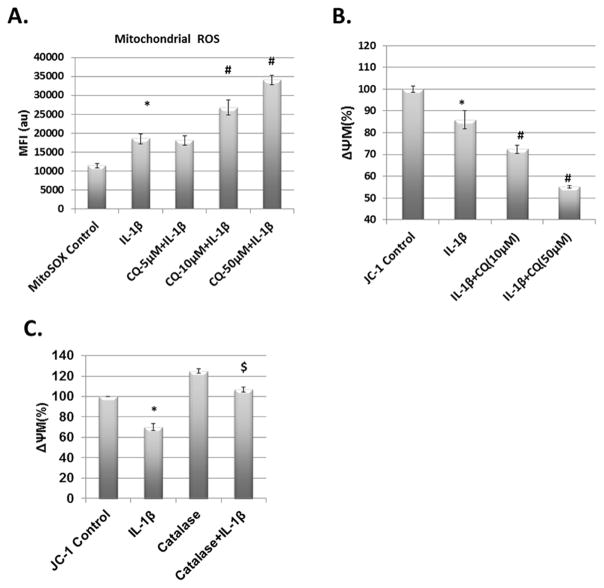
Objective: Mitochondrial dysfunction, oxidative stress and chondrocyte death are important contributors to the development and pathogenesis of osteoarthritis (OA). In this study, we determined the expression and role of Parkin in the clearance of damaged/dysfunctional mitochondria, regulation of reactive oxygen species (ROS) levels and chondrocyte survival under pathological conditions.

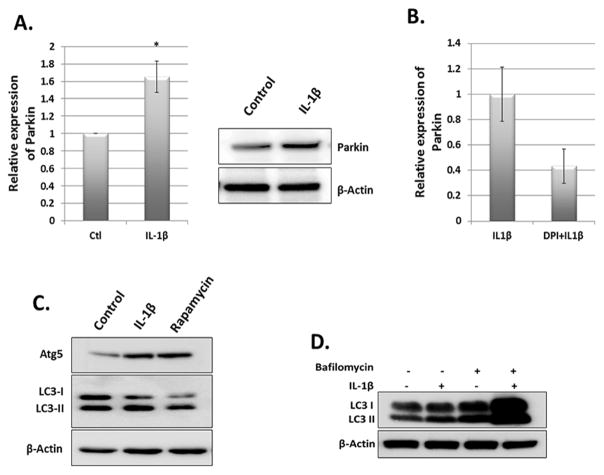
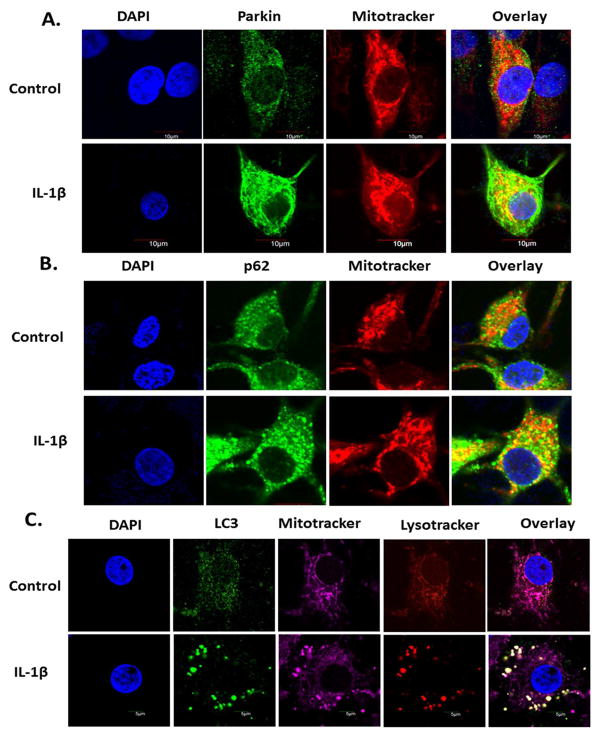
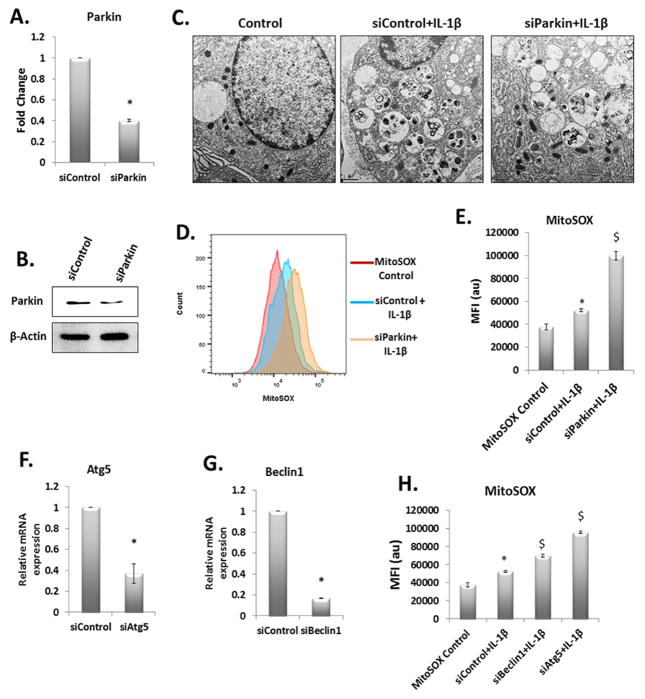
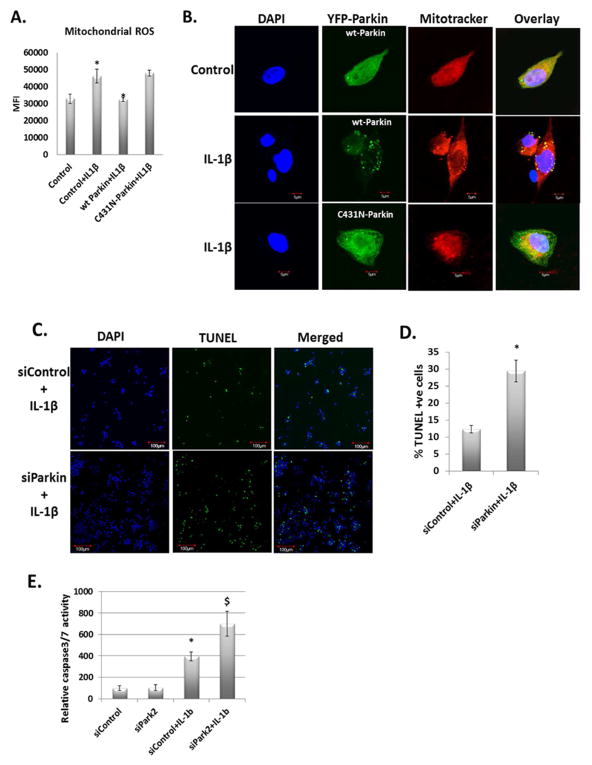
Methods: Human chondrocytes were from the unaffected area of knee OA cartilage (n = 12) and were stimulated with IL-1β to mimic pathological conditions. Mitochondrial membrane depolarization and ROS levels were determined using specific dyes and flow cytometry. Autophagy was determined by Western blotting for ATG5, Beclin1, immunofluorescence staining and confocal microscopy. Gene expression was determined by RT-qPCR. siRNA, wild-type and mutant Parkin plasmids were transfected using Amaxa system. Apoptosis was determined by PI staining of chondrocytes and TUNEL assay.

Results: IL-1β-stimulated OA chondrocytes showed high levels of ROS generation, mitochondrial membrane damage, accumulation of damaged mitochondria and higher incidence of apoptosis. IL-1β stimulation of chondrocytes with depleted Parkin expression resulted in sustained high levels of ROS, accumulation of damaged/dysfunctional mitochondria and enhanced apoptosis. Parkin translocation to depolarized/damaged mitochondria and recruitment of p62/SQSTM1 was required for the elimination of damaged/dysfunctional mitochondria in IL-1β-stimulated OA chondrocytes. Importantly we demonstrate that Parkin elimination of depolarized/damaged mitochondria required the Parkin ubiquitin ligase activity and resulted in reduced ROS levels and inhibition of apoptosis in OA chondrocytes under pathological conditions.

Conclusions: Our data demonstrates that Parkin functions to eliminate depolarized/damaged mitochondria in chondrocytes which is necessary for mitochondrial quality control, regulation of ROS levels and chondrocyte survival under pathological conditions.

Keywords: Chondrocytes; Mitochondrial dysfunction; Osteoarthritis; Parkin; ROS.


Conflict of interest statement

Conflict of Interest

The authors have no conflict of interest.

Figures

Figure 1
Figure 1
IL-1β treatment stimulated ROS production and mitochondrial dysfunction in chondrocytes. (A) and (B) Chondrocytes (1×10⁶ cells/well) were seeded in 6 well plate and treated with MitoSox Red (5μM) for 10 minutes followed by IL-1β for 5 minutes. Chondrocytes were analyzed for mitochondrial ROS by flow cytometer. (C) and (D) Chondrocytes were seeded in 6 well plates as above and treated with IL-1β for 5 minutes followed by incubation with JC-1 dye for 30 minutes. The green (FL1) and red (FL2) fluorescence of JC-1 as marker of ΔΨM loss was analyzed by flow cytometer (BD Accuri C6). CCCP was used as positive control. (E) Chondrocytes were either treated with IL-1β (or left untreated as control) and incubated at 37°C for 48 hours. Chondrocytes were stained with propidium iodide in 01% Triton X-100 and analyzed for pre-G1 population indicating cell death by flow cytometer. (F) Chondrocytes were treated as above and analyzed for cell death by TUNEL staining and analysis by flow cytometer. Data shown are the representative of three independent experiments from different patient’s samples, each done in triplicate. Values are expressed as mean ± SD (*p<0.05).
Figure 2
Figure 2
IL-1β induced stress upregulated Parkin expression. Chondrocytes were seeded in 35mm dish (1×10⁶ cells/well) and stimulated with IL-1β for overnight. Cells were harvested for RNA and lysate preparation and expression of Parkin was analyzed by qPCR (right panel) and Western blot (left panel). Data represent mean ± SD of three independent experiments, each done in triplicate (*p<0.05). β-Actin was used as normalization/loading control. (B) Chondrocytes were treated with IL-1β in the presence or absence of DPI for overnight. Total RNA was prepared from cells and analyzed for Parkin mRNA expression. (C) Chondrocytes were treated with IL-1β in the presence of 10% serum for overnight (16 hours) and analyzed for LC3-II and Atg5 levels by immunoblotting. (D) Chondrocytes were treated with IL-1β for overnight in the presence or absence of Bafilomycin to analyze autophagic flux. Cells were lysed in RIPA buffer supplemented with protease inhibitors and analyzed for LC3-II formation. β-Actin was used as loading control.
Figure 3
Figure 3
Autophagy targeted dysfunctional mitochondria in IL-1β stimulated chondrocytes. Chondrocytes were seeded in 8 well chamber slides (0.1×10⁶/well) and treated with IL-1β (or left untreated as control) for 24 hours. (A) Chondrocytes were stained with Mitotracker Deep Red for 30 minutes and fixed with 4% paraformaldehyde. Chondrocytes were permeabilized with 0.3% Triton X-100 and probed with rabbit anti-Parkin antibody followed by anti-rabbit Alexa-Fluor 488. Chondrocytes were stained with DAPI, mounted with anti-fade mounting media and visualized by Olympus FV1000 confocal microscope. (B) Chondrocytes stained with Mitotracker Deep Red as above and probed with mouse anti-p62 antibody followed by anti-mouse Alexa Fluor 488 and visualized as above. (C) Chondrocytes were stained with Mitotracker Deep Red followed by Lysotracker Red and fixed and permeabilized. Chondrocytes were probed with rabbit anti-LC3 antibody and visualized as above.
Figure 4
Figure 4
Knockdown of Parkin or Atg5 or Beclin-1 hyper sensitized chondrocytes against IL-1β induced oxidative stress and mitochondrial dysfunction. Chondrocytes were transfected with control siRNA or siRNA targeting Pakrin for 48 hours. Total RNA and cell lysate was prepared to analyze Parkin expression by qPCR (A) and immunoblot analysis (B). β-Actin is used as loading or normalization control. (*p<0.05) (C) Chondrocytes were transfected with siControl or siParkin as above and treated with IL-1β followed by transmission electron microscopy. Untreated chondrocytes were taken as control. (D) and (E) Chondrocytes were transfected as above with siControl or siParkin for 48 hours and incubated with MitoSOX Red dye followed by IL-1β and analyzed by flow cytometer for MitoSOX fluorescence. Values are mean±SD (*p<0.05). (F) and (G) Chondrocytes were transfected with siControl or siAtg5 or siBeclin1 as above. Cells were incubated at 37°C for 48 hours fo llowed by RNA isolation and Atg5 and Beclin1 knockdown was analyzed by qPCR (*p<0.05). (H) siControl, siAtg5 and siBeclin1 transfected cells were stained with MitoSOX Red, treated with IL-1β and analyzed the fluorescence with Flow cytometer. Data represent mean ± SD of three independent experiments, each done in triplicate. (* IL-1β vs control, $ target siRNA vs control siRNA, p<0.05).
Figure 5
Figure 5
Autophagy inhibition exaggerated IL-1β induced oxidative stress and mitochondrial dysfunction. (A) Chondrocytes were seeded in 6 well plates and pretreated with different concentrations of autophagy inhibitor chloroquine (CQ) followed by addition of MitoSOX red dye. Cells were treated with IL-1β for 5 minutes and analyzed by flow cytometer to measure mitochondrial ROS. (B) Chondrocytes were pretreated with chloroquine as above followed by treatment with IL-1β for five minutes and addition of JC-1 dye for 30 minutes. The red and green fluorescence of JC-1 was measured by fluorimeter and the ΔΨM loss was calculated as ratio of red and green fluorescence (C) Chondrocytes were treated with catalase for 1 hour followed by IL-1β treatment and JC-1 staining. ΔΨM loss was calculated as above. Data is shown as mean ± SD of three independent experiments, each done in triplicate (* IL-1β vs control, # CQ+IL-1β vs IL-1β, $ Catalse+IL-1β vs IL-1β, p<0.05).
Figure 6
Figure 6
Overexpression of wt-Parkin downregulates mitochondrial ROS by clearing dysfunctional mitochondria. (A) Chondrocytes were transfected with YFP-wt-Parkin and YFP-C431N-Parkin and incubated at 37°C for 48 hours. Chondrocytes were stained with MitoSOX Red followed by IL-1β stimulation. MitoSOX red fluorescence was measured by fluorimeter. (B) Chondrocytes were transfected with YFP-wt-Parkin and YFP-C431N-Parkin as above and treated with IL-1β. Chondrocytes were stained with Mitotracker Deep Red and fixed with 4% paraformaldehyde. Mounted with anti-fade mounting media and visualized as above. (C) and (D) Chondrocytes were transfected with siControl or siParkin for 48 hours and stimulated with IL-1β for 48 hours. Chondrocytes were processed for TUNEL assay as per manufacturer’s instruction. Around 600 cells were counted in both the samples and plotted as TUNEL positive cells. (E) Chondrocytes were transfected with siControl and siParkin and treated with IL-1β as above. Apoptotic cell death was analyzed by measuring caspase 3/7 activities using Caspase Glo 3/7 luminescence assay system. Data is shown as mean ± SD of three independent experiments, each done in triplicate.

Comment in

References

    1. Glyn-Jones S, Palmer AJ, Agricola R, Price AJ, Vincent TL, Weinans H, et al. Osteoarthritis. Lancet. 2015;386:376–387. - PubMed
    1. Loeser RF, Goldring SR, Scanzello CR, Goldring MB. Osteoarthritis: a disease of the joint as an organ. Arthritis Rheum. 2012;64:1697–1707. - PMC - PubMed
    1. Finkel T. Signal transduction by reactive oxygen species. J Cell Biol. 2011;194:7–15. - PMC - PubMed
    1. Labunskyy VM, Gladyshev VN. Role of reactive oxygen species-mediated signaling in aging. Antioxid Redox Signal. 2013;19:1362–1372. - PMC - PubMed
    1. Jones DP. Redox theory of aging. Redox Biol. 2015;5:71–79. - PMC - PubMed

Publication types