. 2017 Oct 2;216(10):3199-3217.
doi: 10.1083/jcb.201610013. Epub 2017 Aug 11.

Pet10p is a yeast perilipin that stabilizes lipid droplets and promotes their assembly

Affiliations

Pet10p is a yeast perilipin that stabilizes lipid droplets and promotes their assembly

Qiang Gao et al. J Cell Biol. .

Abstract

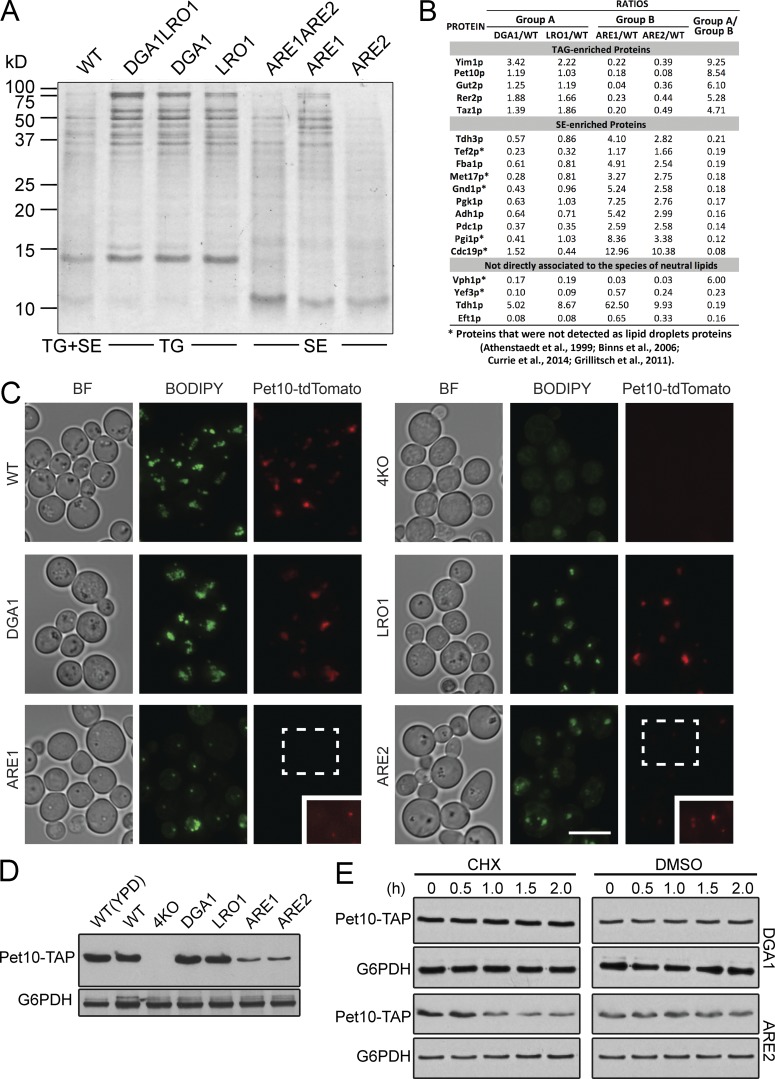
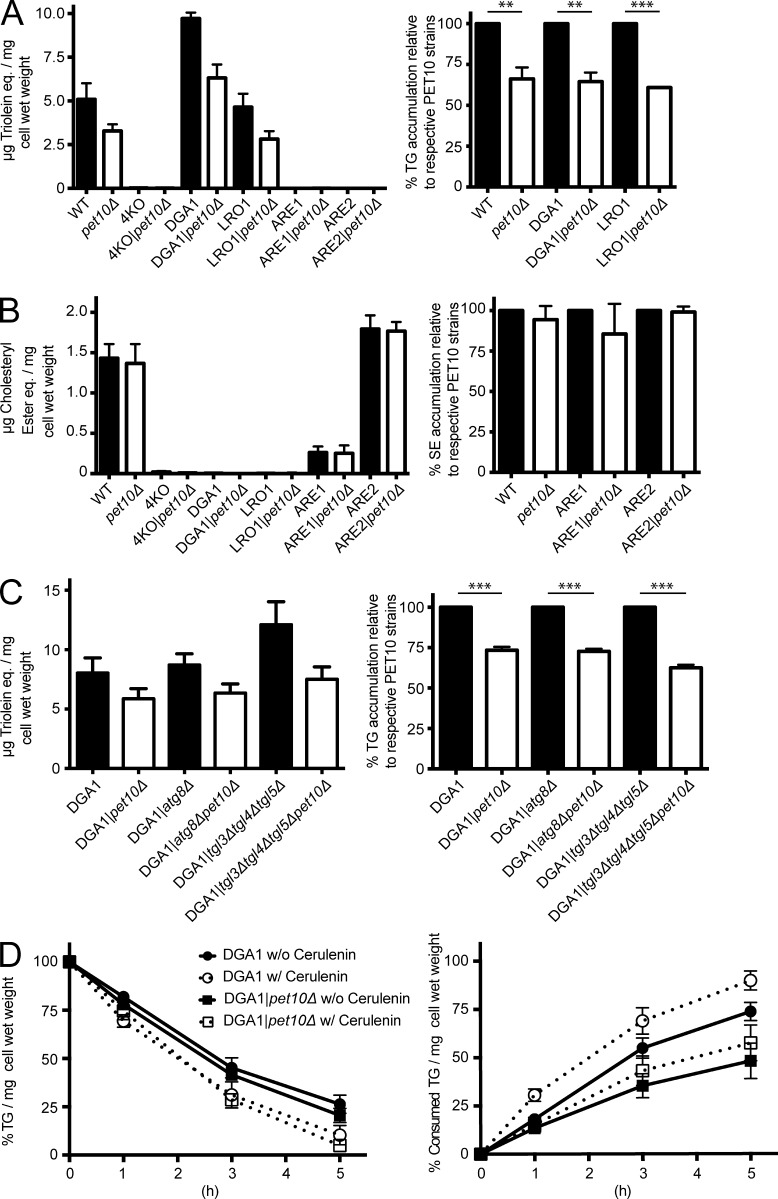
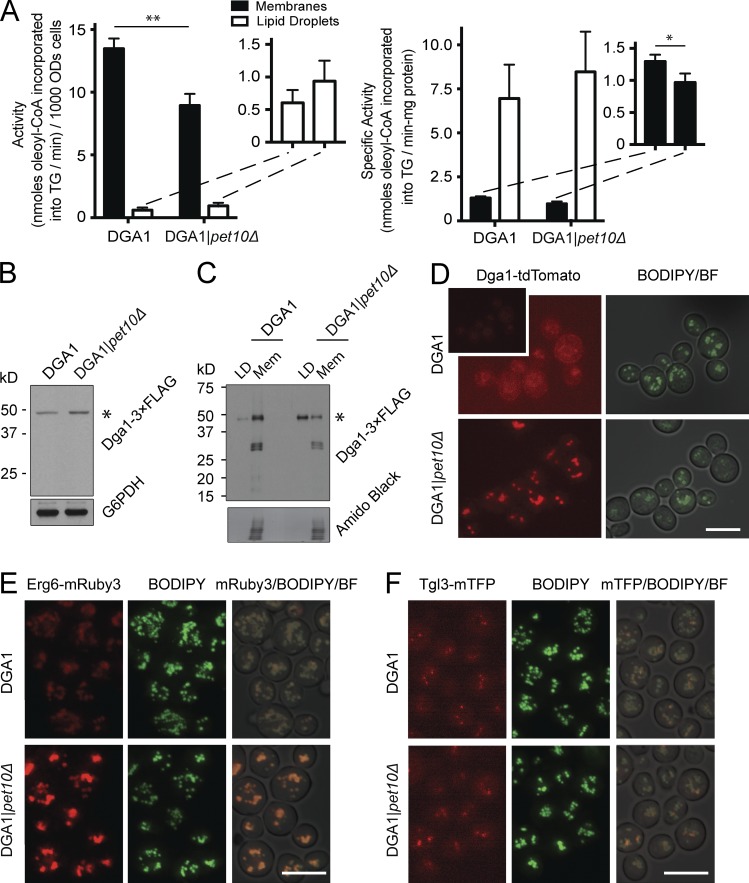
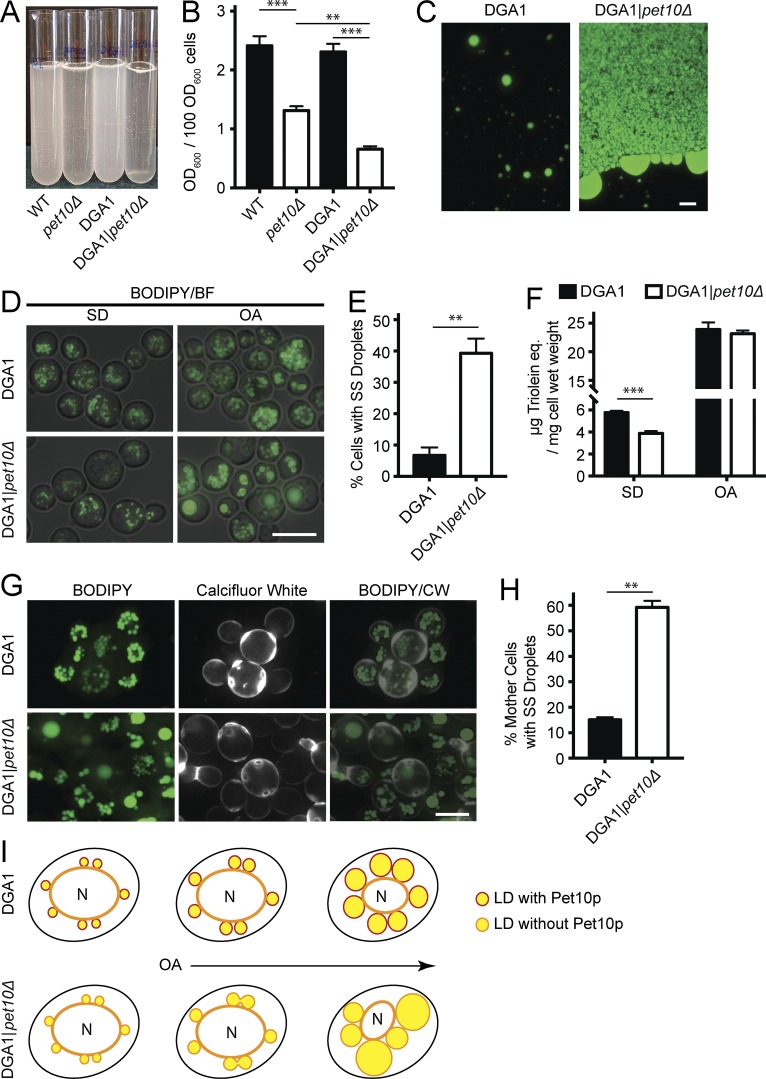
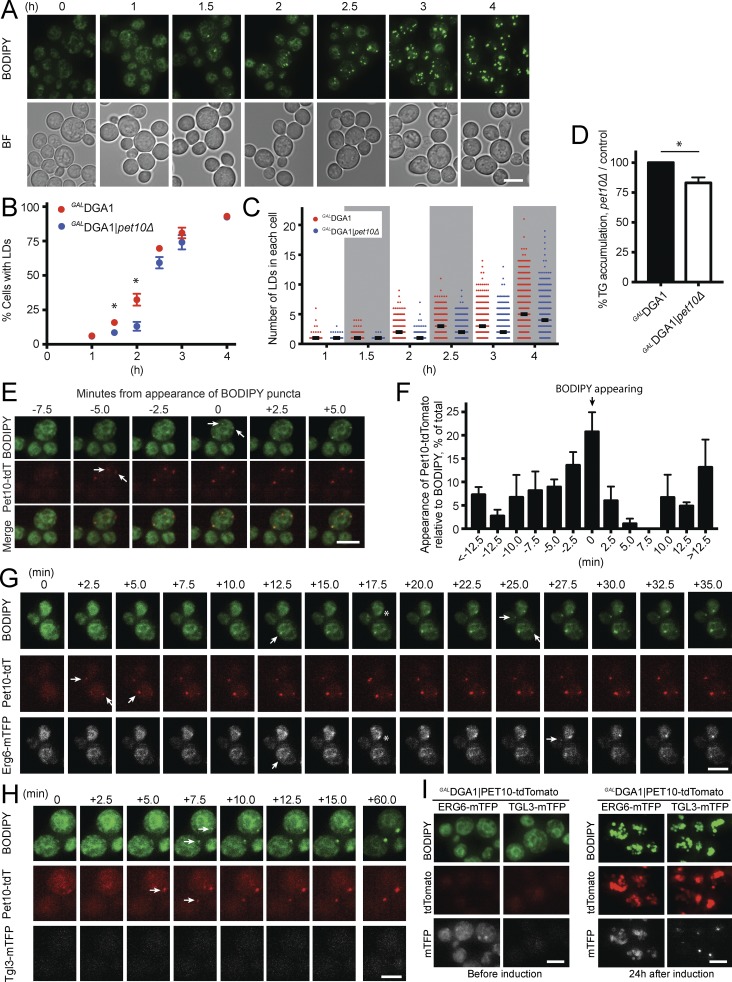
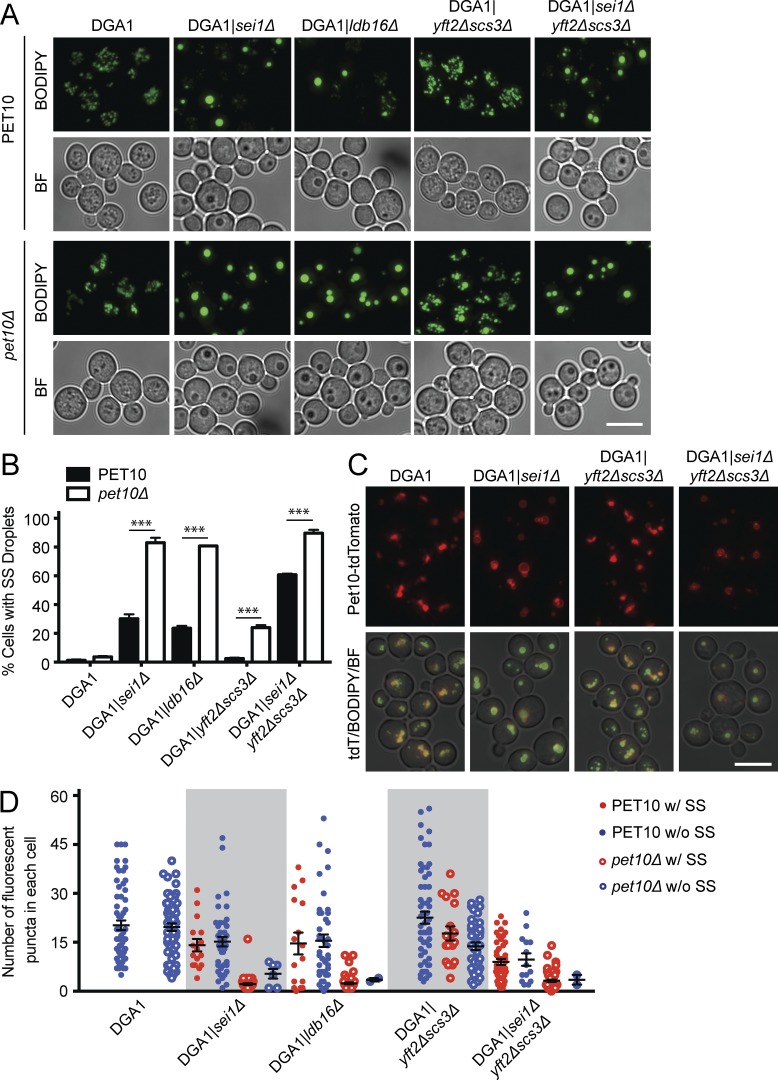
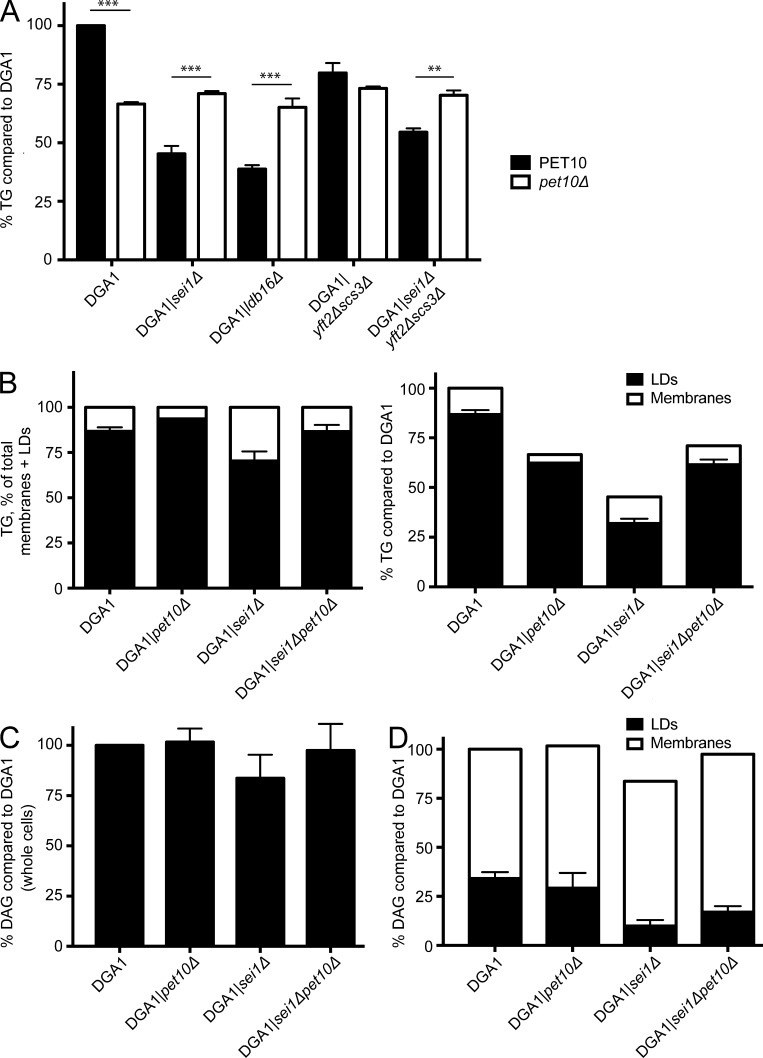
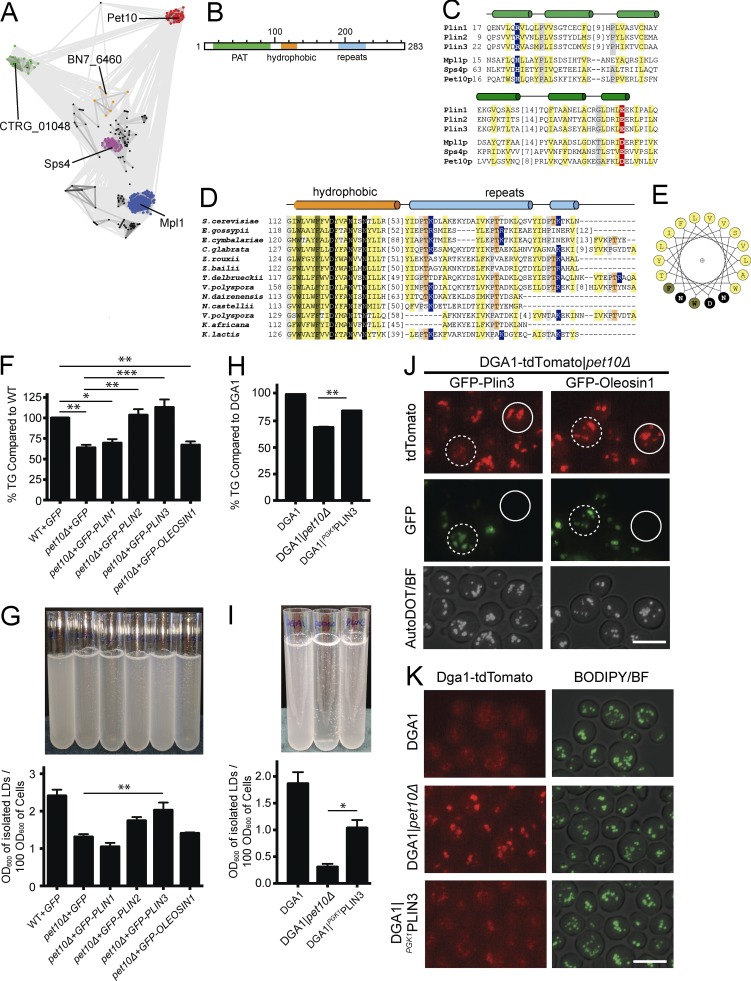
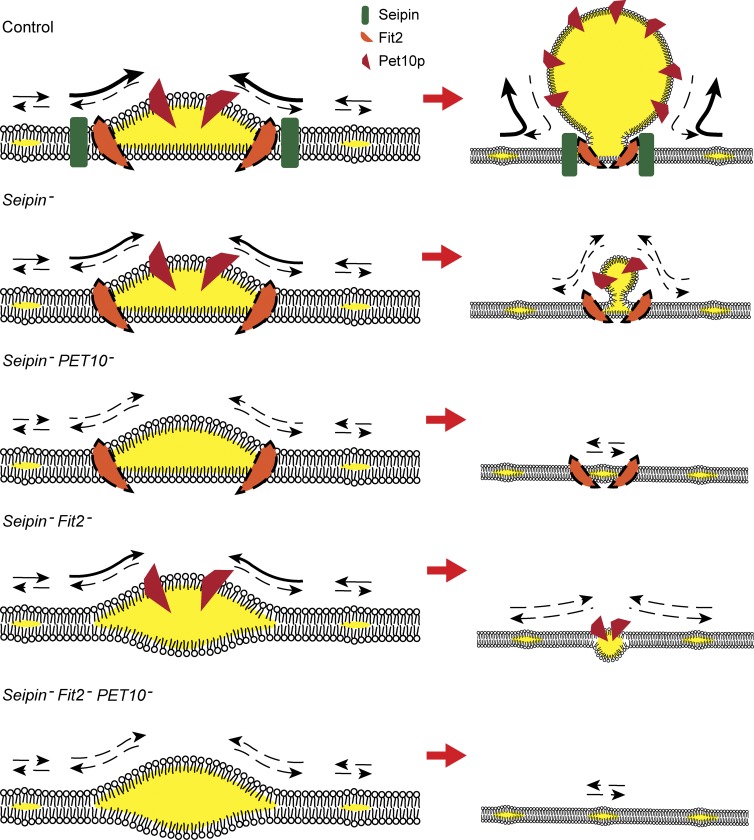
Pet10p is a yeast lipid droplet protein of unknown function. We show that it binds specifically to and is stabilized by droplets containing triacylglycerol (TG). Droplets isolated from cells with a PET10 deletion strongly aggregate, appear fragile, and fuse in vivo when cells are cultured in oleic acid. Pet10p binds early to nascent droplets, and their rate of appearance is decreased in pet10Δ Moreover, Pet10p functionally interacts with the endoplasmic reticulum droplet assembly factors seipin and Fit2 to maintain proper droplet morphology. The activity of Dga1p, a diacylglycerol acyltransferase, and TG accumulation were both 30-35% lower in the absence of Pet10p. Pet10p contains a PAT domain, a defining property of perilipins, which was not previously known to exist in yeast. We propose that the core functions of Pet10p and other perilipins extend beyond protection from lipases and include the preservation of droplet integrity as well as collaboration with seipin and Fit2 in droplet assembly and maintenance.


Figures

Figure 1.
Figure 1.
Pet10p is an abundant protein specific to droplets containing TG. (A) Lipid droplets were purified from the indicated strains, subjected to SDS-PAGE (2 µg of protein per lane), and stained with Coomassie blue. The neutral lipid contained in the droplets is indicated below. The protein pattern is representative of three independent experiments. (B) Analysis of proteomics from TG and SE droplets (all from 3KO strains). The highest 100 hits overall in terms of spectral counts were considered, and their spectral indices were compared with that of the wild type. The last column expresses the ratio of signal from DGA1 and LRO1 droplets, termed group A, to that of ARE1 and ARE2 droplets, termed group B. Shown are those hits where the group A/group B ratios were >4 or <0.25. (B, bottom) Four hits where the spectral indices in all four 3KO strains were either >4 or <0.25 compared with the wild type. Asterisks indicate genes encoding proteins not previously identified in droplet proteomic studies (Athenstaedt et al., 1999; Binns et al., 2006; Grillitsch et al., 2011; Currie et al., 2014). (C) Cells from the indicated strains expressing chromosomal Pet10-tdTomato were stained with BODIPY to visualize droplets. (C, inset) The indicated area was enhanced in Photoshop to allow visualization of puncta. (D) Whole-cell extracts of the indicated strains were immunoblotted with anti-His (reacts with TAP tag) or anti-G6PDH antibody. (E) DGA1 or ARE2 cells expressing Pet10-TAP were subjected to CHX or DMSO vehicle for the indicated hours. Whole-cell extracts were subjected to SDS-PAGE and immunoblotting. For the ARE2 samples, the amount loaded on the gel for the anti-His blot was increased five times, and development time was increased 30 times to approximate the signal of the t0 point of the DGA1 sample. BF, brightfield. Bar, 5 µm.
Figure 2.
Figure 2.
Pet10p promotes accumulation of TG, but not by decreased lipolysis. The amount of TG (A and C) or SE (B) was determined in whole-cell extracts of the indicated strains and plotted directly (left). The values in pet10Δ strains are plotted relative to their background strains, set at 100% (right). (D) The rate of lipolysis was determined after addition of cerulenin to the indicated strains. (D, left) TG level compared with t0 for each strain. (D, right) Calculated consumption of TG in all strains relative to DGA1, set at 100% at t0. For all panels, error bars represent SEM over all replicate experiments. **, P < 0.01; ***, P < 0.001.
Figure 3.
Figure 3.
Pet10p promotes Dga1p activity and its localization in the ER. (A) Crude membranes and droplets were isolated from PNSs of the indicated strains, and DGAT activities in each were determined (A, left) Total activity expressed per 1,000 OD600 units of cells. (A, inset) Expands the scale for droplets. (A, right) Specific activity expressed per milligram of protein. Data are from four independent experiments. Paired t test was used to determine p-value. Error bars represent SEM over all replicate experiments. *, P < 0.05; **, P < 0.01. (B and C) Dga1–3×FLAG expression in whole-cell extracts (B) or droplets and crude membranes (C) from the indicated strains. Immunoblots are shown using anti-FLAG and anti-G6PDH antibodies. Asterisks show the predicted molecular weight of Dga1p-3xFLAG. Equal percentage of total membrane and droplet fractions analyzed (C). (C, top) Immunoblot using anti-FLAG antibody. (C, bottom) A collapsed view of the nitrocellulose stained with amido black as control for protein load. (D) Cells from the indicated strains containing chromosomal DGA1-tdTomato were stained with BODIPY. Note: The inset in the top left image is presented at the same settings as the others; the main image was enhanced in Photoshop to visualize ER rings. (E and F) Cells from the indicated strains containing Erg6-mRuby3 and Tgl3-mTFP were stained with BODIPY. Bars, 5 µm.
Figure 4.
Figure 4.
Pet10p promotes droplet stability. (A) Isolated droplets were gently resuspended in 3 ml flotation buffer. (B) The suspensions were subjected to light scattering at 600 nm. (C) BODIPY was added to an aliquot of the droplet suspensions from the indicated strains. (C, left) The suspension from DGA1 cells consists of single droplets and small aggregates. (C, right) An edge of a DGA1|pet10Δ aggregate. (D) Cells from the indicated strains were grown in SD or OA media for 24 h and stained with BODIPY. (E) The percentage of cells cultured in OA (experiment in D) with supersized (SS) droplets (>1.0 µm in diameter). (F) TG determined in whole-cell extracts from cells in the experiment shown in D and E. (G) Cells were cultured for 24 h in OA medium (as in D–F) and stained with BODIPY and Calcofluor White to identify mother cells. The Calcofluor White layer was pseudocolored white. The experiment was repeated once. (H) Quantification of mother cells with supersized droplets from experiment in G. (I) Diagram to illustrate possible fusion events in OA culture as lipid droplets (LDs) expand in the absence of Pet10p. BF, brightfield; CW, Calcofluor white. For B, E, F, and H, error bars represent SEM over all replicate experiments. **, P < 0.01; ***, P < 0.001. Bars, 5 µm.
Figure 5.
Figure 5.
Pet10p binds early to nascent droplets and promotes biogenesis. Droplet formation was induced by galactose addition. (A–D) Cells were cultured in galactose medium and BODIPY for the indicated times. (A) The appearance of droplets (BODIPY stained) GALDGA1 cells. (B) Comparison of the number of cells with lipid droplets (LDs) in the GALDGA1 control versus the GALDGA1|pet10Δ strain. (C) The number of lipid droplets per cell in cells with droplets (thicker black bar represents median). At least 500 cells were scored at each time point per strain over three experiments. (D) Comparison of TG levels in cells after 2 h of induction. (E–H) After 40 min in galactose medium, cells containing BODIPY and fluorescent protein tags were transferred to a microscope slide to monitor appearance of nascent droplets (arrows). (E) An example of the appearance of two Pet10-tdTomato puncta 5 min before BODIPY staining. (F) Appearance of punctate Pet10-tdTomato with respect to BODIPY over time. Data represent 80 droplets appearing over three experiments. (G) An example of Pet10-tdTomato puncta appearing before Erg6-mTFP or BODIPY. Asterisks show a rare situation in which Erg6-mTFP and BODIPY appear before Pet10-tdTomato. (H) Lack of Tgl3-mTFP appearance during the time course. (I) Appearance of Erg6-mTFP or Tgl3-mTFP before and after 24 h in galactose medium. For B, D, and F, error bars represent SEM over all replicate experiments. *, P < 0.05. Bars, 5 µm.
Figure 6.
Figure 6.
Pet10p functionally interacts with seipin and Fit2 proteins to determine droplet number and size. (A) Cells were stained with BODIPY; the corresponding brightfield (BF) images are shown below. (B) The percentage of cells with supersized (SS) droplets (diameter > 0.5 µm) is plotted. (C) Pet10-tdTomato targets to seipin- and Fit2-null droplets. Shown are the red channel and a merge of the red, green, and brightfield channels. (D) Droplets in cells containing a supersized droplet (red) or lacking supersized droplets (blue) were counted in the indicated strains (closed circles) or corresponding ones that lacked PET10 (open circles). Droplets in 60 cells were scored in each strain. No cells with supersized droplets were seen in the DGA1 control strain. For B and D, error bars represent SEM over all replicate experiments. ***, P < 0.001. Bars, 5 µm.
Figure 7.
Figure 7.
Pet10p is epistatic to seipin and Fit2 in TG accumulation. (A) TG was determined in the indicated strains and compared with the DGA1 control. Note that strains are paired—the only difference being the presence or absence of PET10. (B) TG was determined in crude membrane and lipid droplet (LD) fractions and plotted relative to the total within each strain (left) or compared with the DGA1 control (right). (C and D) DAG in the strains was determined and plotted relative to the DGA1 strain. (C) Whole cells. (D) Membranes and droplets analyzed separately. Error bars represent SEM over all replicate experiments. **, P < 0.01; ***, P < 0.001.
Figure 8.
Figure 8.
Pet10p is one of two PAT-containing proteins in yeast. (A) Two-dimensional CLANS diagram (Frickey and Lupas, 2004) depicts sequence similarity (lines) between identified fungal sequences (nodes). Clustered nodes are labeled by gene name of representative and colored by family: MPL1 (blue), SPS4 (magenta), PET10 (red), sparse intermediate family (orange), family of hypothetical proteins (green), and others (black). (B) Proposed domain structure of Pet10p. (C) Alignment of known PAT domains from human perilipins Plin 1–Plin 3 and M. anisopliae Mpl1 with S. cerevisiae Sps4p and Pet10p highlights conserved positions: hydrophobic (yellow), small (gray), basic (blue), and acidic (red). Predicted secondary structure above alignment with helices as cylinders. Residue numbers of the first position in the alignment are on the left, and omitted residue counts are in brackets. (D) Alignment of fungal Pet10p family C-terminal sequence regions is depicted and colored as described previously, with additional conservations: aromatic (dark yellow), polar (black), and repeat threonines (orange). Secondary structures are colored according to sequence regions in B. (E) A helical wheel diagram of Pet10p conserved hydrophobic segment colored as in D. (F–I) Parallel cultures in three or four independent experiments were harvested for whole-cell TG analysis (F and H) or subjected to lipid droplet (LD) isolation, resuspension, and light scattering at 600 nm (G and I). Note that strains in the left panels are based on W303 wild type with plasmid expression of heterologous proteins, whereas those in the right panels are based on the DGA1 background with PLIN3 replacing PET10 in the chromosome as indicated. (J) Plasmids containing GFP-PLIN3 or GFP-OLEOSIN1 were expressed in the DGA1-tdTomato|pet10Δ strain. AutoDOT (pseudocolored white) tagged the droplets (Yang et al., 2012). (K) Localization of DGA1-tdTomato in the indicated strains. For panels F–I, error bars represent SEM over all replicate experiments. *, P < 0.05; **, P < 0.01; ***, P < 0.001. Bars, 5 µm.
Figure 9.
Figure 9.
Working model of the contribution of Pet10p to droplet assembly. Membranes oriented with cytosol above ER lumen. (Left) Nascent droplets in the presence or absence of seipin, Fit2, or Pet10p, as indicated. These proteins are proposed to work cooperatively to control the rate of flux of TG and the final size of droplets. Arrows signify flux of TG relative to the droplet; dashed arrows represent less certain flux. Flux to droplet may depend on accompanying flux of phospholipids. The Fit2p icon has a dashed-line perimeter, as its early localization to droplets has not been demonstrated. Whether its localization is affected by the presence of seipin is also unknown. (Right) Growing droplets at a lower magnification derived from the nascent structures. Droplets occurring independently of these proteins as a result of TG saturation of the ER and membrane instability, forming droplets of varying sizes, including supersized, are not depicted. Morphology in Fit2 deletion mutants based on published work (Choudhary et al., 2015).

References

    1. Adeyo O., Horn P.J., Lee S., Binns D.D., Chandrahas A., Chapman K.D., and Goodman J.M.. 2011. The yeast lipin orthologue Pah1p is important for biogenesis of lipid droplets. J. Cell Biol. 192:1043–1055. 10.1083/jcb.201010111 - DOI - PMC - PubMed
    1. Altschul S.F., Madden T.L., Schäffer A.A., Zhang J., Zhang Z., Miller W., and Lipman D.J.. 1997. Gapped BLAST and PSI-BLAST: A new generation of protein database search programs. Nucleic Acids Res. 25:3389–3402. 10.1093/nar/25.17.3389 - DOI - PMC - PubMed
    1. Athenstaedt K., and Daum G.. 2003. YMR313c/TGL3 encodes a novel triacylglycerol lipase located in lipid particles of Saccharomyces cerevisiae. J. Biol. Chem. 278:23317–23323. 10.1074/jbc.M302577200 - DOI - PubMed
    1. Athenstaedt K., and Daum G.. 2005. Tgl4p and Tgl5p, two triacylglycerol lipases of the yeast Saccharomyces cerevisiae are localized to lipid particles. J. Biol. Chem. 280:37301–37309. 10.1074/jbc.M507261200 - DOI - PubMed
    1. Athenstaedt K., Zweytick D., Jandrositz A., Kohlwein S.D., and Daum G.. 1999. Identification and characterization of major lipid particle proteins of the yeast Saccharomyces cerevisiae. J. Bacteriol. 181:6441–6448. - PMC - PubMed

MeSH terms