Expansion of the ISWI chromatin remodeler family with new active complexes
- PMID: 28801535
- PMCID: PMC5623870
- DOI: 10.15252/embr.201744011
Expansion of the ISWI chromatin remodeler family with new active complexes
Abstract
ISWI chromatin remodelers mobilize nucleosomes to control DNA accessibility. Complexes isolated to date pair one of six regulatory subunits with one of two highly similar ATPases. However, we find that each endogenously expressed ATPase co-purifies with every regulatory subunit, substantially increasing the diversity of ISWI complexes, and we additionally identify BAZ2B as a novel, seventh regulatory subunit. Through reconstitution of catalytically active human ISWI complexes, we demonstrate that the new interactions described here are stable and direct. Finally, we profile the nucleosome remodeling functions of the now expanded family of ISWI chromatin remodelers. By revealing the combinatorial nature of ISWI complexes, we provide a basis for better understanding ISWI function in normal settings and disease.
Keywords: ACF; BAZ; SMARCA; ISWI ATPase; chromatin remodelers.
© 2017 Genentech, Inc.
Conflict of interest statement
All authors are or were employees of Genentech, Inc. The authors declare that they have no conflict of interest.
Figures

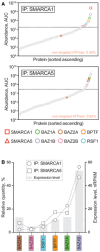
Mass spectrometry analysis of proteins recovered by immunoprecipitation (IP) of SMARCA1 (top) or SMARCA5 (bottom) as described in Materials and Methods. Symbols represent individual identified proteins (listed in Dataset EV2). Filled red circles represent the non‐targeted ATPase; its relative abundance is reported on the graph. Dotted lines demarcate the top 30 hits cutoff.
Relative distributions of the indicated regulatory subunits co‐enriched with SMARCA1 or SMARCA5. Expression levels (mRNA) are shown for comparison (see Materials and Methods) 52.

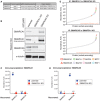
Details of the sgRNAs used to abrogate expression of SMARCA1 and SMARCA5 by CRISPR/Cas9‐mediated genome editing.
Western blotting confirms depletion of SMARCA1 and SMARCA5 in engineered cell lines. The arrowhead shows non‐specific staining, likely of SMARCA5, by the anti‐SMARCA1 antibody. The asterisk (*) labels an unspecific band detected by the SMARCA5 antibody.
Quantity of SMARCA1 and SMARCA5 recovered after immunoprecipitation of SMARCA1 from lysates of parental or SMARCA1‐knockout cells. Graphed data represent absolute values. Numerical values above the symbols are normalized recoveries relative to that of SMARCA1 in parental cells.
Same as (C) but for the immunoprecipitation of SMARCA5 from lysates of parental or SMARCA5‐knockdown cells.
Same as Fig 1A, but IP of SMARCA1 (top) and SMARCA5 (bottom) was carried from SMARCA5‐knockdown and SMARCA1‐knockout cells, respectively.

Immunoprecipitation of SMARCA1 or SMARCA5 from HEK293 cell lysates, and Western blotting with the indicated antibodies.
Immunoprecipitation of BAZ1A, BPTF, or CECR2 from HEK293 cell lysates and Western blotting with the indicated antibodies. SMARCA ATPases in parentheses refer to previously identified complexes.
Relative quantitation of SMARCA1 and SMARCA5 recovered from immunoprecipitations of BAZ1A and BAZ1B from HeLa or NTERA‐2 cells, as indicated. Expression levels (nRPKM) of SMARCA1 and SMARCA5 are 20.2 and 24.3 in HeLa cells, and 17.9 and 35.3 in NTERA‐2 cells, respectively 52.

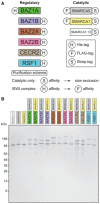
Tagging and purification schemes for recombinant ISWI complexes and uncomplexed catalytic subunits. Tags shown at left or right of the cartoon indicate fusion at the N‐ or C‐terminus, respectively.
Denaturing SDS–PAGE of the purified ISWI protein or complex indicated. Bands were visualized by silver staining.

Scheme for the remodeling assay using Cy5 (pink) and Cy3 (cyan) fluorescently labeled nucleosomes. The superposition in the gel of Cy5 and Cy3 signals is shown in shades of blue to mimic different proportions and quantities: see panel (B).
Nucleosome remodeling assay with the indicated purified ISWI protein or complex as described in Materials and Methods (products quantified in Fig EV3).
Fraction of edge‐positioned nucleosomes that were repositioned to the center by the indicated regulatory subunit in complex with either SMARCA1 or SMARCA5. Proximity to the diagonal line in gray indicates the similarity of output for SMARCA1‐ and SMARCA5‐containing complexes. Data points and rectangular contours represent the mean and SD of four independent experiments, respectively.

For each ISWI complex or uncomplexed catalytic subunit, the intensity of the signal at the positions equivalent to those of the four visible bands produced by the ATPase alone (SMARCA1 or SMARCA5) is reported, normalized to the total intensity. These four bands are produced by four distinct nucleosome positions, termed edge, intermediate 1, intermediate 2, and center. The exact nucleosome position of intermediates 1 and 2 is undetermined and their numbering is arbitrary. Data are reported as mean values ± SD of values from four independent experiments.

Top: time‐course nucleosome sliding assay using purified ACF‐5 (left) or ACF‐1 (right) complexes. Bottom: quantification of the signal intensity for bands corresponding to “edge” and “center” nucleosomes for nucleosomes starting at the “edge” position (panel boxed in orange). Single data points are reported from two independent experiments. The data were fitted to a one‐phase exponential decay distribution.
Same as Fig 3B, but the reaction time was increased from 30 to 60 min (see Materials and Methods).
Denaturing SDS–PAGE of the indicated ISWI complex. Protein bands were visualized by Coomassie staining.
Nucleosome remodeling assay with the indicated purified ISWI complex. Reported images are representative of those from at least three independent experiments.


ATP hydrolysis was quantified as a function of time for the indicated ISWI proteins or complexes, as described in Materials and Methods. Duplicate measurements are reported. The data were fitted to a linear regression by minimizing the sum of squares, and the fitted slopes (rate of ATP hydrolysis) are reported in Fig 4.
Comment in
-
Chromatin remodeling: a complex affair.EMBO Rep. 2017 Oct;18(10):1673-1674. doi: 10.15252/embr.201744852. Epub 2017 Aug 23. EMBO Rep. 2017. PMID: 28835548 Free PMC article.
References
MeSH terms
Substances
LinkOut - more resources
Full Text Sources
Other Literature Sources
Molecular Biology Databases

