. 2017 Aug 11;7(1):7927.
doi: 10.1038/s41598-017-08513-w.

Deficiency in catechol-o-methyltransferase is linked to a disruption of glucose homeostasis in mice

Affiliations

Deficiency in catechol-o-methyltransferase is linked to a disruption of glucose homeostasis in mice

Megumi Kanasaki et al. Sci Rep. .

Abstract

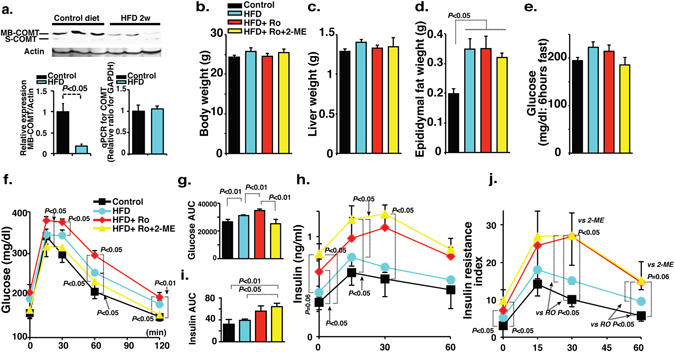
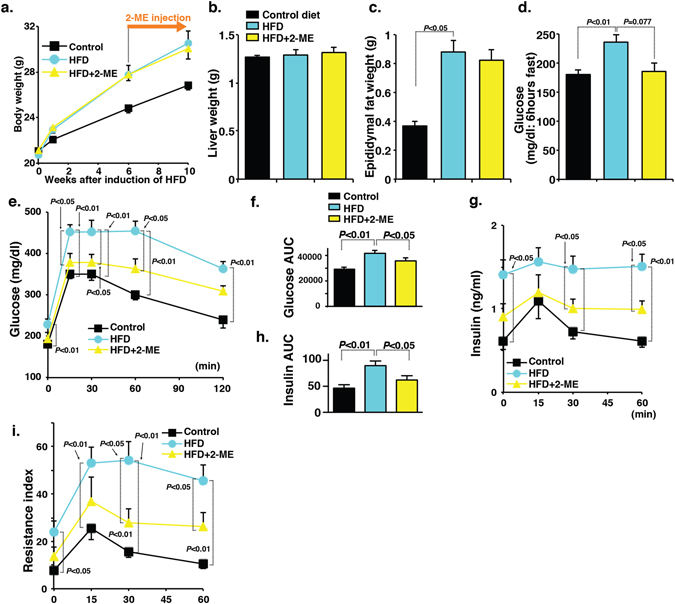
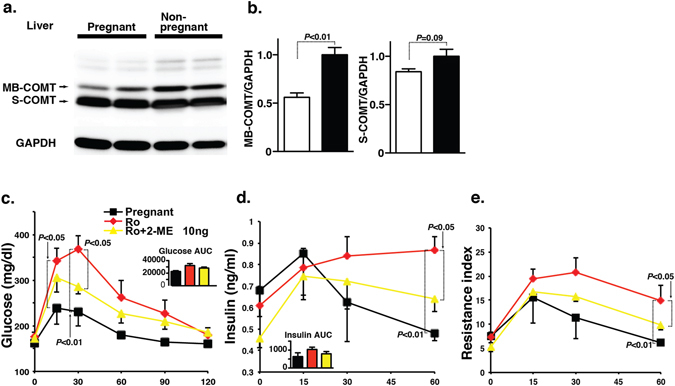
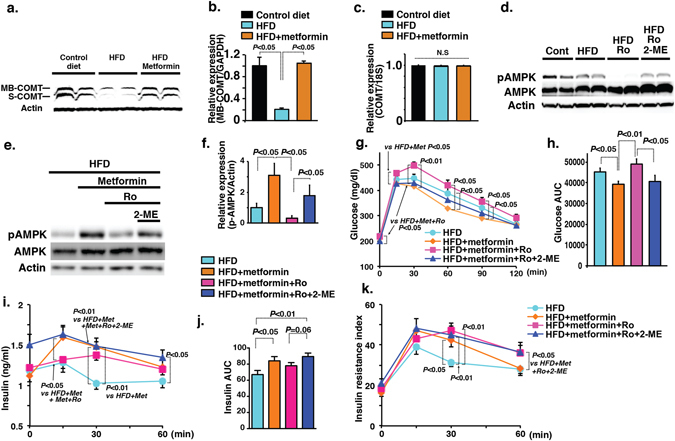
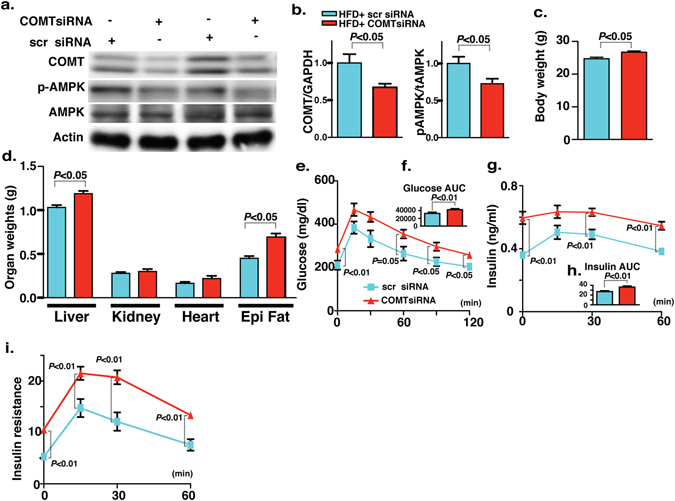
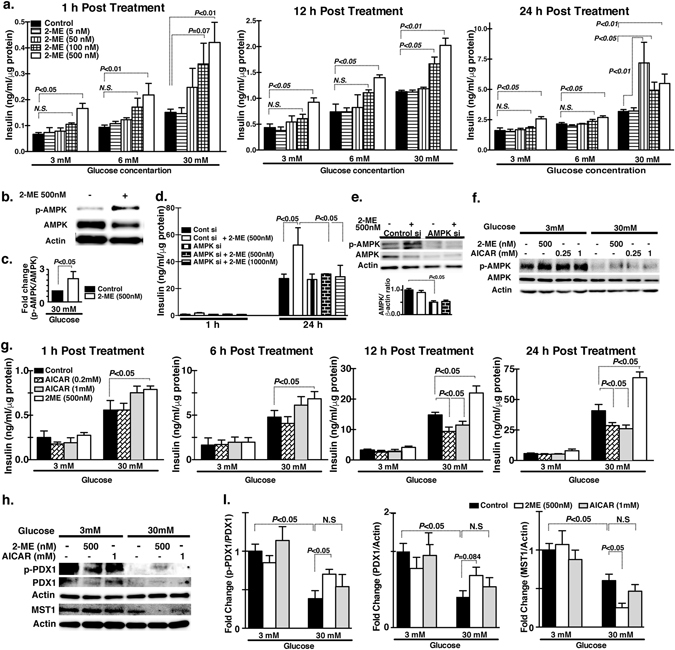
2-methoxyestradiol (2-ME), an estrogen metabolite generated via catechol-o-methyltransferase (COMT), is multifunctional methoxy-catechol. Here, we report that COMT deficiency leads to glucose intolerance and 2-ME rescues COMT-deficient-associated metabolic defects. Liver COMT protein was suppressed in high fat diet (HFD)-fed or in pregnant mice. COMT suppression, by Ro41-0960 or siRNA, in HFD fed mice or in pregnant mice exacerbated glucose intolerance; 2-ME intervention ameliorated these defects. 2-ME effects on glucose tolerance were associated with AMPK phosphorylation in the liver and in islet cells. Metformin restored liver COMT protein levels, and metformin-induced liver AMPK phosphorylation was abolished by COMT inhibition. The amelioration in glucose tolerance by 2-ME was associated with biphasic insulin secretion in an environment-dependent manner. 2-ME-induced insulin secretion was associated with the AMPK phosphorylation, PDX-1 phosphorylation, and MST-1 suppression in MIN-6 cells. Furthermore 2-ME displayed PPARγ agonist-like activity. These results suggest that COMT is an enzyme to maintain glucose homeostasis and 2-ME is a potential endogenous multi-target anti-diabetic candidate.


Conflict of interest statement

The authors declare that they have no competing interests.

Figures

Figure 1
Figure 1
Inhibition of COMT exacerbates glucose tolerance defects in mice fed the HFD for 2 weeks. (a) Western blot analysis of COMT protein in the liver of HFD condition. The protein lysate (20 µg) was separated in polyacrylamide gels and transferred onto a PVDF membrane. The immunoreactive bands were analyzed using the ECL method. Representative blots from six independent experiments are shown. Cropped images were displayed and original blots are shown in the figure Supplementary 10. Quantification by densitometry is shown and reveals a significant reduction of the COMT protein level in mice fed an HFD for 2 weeks. N = 8 from each group were analyzed. Relative COMT gene expression by qPCR analysis in the liver of HFD mice expressing unaltered mRNA level. N = 6 from each group were analyzed. (bd) The body, liver weight, and epididymal fat weights and fasting blood glucose levels were analyzed in control, HFD, COMT inhibitor (Ro41-0960)-treated HFD mice (HFD + Ro41-0960) and 2-ME intervened COMT inhibitor-treated HFD (HFD + Ro41-0960 + 2-ME) mice groups. N = 8 were analyzed in each mice group. (e) 6 hours fasting blood glucose levels were analyzed in control, HFD, COMT inhibitor (Ro41-0960)-treated HFD mice (HFD + Ro41-0960) and 2-ME intervened COMT inhibitor-treated HFD (HFD + Ro41-0960 + 2-ME) mice groups. N = 8 in each group. (f) IPGTT analysis. N = 8 were analyzed in each mice group. (g) The quantitative determination of glucose tolerance defects represented by the area under curve (AUC) value. (h) Insulin levels determined by ELISA. The insulin level was analyzed in triplicate by a sandwich ELISA method. N = 8 were analyzed in each mice group. (i) The AUC value of the insulin level. (j) Insulin resistance Index. The results are shown as the mean ± s.e.m. COMT inhibitor (Ro41-0960) was designated as Ro in the figure. N = 8 were analyzed in each mice group. Prism7.0 software was utilized for the statistical calculation. The Mann-Whitney test was carried out to determine of statistical significance.
Figure 2
Figure 2
2-ME interventions for 4 weeks ameliorate glucose tolerance defects in chronic HFD induced-insulin-resistant mice. (ad) Body weight, liver weight, epididymal weight and fasting blood glucose levels were analyzed in control, HFD, and 2-ME intervened HFD mice. N = 8 were analyzed in each group. (e) The IPGTT analysis. N = 8 from each group were analyzed. (f) Measurement of AUC value of glucose. (g) Insulin level. N = 8 were analyzed in each data set. (h) AUC value of insulin. (i) Insulin resistance index. The data in the figures are shown as the mean ± s.e.m. N = 8 were analyzed in each data set. The Mann-Whitney test was carried out to determine of statistical significance. Prism7.0 software was utilized for the statistical calculation. The mice fed the control diet are designated as “control”, whereas the mice fed the HFD are designated as “HFD”.
Figure 3
Figure 3
Inhibition of COMT during gestation contributes to glucose tolerance defects. (a) Western blot analysis of COMT protein level in the liver of pregnant and non-pregnant mice. Representative blot from 5 blots is shown. Cropped images were displayed and original blots are shown in the figure Supplementary 11. (b) Densitometric analysis of MB-COMT and S-COMT. Data were normalized to GAPDH. N = 5 were analyzed. (c) IPGTT analysis of pregnant, Ro-treatment and 2-ME (10 ng)-intervened Ro-treated mice groups at day 16 of pregnancy. Ro41-0960 treatment with or without 2-ME interventions were performed during day 10 to day 16 of the pregnant mice. Control N = 4, Ro41-0960 N = 3, and Ro41-0960 + 2-ME N = 3 were analyzed. (d) Insulin level was estimated at 0, 15-, 30-, 45- and 60-min time intervals. (e) Resistance index. N = 3 were analyzed in each mice group. The results are shown as the mean ± s.e.m. and are indicated in the figures. COMT inhibitor (Ro41-0960) was designated as Ro in the figure. The results in the figures are shown as the mean ± s.e.m. The Mann-Whitney test was carried out to determine of statistical significance. Prism7.0 software was utilized for the statistical calculation. Membranous COMT is designated as “MB-COMT”, whereas soluble COMT is designated as “S-COMT”.
Figure 4
Figure 4
COMT is involved in the anti-diabetic action of metformin. (a,b) Western blot analysis of COMT protein level in the liver of control, HFD and metformin-treated HFD mice. Representative picture from 5 blots is shown. Cropped images were displayed and original blots are shown in the figure Supplementary 12. Densitometric data are normalized to actin. (c) COMT mRNA expression analysis. N = 3 were analyzed. (d) Representative image of western blot analysis of AMPK phosphorylation in the liver of control, HFD, HFD + Ro and Ro + metformin-treated HFD mice. N = 4 were analyzed per group. Cropped images were displayed and original blots are shown in the figure Supplementary 12. (e,f) Evaluation of AMPK phosphorylation by western blot analysis in the liver of metformin-treated HFD mice either administered Ro or Ro and 2-ME together. A representative image from 5 blots is shown. Cropped images were displayed and original blots are shown in the figure Supplementary 12. Densitometry data were normalized to total-AMPK. N = 4 were analyzed in each group. (g) IPGTT analysis. N = 9 were analyzed in each group. (h) AUC value of glucose. (i,j) Insulin level and AUC value of insulin. (k) Insulin resistance index. N = 8 or 9 were analyzed in each group. Data in the figures are expressed as the mean ± s.e.m. COMT inhibitor (Ro41-0960) was designated as Ro in the figure. Prism7.0 software was utilized for the statistical calculation. The Mann-Whitney test was carried out to determine of statistical significance.
Figure 5
Figure 5
COMT siRNA-mediated silencing introduces the features of type 2 diabetes and metabolic syndrome in HFD mice. (a,b) Western blot analysis of COMT and AMPK phosphorylation in the liver of scramble and COMT siRNA-injected mice. Scramble and COMT siRNA were injected intraperitoneally once weekly for 3 weeks at a dose of 10 mg/kg body weight. A representative image from 6 blots is shown. Cropped images were displayed and original blots are shown in the figure Supplementary 13. Densitometric data analysis is normalized to Actin. N = 6 were analyzed in each data set. (c,d) Body weight and organ weight measurements in the scramble and COMT siRNA injected mice. N = 6 were analyzed. (e) IPGTT analysis. N = 6 were analyzed in each data set. (f) glucose AUC value. (g,h) Insulin value at different time intervals (0, 15, 30 and 60 min post glucose load) with AUC. N = 6 were analyzed in each data set. (i) Insulin resistance index. N = 6 were analyzed in each data set. Data in the graph are shown as the mean ± s.e.m. Scramble siRNA was designated as scr siRNA whereas COMT siRNA was designated as COMTsiRNA in the figure. Prism7.0 software was utilized for the statistical calculation. The Mann-Whitney test was carried out to determine of statistical significance.
Figure 6
Figure 6
2-ME induced insulin secretion in MIN6 cells. (a) Time-dependent insulin secretion by 2-ME (5, 50, 100 and 500 nM concentrations) at 3 mM, 6 mM and 30 mM medium glucose concentrations. Insulin estimation by the ELISA method performed in triplicate. Three sets of independent experiments were performed. (b,c) Western blot data analysis of control and 2-ME-treated MIN6 cells. A representative image of 5 blots is shown. Cropped images were displayed and original blots are shown in the figure Supplementary 14. Densitometry data were normalized to β-actin. (d) Time-dependent insulin secretion by 2-ME in the scramble and AMPK siRNA transfected MIN6 cells. Scramble and AMPK siRNA were transfected using lipofectamine 2000 at 100 nM concentration in cells. Insulin estimation was performed in triplicate. Three sets of independent experiments were analyzed. (e) Western blot analysis of total AMPK and AMPK phosphorylation protein levels in the scramble and AMPK siRNA transfected MIN6 cells. A representative image from 5 blots is shown. Cropped images were displayed and original blots are shown in the figure Supplementary 14. Densitometry data normalized to β-actin. (f) Western blot analysis of total AMPK and AMPK phosphorylation after treatment with 2-ME and AICAR at 3 mM glucose and 30 mM glucose concentration. A representative image from 4 blots is shown. Cropped images were displayed and original blots are shown in the figure Supplementary 15. (g) Time-dependent insulin level in 2-ME and AICAR-treated cells in the 3 mM glucose and 30 mM glucose media concentration. Insulin estimation assays were performed in triplicate. (h,i) Western blot analysis of PDX1, PDX1 phosphorylation and MST1 in 2-ME and AICAR-treated cells under 3 mM and 30 mM of glucose concentration for 24 hours. A representative image of 4 blots is shown. Cropped images were displayed and original blots are shown in the figure Supplementary 16. Densitometry data were normalized to Actin. N = 4 were analyzed in each data set. The data in the graph are shown as the mean ± s.e.m. Prism3 software was utilized for the statistical calculation. The One way Anova (Tukey test) was carried out to determine of statistical significance.

References

    1. Kanasaki K, Kalluri R. The biology of preeclampsia. Kidney Int. 2009;76:831–837. doi: 10.1038/ki.2009.284. - DOI - PMC - PubMed
    1. Shenoy V, Kanasaki K, Kalluri R. Pre-eclampsia: connecting angiogenic and metabolic pathways. Trends Endocrinol Metab. 2010;21:529–536. doi: 10.1016/j.tem.2010.05.002. - DOI - PubMed
    1. Kanasaki K, et al. Deficiency in catechol-O-methyltransferase and 2-methoxyoestradiol is associated with pre-eclampsia. Nature. 2008;453:1117–1121. doi: 10.1038/nature06951. - DOI - PubMed
    1. Shand FH, et al. In vitro and in vivo evidence for anti-inflammatory properties of 2-methoxyestradiol. The Journal of pharmacology and experimental therapeutics. 2011;336:962–972. doi: 10.1124/jpet.110.174854. - DOI - PubMed
    1. Tunbridge, E. M., Harrison, P. J. & Weinberger, D. R. Catechol-o-methyltransferase, cognition, and psychosis: Val158Met and beyond. Biol Psychiatry. 60, 141–151. Epub 2006 Feb 2014 (2006). - PubMed

Publication types