. 2017 Aug 10;170(4):748-759.e12.
doi: 10.1016/j.cell.2017.07.014.

The Neuropeptide Corazonin Controls Social Behavior and Caste Identity in Ants

Affiliations

The Neuropeptide Corazonin Controls Social Behavior and Caste Identity in Ants

Janko Gospocic et al. Cell. .

Abstract

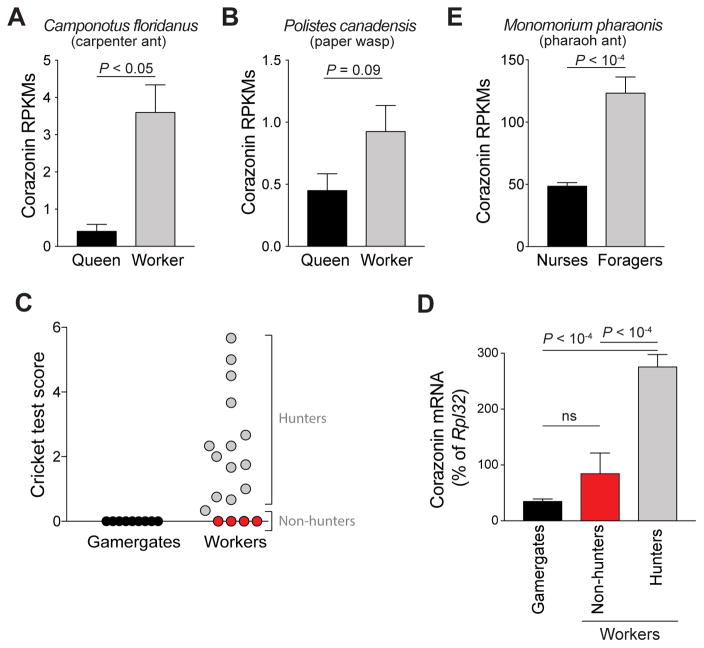
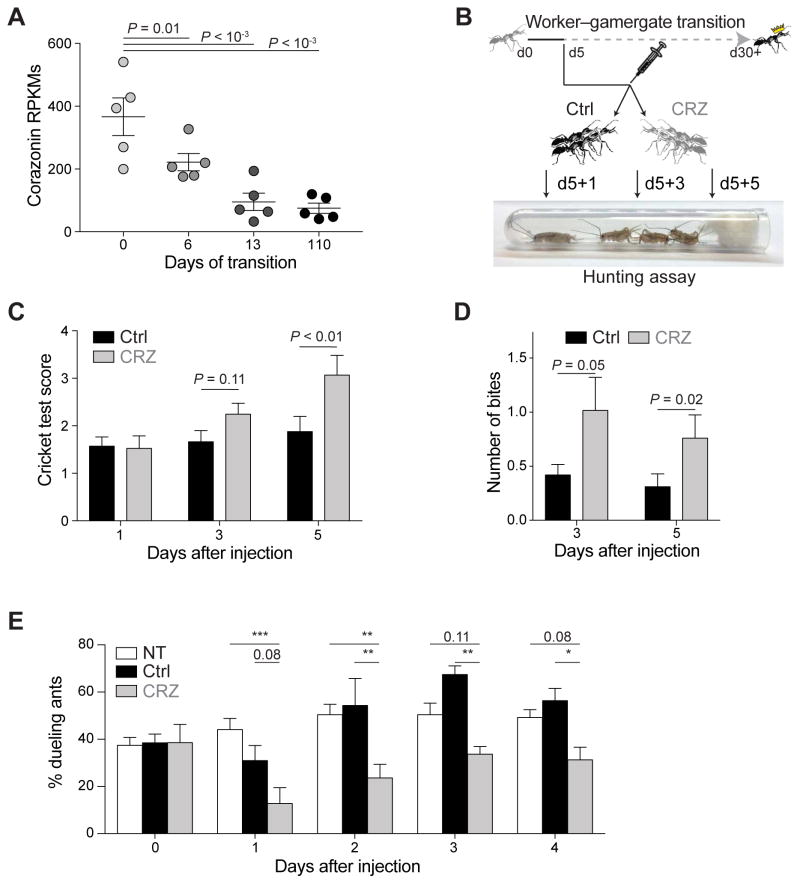
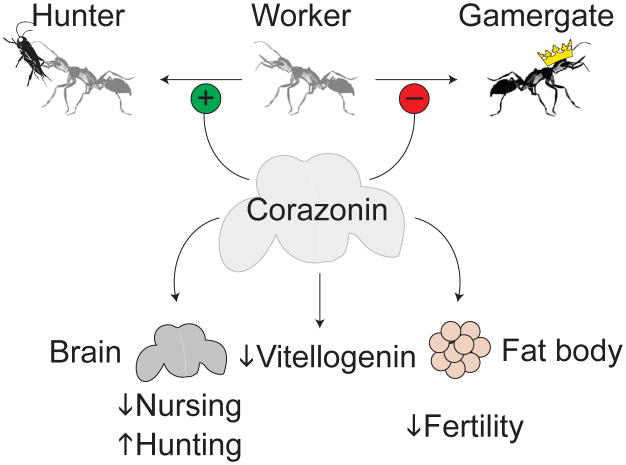
Social insects are emerging models to study how gene regulation affects behavior because their colonies comprise individuals with the same genomes but greatly different behavioral repertoires. To investigate the molecular mechanisms that activate distinct behaviors in different castes, we exploit a natural behavioral plasticity in Harpegnathos saltator, where adult workers can transition to a reproductive, queen-like state called gamergate. Analysis of brain transcriptomes during the transition reveals that corazonin, a neuropeptide homologous to the vertebrate gonadotropin-releasing hormone, is downregulated as workers become gamergates. Corazonin is also preferentially expressed in workers and/or foragers from other social insect species. Injection of corazonin in transitioning Harpegnathos individuals suppresses expression of vitellogenin in the brain and stimulates worker-like hunting behaviors, while inhibiting gamergate behaviors, such as dueling and egg deposition. We propose that corazonin is a central regulator of caste identity and behavior in social insects.

Keywords: ants; brain; corazonin; epigenetics; foraging; gene regulation; neuropeptides; social behavior; transcriptomes; vitellogenin.


Figures

Figure 1
Figure 1. Phenotypic and Molecular Changes During the Worker–Gamergate Transition
(A) On day 0, young workers were transferred from stable colonies to new boxes without dominant reproductives. Tournaments typically began three days later and lasted for 3–4 weeks. Four months (d120) after transfer, brains (minus optic lobes) were processed for RNA-seq. (B) Fraction of individuals engaged in dueling interactions as percentage of total individuals in the colony. Bars represent the mean of ≥ 5 colony replicates + s.e.m. (C) Colony composition after tournaments. The reproductive status of the originally transferred (top) and newly eclosed (bottom) individuals was determined by the presence (upper image) or absence (lower image) of mature oocytes in their dissected ovaries. Bars represent the mean of 5 colony replicates + s.e.m. Scale bars in the microphotographs correspond to 0.5 mm. (D) Volcano plot of RNA-seq from brains of workers and gamergates after 120 days of transition. Each circle represents a protein-coding gene. Differential genes with FDR < 0.1 are highlighted in blue. Data is from 11 worker and 12 gamergate brain replicates. (E) Biological process GO terms significantly (FDR < 10%) enriched in the 112 differentially expressed genes (DEGs) in the worker–gamergate comparison from (D). Terms discussed in the text are in bold. (F) Reads per kilobase per million (RPKMs) for corazonin RNA from brains of gamergates and workers 120 days after transition, as well as age-matched workers from stable colonies. Each circle represents a single brain. Means ± s.e.m. are shown. P-values are from one-way ANOVA (F(2, 16) = 15.56, P = 0.0002) and Holm-Sidak test. See also Figure S1, Table S1–2, Movie S1.
Figure 2
Figure 2. Corazonin Is a Conserved Marker of Foraging Activity
(A) RNA-seq levels of corazonin in the whole bodies of mated queens and combined major and minor workers of Camponotus floridanus. Data is from 2 (queens) or 4 (workers) biological replicates. P-value is from a two-sided t-test. (B) RNA-seq levels of corazonin from brains of workers and reproductive queens of the paper wasp Polistes canadensis (Patalano et al., 2015). Data is from 4 (queens) or 6 (workers) replicates. P-value is from a two-sided t-test. (C) Cricket test score in stable Harpegnathos colonies for gamergates and workers. Each circle is an individual ant. The experiment was performed in 4 separate colonies. (D) RT-qPCR for corazonin in the brain of individuals tested for hunting activity in (C). Workers were stratified in non-hunters (cricket test score = 0; red bar) and hunters (cricket test score > 0; gray bar). Bars represent mean + s.e.m. P-values are from one-way ANOVA (F(2, 31) = 63.26, P < 0.0001) and Holm-Sidak test. (E) RNA-seq levels of corazonin in heads of Monomorium pharaonis workers engaged in nursing or foraging behaviors. Data is from ≥ 9 biological replicates per group. P-value is from a two-sided t-test. See also Figure S2.
Figure 3
Figure 3. Corazonin Stimulates Hunting and Inhibits Dueling
(A) RNA-seq levels for corazonin at different time points (days) of transition. Three whole brains (including optic lobes) per time point were pooled and sequenced from five independent colonies (individual circles). Horizontal bars indicate mean ± s.e.m. P-values are from one-way ANOVA and Holm-Sidak test. (B) Dueling individuals at day 5 of the transition were injected with corazonin (CRZ) or scrambled control (ctrl). Hunting behavior was quantified one, three, and five days after injection using the cricket-in-the-tube test. (C) Cricket test scores for corazonin- and control-injected ants. Each micro-colony contained 3 individuals injected with corazonin peptide and 3 injected with a control scrambled peptide. Bars show the mean scores of > 40 biological replicates (micro-colonies of 3 + 3 ants) + s.e.m. P-values are from two-sided Wilcoxon tests. (D) Same as (C) but only biting events were scored. (E) In transitioning colonies of 30 individuals, half of the ants were injected with corazonin peptide (CRZ) and half with control scrambled peptide (Ctrl). As an additional control, some colonies were left untreated (NT). Bars show the mean of the percentage of ants observed to duel in each colony + s.e.m. Data is from ≥ 4 biological replicates (colonies); i.e., ≥ 120 injected individuals. P-values are from ANOVA and Holm-Sidak tests. See also Figure S3–4, Movie S2–6.
Figure 4
Figure 4. Corazonin Receptor Knock-down Decreases Hunting
(A) RT-qPCR for the corazonin receptor in the brains and fat bodies of workers and gamergates from stable colonies. Bars represent the mean from 4 biological replicates (individual ants) + s.e.m. Differences in the brain are not significant. P-value is from a two-sided t-test. (B) RT-qPCR for the corazonin receptor in the brains of ants injected with siRNAs against the corazonin receptor or control siRNAs against GFP. Bars represent the mean from ≥ 7 biological replicates + s.e.m. P-value is from a two-sided t-test. (C) Cricket test scores after corazonin receptor knock-down. Bars represent means from ≥ 12 biological replicates (micro-colonies) per group per time point + s.e.m. P-value is from a two-sided Wilcoxon test. See also Figure S5.
Figure 5
Figure 5. Corazonin Injections and Receptor Knock-down Affect Caste-Specific Genes
(A) MA plot of RNA-seq data from brains of transitioning ants, 24 hours after injections with corazonin peptide (CRZ) or scrambled control (Ctrl). Genes with P < 0.01 are highlighted in black. Data are from ≥ 10 biological replicates (individual ants) per condition. (B) Genes affected by corazonin injections from (A) overlap significantly with genes differentially expressed in the worker–gamergate transition from Fig. 1D. Genes were ranked by the product of the absolute log-fold-change multiplied by the log-converted P-value. Overlap between the first 500 genes in each list is shown (black line) compared to 100,000 random permutations (orange line + confidence interval). P-value was computed empirically based on the permutations. (C) Comparison of log-fold-change for differentially expressed genes (P < 0.01) present in both the worker vs. gamergate comparison (x axis) and the corazonin peptide vs. control peptide injection comparison (y axis). (D) MA plot of RNA-seq data from brains of transitioning ants, 24 hours after injections with siRNAs against the corazonin receptor (KD) or GFP (Ctrl). Genes with P < 0.01 are highlighted in black. Data are from 9 biological replicates (individual ants) per condition. (E–F) Same as (B–C) but comparing genes ranked for their changes after corazonin peptide of CrzR siRNA injections. See also Table S3–4.
Figure 6
Figure 6. Vitellogenin Is a Target of Corazonin and Regulates Hunting and Reproductive Behavior
(A) RNA-seq levels of vitellogenin in whole brains (including optic lobes) during the transition. Values are from the same RNA-seq dataset as in Fig. 3A. Horizontal bars indicate mean ± s.e.m. P-values are from one-way ANOVA and Holm-Sidak test. (B–C) RT-qPCR of vitellogenin in ant brains one day after injection of corazonin and control peptides (B) or CrzR and GFP siRNAs (C) in the head. Data are expressed relative to control GFP siRNA injections. Bars represent the mean from ≥ 7 biological replicates (individual ants) per group + s.e.m. P-values are from two-sided t-tests. (D–E) RT-qPCR for vitellogenin (D) and corazonin (E) in the brains of ants injected with siRNAs against vitellogenin or GFP. Bars represent the mean from ≥ 7 biological replicates per condition + s.e.m. P-value is from a two-sided t-tests. (F) Cricket test scores after vitellogenin knock-down. Bars represent means from ≥ 16 biological replicates (micro-colonies) per group per time point + s.e.m. P-value is from a two-sided Wilcoxon tests. (G) RT-qPCR for vitellogenin in the fat body of workers and gamergates. Bars represent the mean from 4 biological replicates (individual ants) per group + s.e.m. P-value is from a two-sided t-test. (H) RT-qPCR for vitellogenin in the fat body of transitioning ants one day after injection of corazonin (CRZ) or scrambled control in the gaster. Bars represent the mean from ≥ 7 biological replicates (individual ants) + s.e.m. P-value is from a two-sided t-test. (I) Number of mature oocytes in transitioning ants 10 days after injections of corazonin peptide (CRZ) or scrambled control. Each circle represents a biological replicate (individual ant). Horizontal bars indicate the mean ± s.e.m. P-value is from a Mann-Whitney test. See also Figure S6.
Figure 7
Figure 7. Model for the Action of Corazonin
High corazonin levels stabilize worker identity by stimulating hunting behavior and inhibiting the transition to gamergate. At the molecular level this could be in part achieved by decreased levels of brain vitellogenin, which repress nursing and stimulate hunting, as well as decreased levels of fat body vitellogenin, which regulates fertility.

Comment in

References

    1. Amdam GV, Norberg K, Fondrk MK, Page RE., Jr Reproductive ground plan may mediate colony-level selection effects on individual foraging behavior in honey bees. Proc Natl Acad Sci U S A. 2004;101:11350–11355. - PMC - PubMed
    1. Arrese EL, Soulages JL. Insect fat body: energy, metabolism, and regulation. Annu Rev Entomol. 2010;55:207–225. - PMC - PubMed
    1. Bendesky A, Kwon YM, Lassance JM, Lewarch CL, Yao S, Peterson BK, He MX, Dulac C, Hoekstra HE. The genetic basis of parental care evolution in monogamous mice. Nature. 2017;544:434–439. - PMC - PubMed
    1. Bonasio R. Emerging topics in epigenetics: ants, brains, and noncoding RNAs. Ann N Y Acad Sci. 2012;1260:14–23. - PubMed
    1. Bonasio R, Li Q, Lian J, Mutti NS, Jin L, Zhao H, Zhang P, Wen P, Xiang H, Ding Y, et al. Genome-wide and caste-specific DNA methylomes of the ants Camponotus floridanus and Harpegnathos saltator. Curr Biol. 2012;22:1755–1764. - PMC - PubMed