. 2017 Aug 10;170(4):774-786.e19.
doi: 10.1016/j.cell.2017.07.043.

Transcription-Replication Conflict Orientation Modulates R-Loop Levels and Activates Distinct DNA Damage Responses

Affiliations

Transcription-Replication Conflict Orientation Modulates R-Loop Levels and Activates Distinct DNA Damage Responses

Stephan Hamperl et al. Cell. .

Abstract

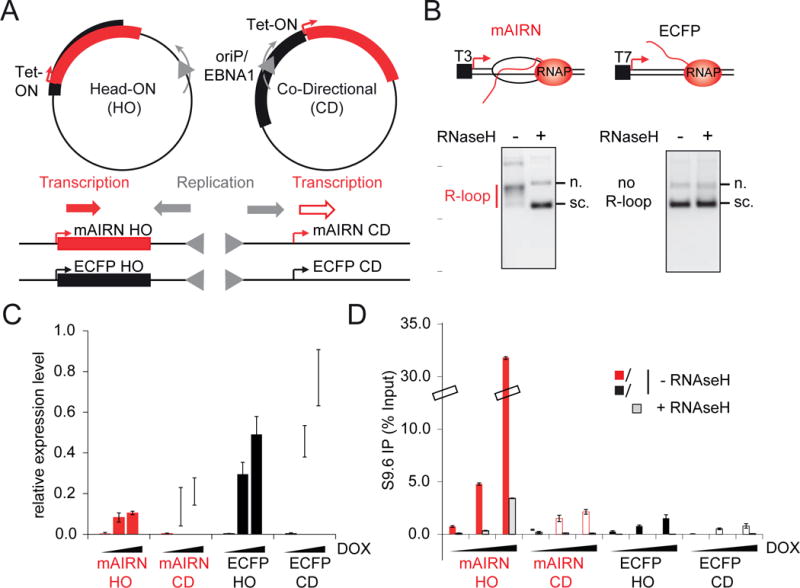
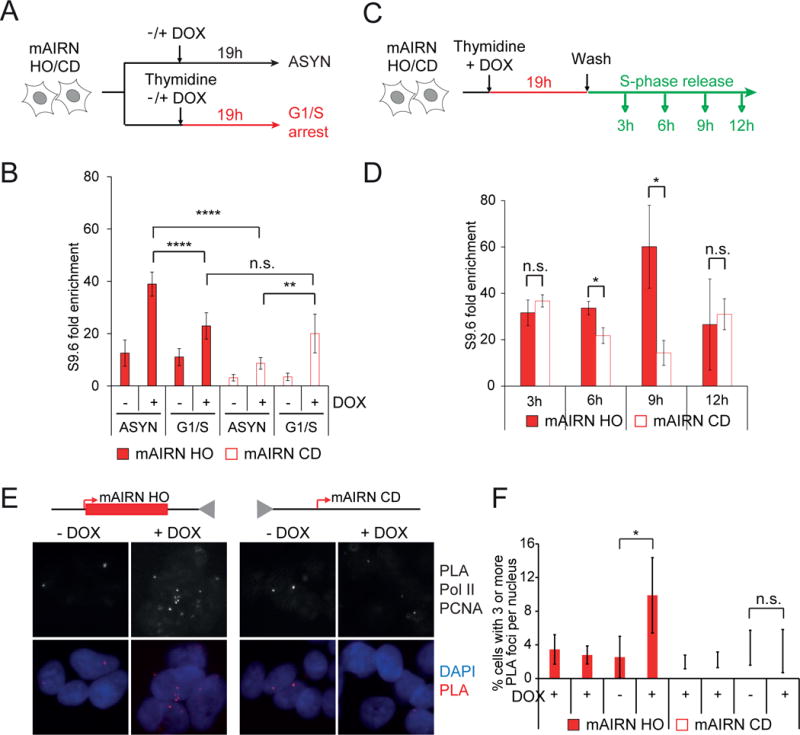
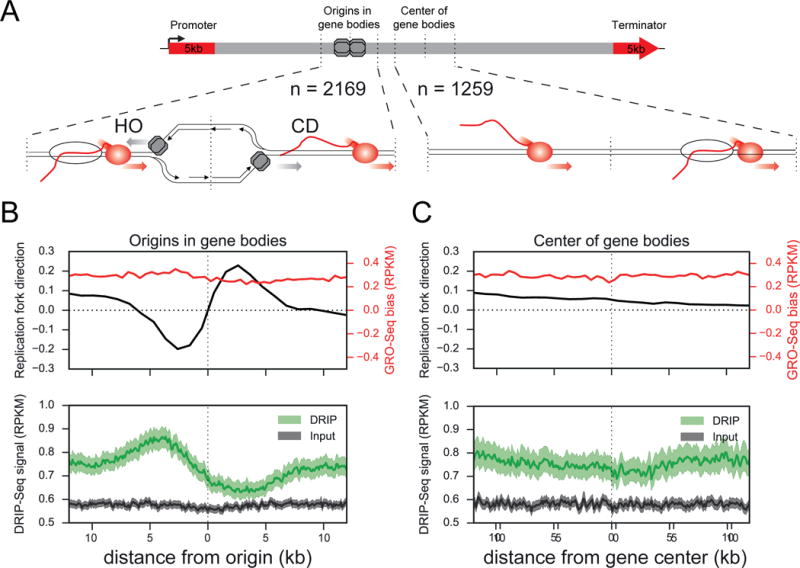
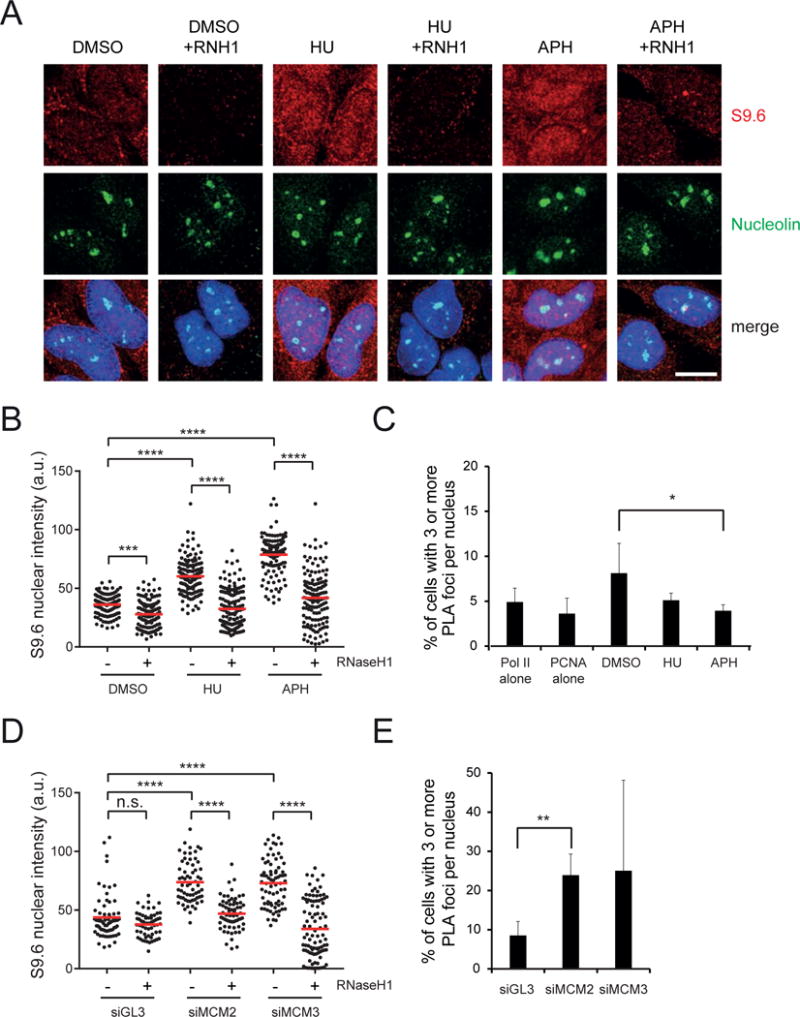
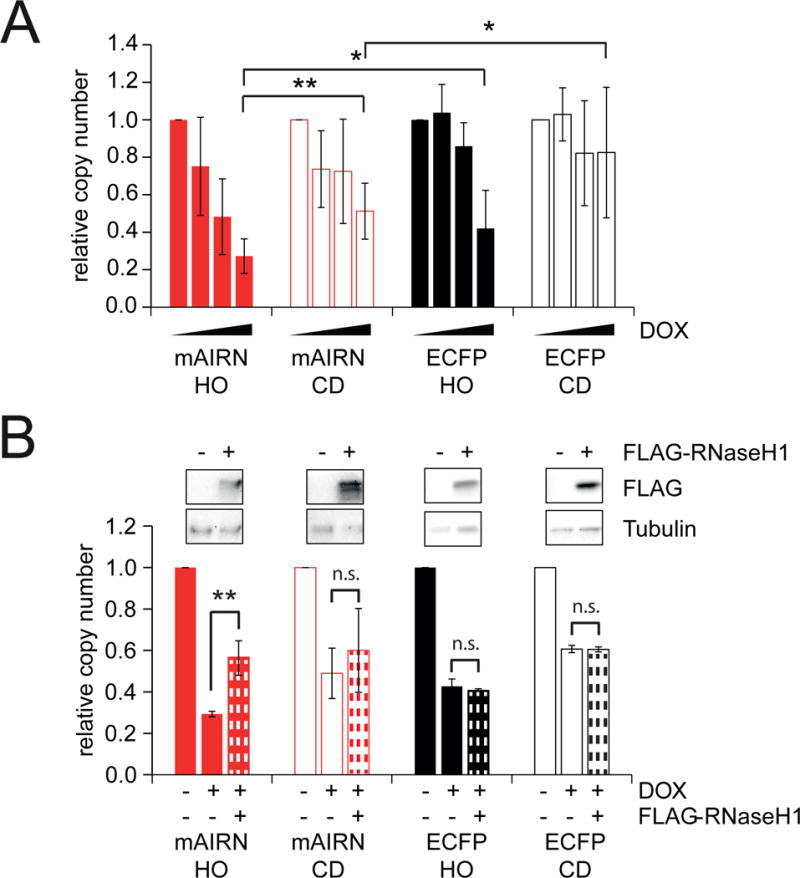
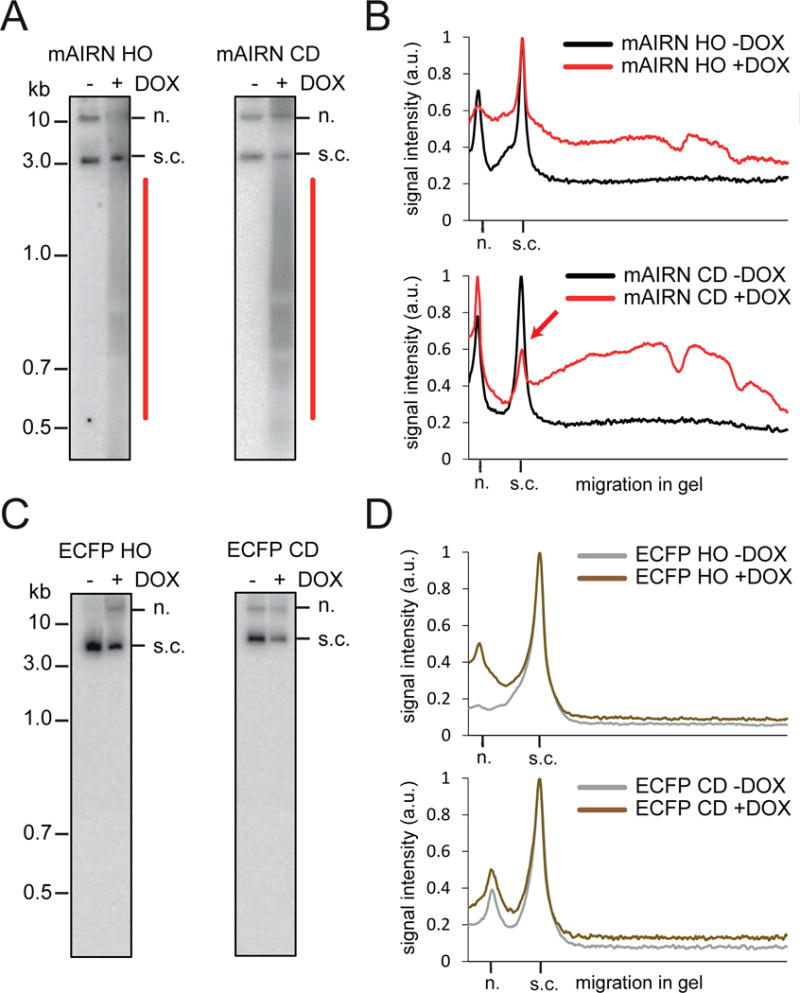
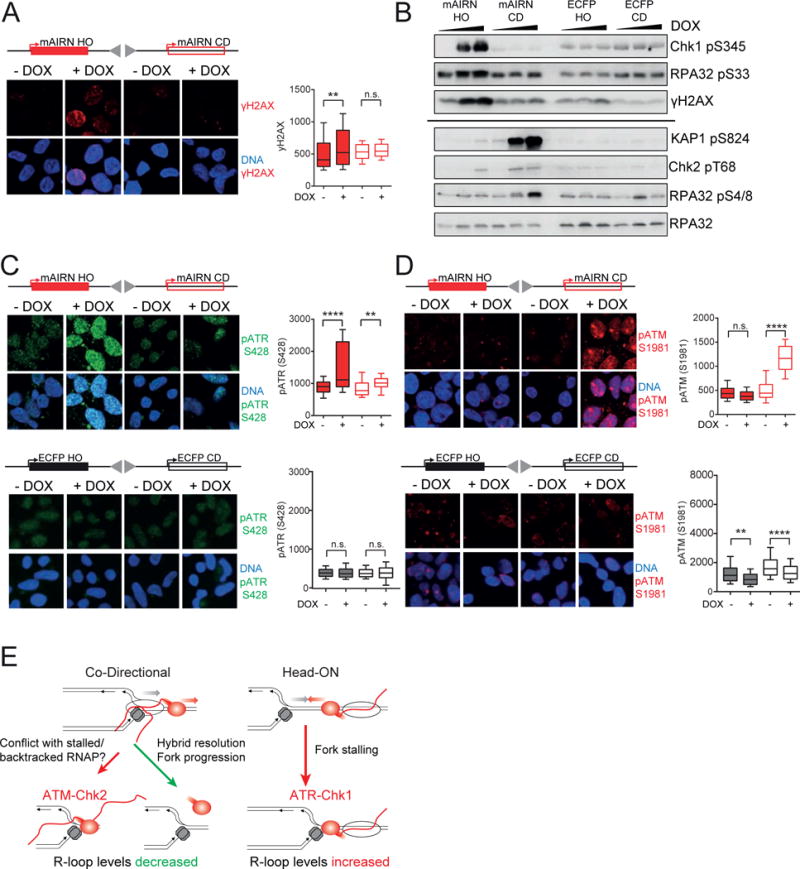
Conflicts between transcription and replication are a potent source of DNA damage. Co-transcriptional R-loops could aggravate such conflicts by creating an additional barrier to replication fork progression. Here, we use a defined episomal system to investigate how conflict orientation and R-loop formation influence genome stability in human cells. R-loops, but not normal transcription complexes, induce DNA breaks and orientation-specific DNA damage responses during conflicts with replication forks. Unexpectedly, the replisome acts as an orientation-dependent regulator of R-loop levels, reducing R-loops in the co-directional (CD) orientation but promoting their formation in the head-on (HO) orientation. Replication stress and deregulated origin firing increase the number of HO collisions leading to genome-destabilizing R-loops. Our findings connect DNA replication to R-loop homeostasis and suggest a mechanistic basis for genome instability resulting from deregulated DNA replication, observed in cancer and other disease states.

Keywords: DNA replication; DNA-damage response; R-loops; genome instability; replication stress; transcription-replication conflicts.


Figures

Figure 1
Figure 1. An episomal system to study transcription-replication conflicts
A) Schematic representation of the constructs. If not otherwise stated, clone #2 cells were used for analyses throughout this study (see Figure S1A–C). B) R-loop formation at the mAIRN sequence in vitro. Plasmids were transcribed in vitro, treated as indicated with RNase H and then visualized by native agarose gel electrophoresis; n. nicked, s.c. supercoiled. C) RT-qPCR analysis of mAIRN and ECFP HO/CD-induced transcription. RNA was extracted from clone #1 cells 72h after treatment with 0, 100 or 1000 ng/mL DOX. Gene expression was normalized relative to β-actin. The bars indicate mean and standard deviations between biological replicates (n=3). D) DRIP-qPCR analysis of mAIRN and ECFP HO and CD constructs. Cells were treated with 0, 100 or 1000 ng/mL DOX for 72h and harvested for DRIP. Statistics as in C (n=2).
Figure 2
Figure 2. The orientation of transcription and replication affects RNA-DNA hybrid levels
A) Schematic for the thymidine block experiment. B) DRIP-qPCR analysis of mAIRN HO and CD cells after G1/S arrest with 0 or 1000ng/ml DOX. As a control, asynchronously growing cells were harvested for DRIP (ASYN). The DRIP signals were normalized and shown as fold enrichment to the non R-loop forming ZNF544 locus. The bars indicate mean and standard deviations between biological replicates (n=7). **p<0.01, ****p<0.0001. Unpaired Student’s t-test. C) Schematic for the single-thymidine block and release experiment. D) DRIP-qPCR analysis of mAIRN HO and CD cells after G1/S arrest for 19h and release into S-phase for 3, 6, 9, and 12h with 1000 ng/mL DOX. DRIP signals were normalized and shown as in B). Statistics as in B (n=3). *p<0.05, n.s. not significant. E) Representative images and F) quantification of the percent of cells with ≥3 RNAP II-PCNA PLA foci per nucleus. RNAP II alone and PCNA alone are single-antibody controls from cells treated with 1000 ng/mL DOX for 24 hours. Statistics as in B) (n ≥ 3). n.s. not significant. *p<0.05. Scale bar: 10 μm.
Figure 3
Figure 3. R-loops are enriched at HO regions of the genome
A) Diagram of genic origins of replication or centered control regions from the same gene bodies. Windows around regions are 24kb in size and at least 5kb from promoters and terminators. B–C) Mean replication fork direction (black) and transcription (red) directionality bias across origins in gene bodies (B) or gene centers (C). IP (green) and input (grey) signal from DRIP-Seq shows R-loops accumulate on the HO side of origins in gene bodies compared to the CD side (p=1.1e-23, Wilcoxon singed-rank test). No corresponding pattern in DRIP-Seq signal is seen for these gene centers (p=0.27, Wilcoxon signed-rank test). Error bands represent a 95% confidence interval as determined by a bootstrap of the mean.
Figure 4
Figure 4. Perturbation of the replication program increases genomic levels of R-loops
A) Immunostaining and B) quantification of S9.6 nuclear signal in HeLa cells treated with 3mM HU or 2μM aphidicolin for 1h. The nucleus was co-stained with nucleolin antibody and treated with RNaseH1 as indicated. The mean value is shown as a red line. a.u. = arbitrary units. ***p<0.001. ****p<0.0001. One-way ANOVA test (n≥100). Scale bar: 15 μm. C) Percentage of cells with ≥ 3 RNA RNAP II - PCNA PLA foci under the same conditions as in A). RNAP II alone and PCNA alone are single-antibody controls from HeLa cells treated with DMSO for 1h. The bars indicate mean and standard deviations between biological replicates (n ≥ 3). *p<0.05. Unpaired Student’s t-test. D) Immunostaining and quantification of S9.6 nuclear signal in HeLa cells transfected with indicated siRNAs and fixed after 48h. The nucleus was co-stained with nucleolin antibody and treated with RNaseH1 as indicated. The mean value is shown as a red line. a.u. = arbitrary units. ****p<0.0001. n.s. not significant. One-way ANOVA test (n≥100). E) Percentage of cells with ≥ 3 RNAP II – PCNA PLA foci in HeLa cells under the same conditions as in D). The bars indicate mean and standard deviations between biological replicates (n ≥ 3). **p<0.01. Unpaired Student’s t-test.
Figure 5
Figure 5. R-loop formation exacerbates the effect of TRCs on plasmid instability
A) mAIRN/ECFP HO and CD cells were treated with 0, 50, 100, or 1000 ng/mL DOX for 72h. The relative plasmid copy number (normalized to 0 ng/mL DOX) was determined by quantitative PCR on genomic DNA. The bars indicate mean and standard deviations between biological replicates (n ≥ 3). *p<0.05. **p<0.01. Unpaired Student’s t-test. B) mAIRN and ECFP HO and CD cells were treated with 0 or 1000 ng/mL DOX. After 24h, cells were transfected with a vector expressing FLAG-tagged RNaseH1 or an empty vector control in the absence or presence of 1000 ng/mL DOX for further 48h. Plasmid copy number was determined as in A) (n=2–4). ** p< 0.01, n.s. not significant. Unpaired Student’s t-test.
Figure 6
Figure 6. HO and CD TRCs are differentially processed
A) Southern blot images and B) profile analyses of HIRT-extracted mAIRN HO/CD plasmid constructs after treatment with 0 or 1000ng/ml DOX for 24h. The mAIRN CD blot is shown at a shorter exposure compared to mAIRN HO to account for the different plasmid amounts present in both cell populations. Signal intensities were normalized to the band with the highest intensity and plotted against the migration in the gel. a.u. arbitrary units. n. nicked. s.c. supercoiled. C–D) Same as in A) and B) of HIRT-extracted ECFP HO/CD constructs.
Figure 7
Figure 7. HO and CD conflicts with R-loops induce DNA breaks and distinct DNA damage responses
A) Immunostaining for γH2AX in mAIRN HO and CD cells treated with 0 or 1000 ng/mL DOX for 24h. Box and whisker plots show the 10–90 percentile. a.u. = arbitrary units. n.s. not significant. **p<0.01. ****p<0.0001. One-way ANOVA test (n ≥ 100). mAIRN HO clone #2 cells with 10–20 plasmid copies and mAIRN CD clone #2 cells with 50–100 copies per cell were analyzed. Scale bar: 15 μm. B) mAIRN HO/CD or ECFP HO/CD cells were treated with 0, 100 or 1000 ng/mL DOX for 24h. Equal protein amounts from whole cell lysates were analyzed by immunoblotting with the indicated antibodies. Copy numbers for mAIRN HO and mAIRN CD cells were the same as in A). ECFP HO clone #2 and ECFP CD clone #2 cells had 10–20 and 100–150 copies per cell, respectively. The same samples were run on two independent gels as indicated by a black line. C) Immunostaining for ATR pS428 in mAIRN HO/CD and ECFP HO/CD cells treated with 0 or 1000 ng/mL DOX for 24h. Box and whisker plots show the 10–90 percentile. a.u. = arbitrary units. n.s. not significant. **p<0.01. ****p<0.0001. One-way ANOVA test (n ≥ 100). Copy numbers for mAIRN HO/CD and ECFP HO/CD cells were the same as in A) and B). Scale bar: 15 μm. D) Immunostaining for ATM pS1981 in mAIRN HO/CD and ECFP HO/CD cells treated with 0 or 1000 ng/mL DOX for 24h. Box and whisker plots show the 10–90 percentile. a.u. = arbitrary units. n.s. not significant. **p<0.01. ****p<0.0001. One-way ANOVA test (n ≥ 100). Copy numbers for mAIRN HO/CD and ECFP HO/CD cells were the same as in A) and B). Scale bar: 15 μm. E) Model for how head-on and co-directional transcription-replication conflicts regulate R-loop homeostasis and induce distinct DNA damage responses in human cells.

Comment in

Similar articles

Cited by

References

    1. Aguilera A, García-Muse T. R loops: from transcription byproducts to threats to genome stability. Mol Cell. 2012;46:115–124. - PubMed
    1. Alver RC, Chadha GS, Blow JJ. The contribution of dormant origins to genome stability: from cell biology to human genetics. DNA Repair (Amst) 2014;19:182–189. - PMC - PubMed
    1. Alzu A, Bermejo R, Begnis M, Lucca C, Piccini D, Carotenuto W, Saponaro M, Brambati A, Cocito A, Foiani M, et al. Senataxin associates with replication forks to protect fork integrity across RNA-polymerase-II-transcribed genes. Cell. 2012;151:835–846. - PMC - PubMed
    1. Anders S, Pyl PT, Huber W. HTSeq–a Python framework to work with high-throughput sequencing data. Bioinformatics. 2015;31:166–169. - PMC - PubMed
    1. Andersson R, Refsing Andersen P, Valen E, Core LJ, Bornholdt J, Boyd M, Heick Jensen T, Sandelin A. Nuclear stability and transcriptional directionality separate functionally distinct RNA species. Nat Commun. 2014;5:5336. - PubMed