. 2017 Aug 29;114(35):9261-9266.
doi: 10.1073/pnas.1703958114. Epub 2017 Aug 11.

Stochastic feeding dynamics arise from the need for information and energy

Affiliations

Stochastic feeding dynamics arise from the need for information and energy

Monika Scholz et al. Proc Natl Acad Sci U S A. .

Abstract

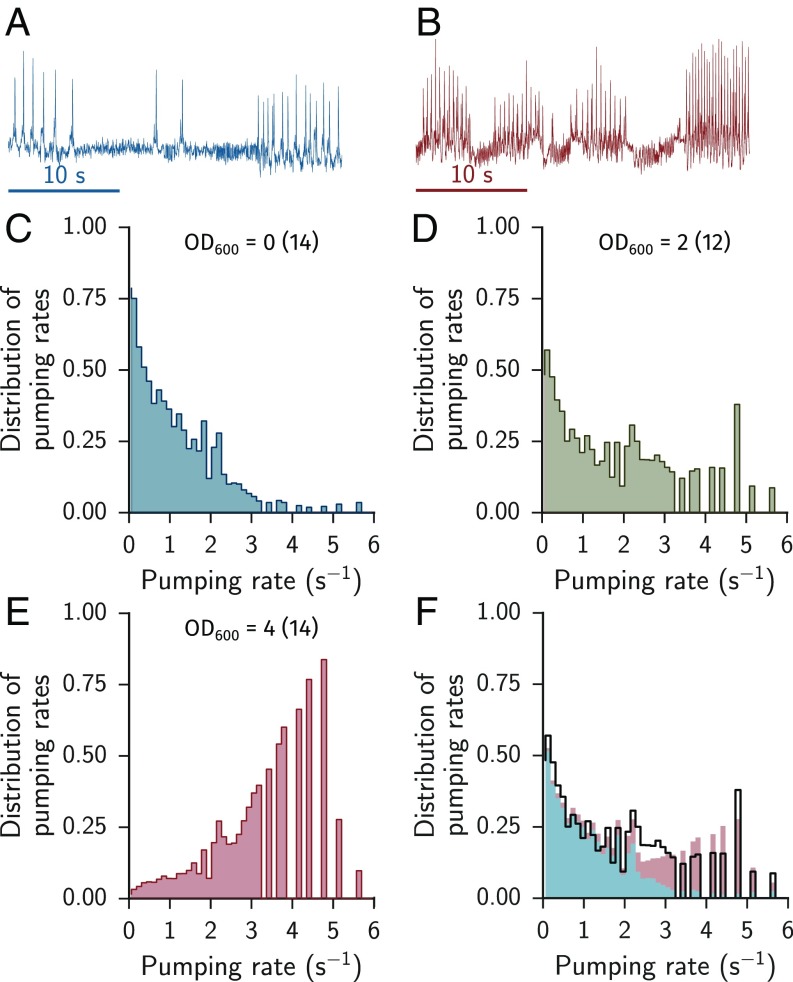
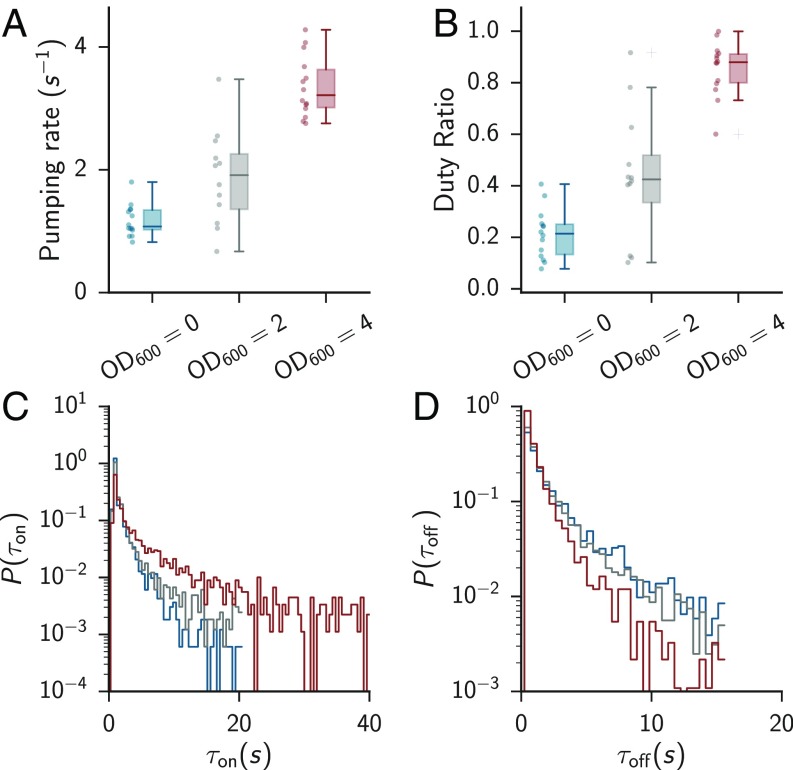
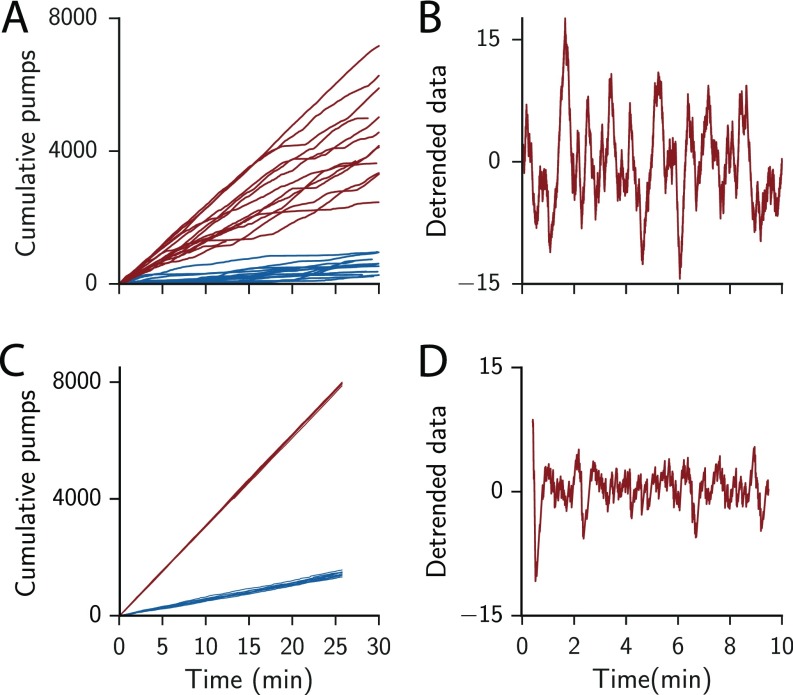
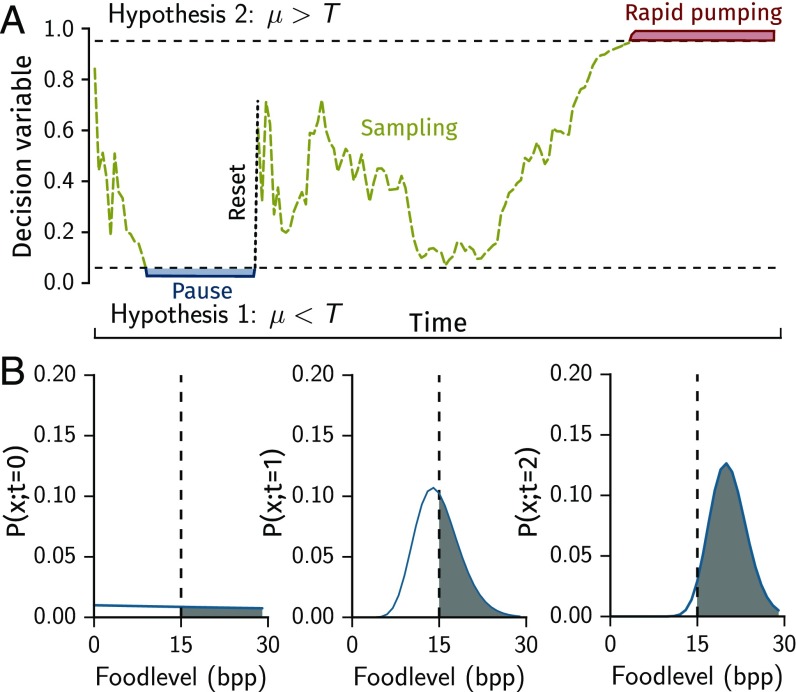
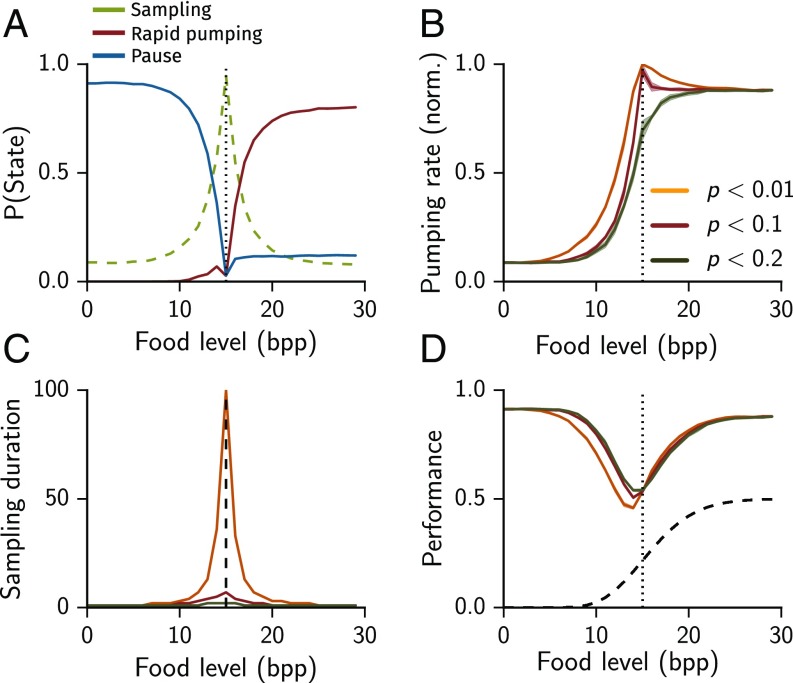
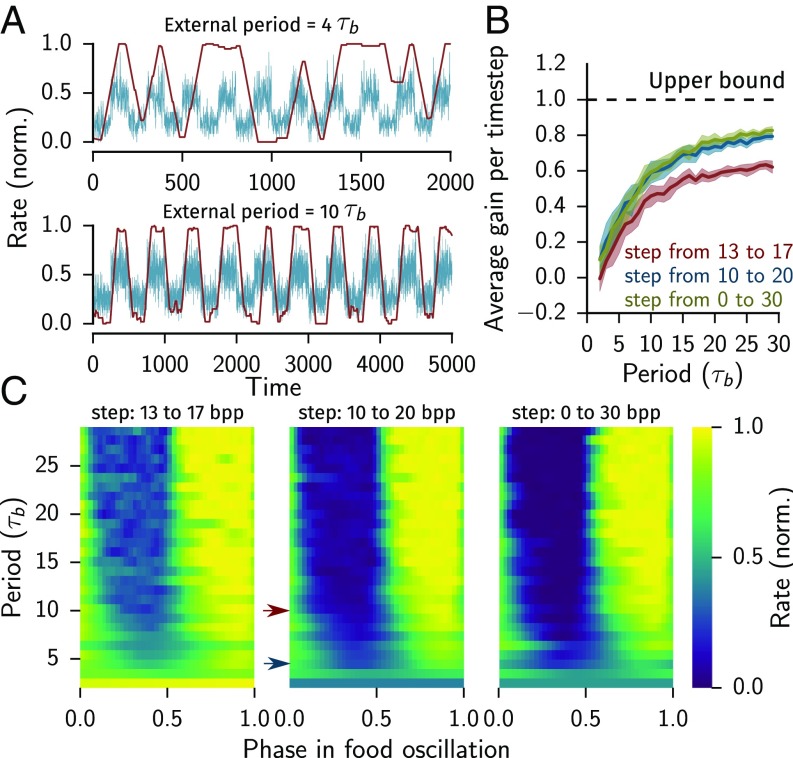
Animals regulate their food intake in response to the available level of food. Recent observations of feeding dynamics in small animals showed feeding patterns of bursts and pauses, but their function is unknown. Here, we present a data-driven decision-theoretical model of feeding in Caenorhabditis elegans Our central assumption is that food intake serves a dual purpose: to gather information about the external food level and to ingest food when the conditions are good. The model recapitulates experimentally observed feeding patterns. It naturally implements trade-offs between speed versus accuracy and exploration versus exploitation in responding to a dynamic environment. We find that the model predicts three distinct regimes in responding to a dynamical environment, with a transition region where animals respond stochastically to periodic signals. This stochastic response accounts for previously unexplained experimental data.

Keywords: decision theory; feeding behavior; sequential analysis.


Conflict of interest statement

The authors declare no conflict of interest.

Figures

Fig. 1.
Fig. 1.
C. elegans feeding can be approximated by a two-state system. (A and B) Raw feeding trajectories at low and high food (OD600 = 0 and 4, respectively). The sharp peaks indicate pumping events. (CE) Distribution of instantaneous pumping rates for low, medium, and high food concentrations (OD600 = 0, 2, and 4, respectively). (F) Weighted combination of the pumping rate distribution at low and high food (blue and red) compared with the medium food concentration (black). The weighting factor was found by χ2 minimization. The best fit is Y=αYLow+(1α)YHigh, with α=0.687±0.023 and χ2/dof=44.28/48. The rate distribution at intermediate food is shown in black. The panels are reproduced from data presented in ref. .
Fig. 2.
Fig. 2.
C. elegans feeding is a stochastic process. (A) Pumping rate as a function of food level. Error bars denote 5th and 95th percentiles. The boxes show the upper and lower quartiles. N=14, 12, and 14 for food levels of OD600 0, 2, and 4, respectively. (B) Duty ratio (fraction of rapid pumping) as a function of food level. The duty ratio was defined as the fraction of time during which consecutive pumps were 500 ms apart. Error bars show 5th and 95th percentiles. (C and D) Duration of bursts τon and pauses τoff for the three food levels. Bursts are defined as series of continuous pumps 500 ms apart. Colors are the same as in A and B. A and B are reproduced from data presented in ref. .
Fig. S1.
Fig. S1.
Variability of C. elegans feeding. (A) Cumulative number of pumping events over 30 min (OD600 = 0 and 4, blue and red, respectively). Individual lines are from individual animals. (B) Example of deviations from the local mean pumping rate as calculated by subtracting a local linear trend with a width of 1 min from the data shown in A. (C) Cumulative pumping events as obtained from simulations with standard parameters at 10 and 30 bpp mean food levels, blue and red, respectively. Each condition was simulated 10 times and is shown as individual lines. (D) Example of deviations from the local mean pumping rate, similar to B, but for simulated trajectories. Each time step in the stimulation represents 1/6 s.
Fig. 3.
Fig. 3.
A decision theory-based model for adaptive feeding. (A) Schematic evolution of the DV in time. (B) Evolution of the belief function P(x;t) with samples. Dashed line represents T=15 bpp. The gray area shows the value of the DV. The dashed line indicates the cost T. Graphs are from simulations at food level 20 bpp.
Fig. 4.
Fig. 4.
Decision model response to food concentration. (A) Fraction of time spent in sampling, committed, and pausing states for a stringency of p0.1. (B) Pumping rate as a function of food concentration. (C) Duration of the sampling state for stringency. (D) Performance (fraction of correct decisions) as a function of food concentration. For comparison the performance of a random model with a 50% chance of pumping at every time step (black dashed line).
Fig. 5.
Fig. 5.
Resetting improves adaptive feeding in a dynamic environment. (A) Pumping rate in response to a step increase in mean food level from 10 to 20 units, for a model with and without resetting (red and olive, respectively). The step happens at t=1,000 (dashed line and after shading). The shaded area shows the SD as calculated from 30 simulated trials. (B) Cumulative net food intake (gain) over the simulated time. The width of the curve indicates the SD as calculated from 30 simulated trials. A random model with a 50% chance of pumping performs worse (dashed black line). (C) Response of the full model to a step in food level from 10 to 20 units for stringency p=0.01, 0.1, and 0.2 (yellow, red, and olive, respectively). (D) Response of the nonresetting model to a step in food level from 10 to 20 units for stringency p=0.01, 0.1, and 0.2 (yellow, red, and olive, respectively). Each time step in the stimulation represents 1/6 s.
Fig. S2.
Fig. S2.
Resetting improves adaptive feeding in a dynamic environment. (A) Pumping rate in response to a step decrease in mean food level from 20 to 10 units for a model with and without resetting (red and olive, respectively). The step happens at t=1,000 (dashed line and after shading). The shaded area shows the SD as calculated from 30 simulated trials. (B) Cumulative net food intake (gain) over the simulated time. The width of the curve indicates the SD as calculated from 30 simulated trials. A random model with a 50% chance of pumping performs worse (dashed black line). (C) Response of the full model to a step in food level from 20 to 10 units for stringency p=0.01,0.1,and0.2 (yellow, red, and olive, respectively). (D) Response of the nonresetting model to a step in food level from 20 to 10 units for stringency p=0.01,0.1,and0.2 (yellow, red, and olive, respectively). Each time step in the stimulation represents 1/6 s.
Fig. 6.
Fig. 6.
Feeding in a dynamic environment depends on the timescale of change. (A) Pumping response to periodic low-to-high food steps with a fast and slow period compared with the committed and pause lengths (τb=τp=50) and instantaneous food level xt (red and blue, respectively). (B) Fraction of food gained per bite (normalized to the theoretical maximum). (C) Periodogram showing the average pumping rate in response to periodic steps from 13 to 17, 10 to 20, and 0 to 30 (T=15). The location of the trajectories shown in A is indicated as blue and red arrows (top and bottom of A, respectively). The committed and pause durations for all panels are τb=τp=50.

References

    1. Hill JO, Peters JC. Environmental contributions to the obesity epidemic. Science. 1998;280:1371–1374. - PubMed
    1. Woods SC, Schwartz MW, Baskin DG, Seeley RJ. Food intake and the regulation of body weight. Annu Rev Psychol. 2000;51:255–277. - PubMed
    1. Lee KS, et al. Serotonin-dependent kinetics of feeding bursts underlie a graded response to food availability in C. elegans. Nat Commun. 2017;8:14221. - PMC - PubMed
    1. Scholz M, Lynch DJ, Lee KS, Levine E, Biron D. A scalable method for automatically measuring pharyngeal pumping in C. elegans. J Neurosci Methods. 2016;274:172–178. - PubMed
    1. Itskov PM, et al. Automated monitoring and quantitative analysis of feeding behaviour in Drosophila. Nat Commun. 2014;5:4560. - PMC - PubMed

Publication types

LinkOut - more resources