. 2017 Sep;19(5):682-696.
doi: 10.1016/j.jmoldx.2017.05.006. Epub 2017 Aug 9.

Validation of a Targeted RNA Sequencing Assay for Kinase Fusion Detection in Solid Tumors

Affiliations

Validation of a Targeted RNA Sequencing Assay for Kinase Fusion Detection in Solid Tumors

Julie W Reeser et al. J Mol Diagn. 2017 Sep.

Abstract

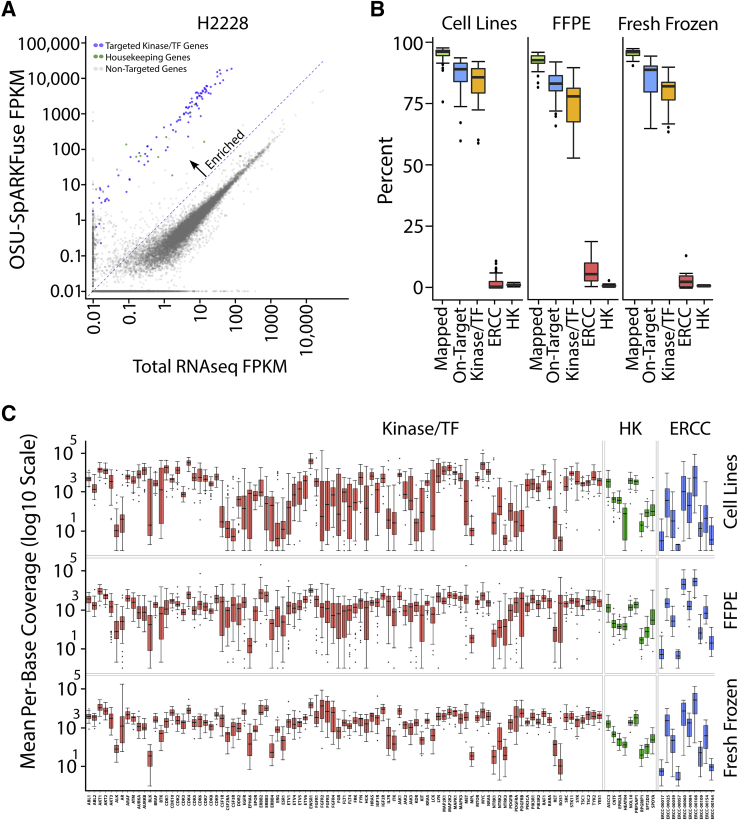
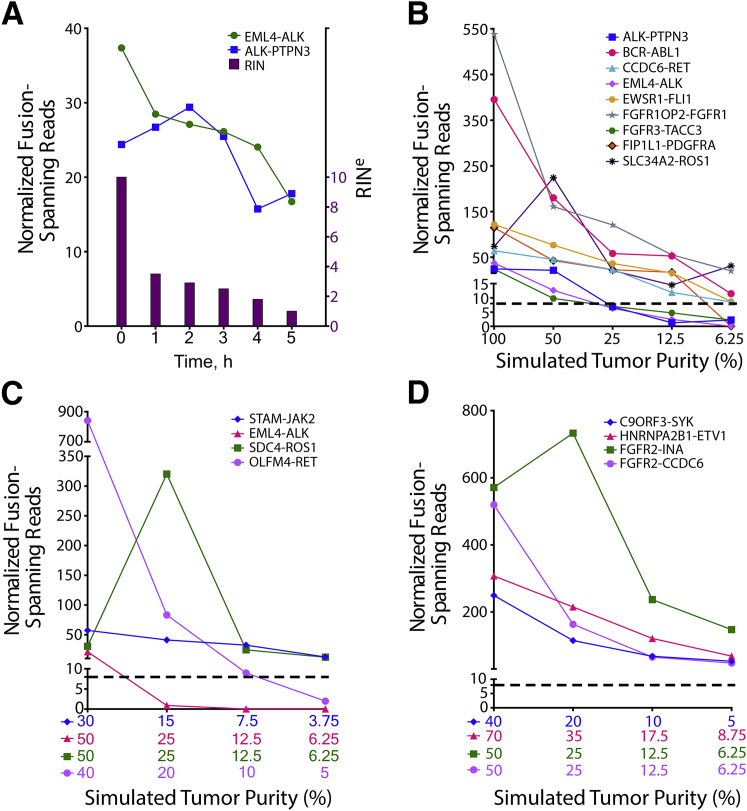
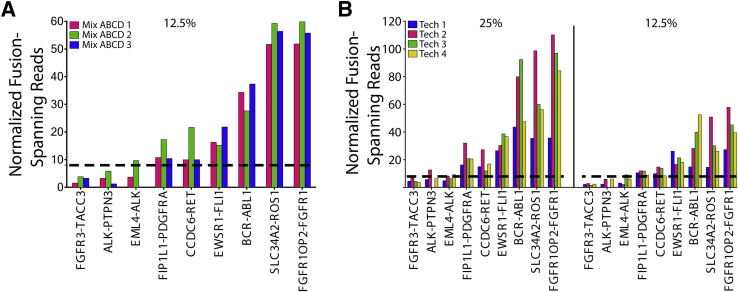
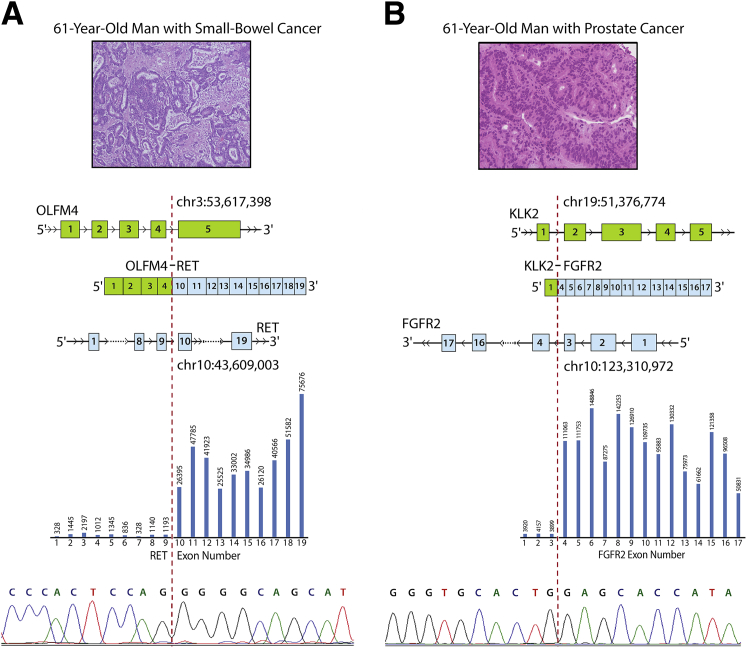
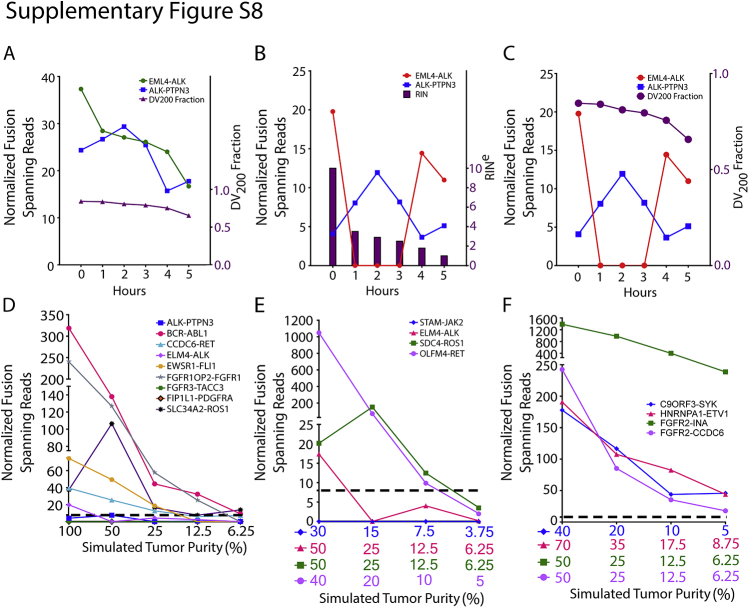
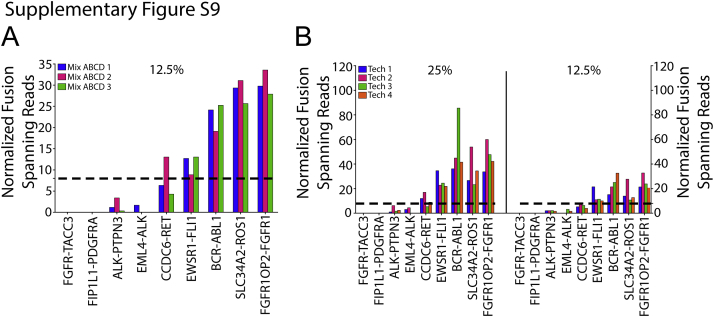
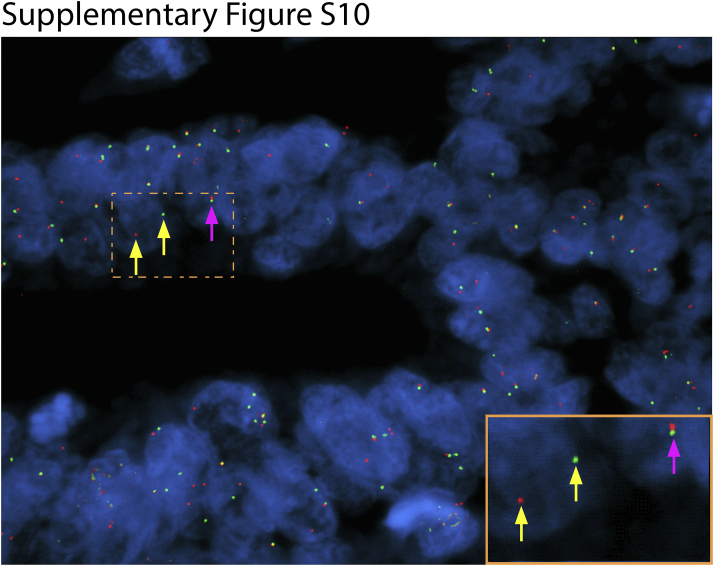
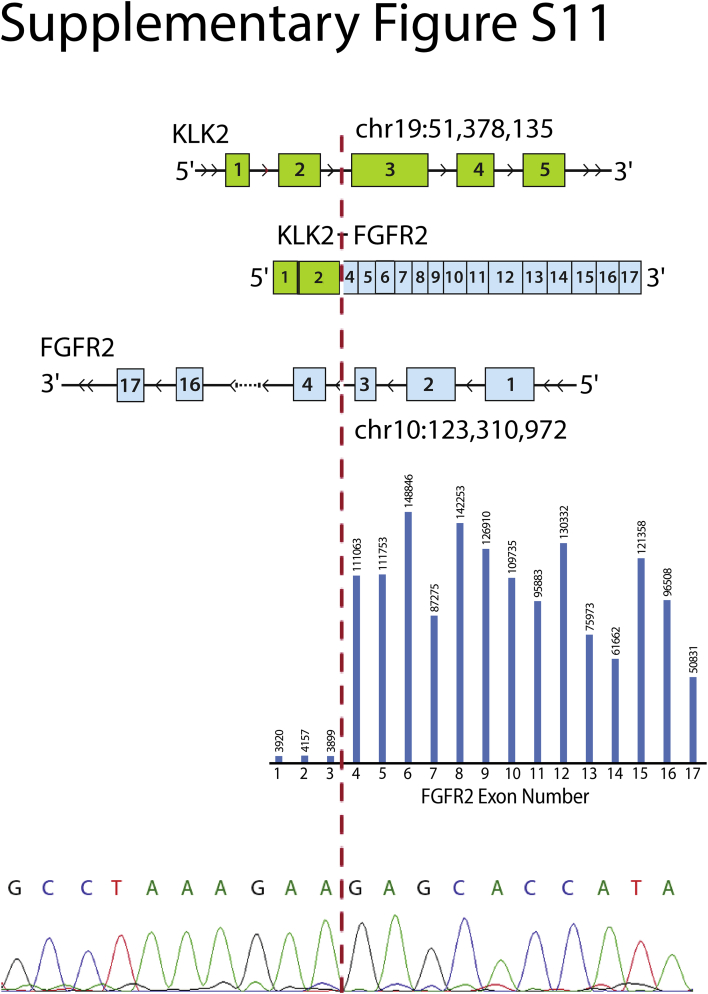
Kinase gene fusions are important drivers of oncogenic transformation and can be inhibited with targeted therapies. Clinical grade diagnostics using RNA sequencing to detect gene rearrangements in solid tumors are limited, and the few that are available require prior knowledge of fusion break points. To address this, we have analytically validated a targeted RNA sequencing assay (OSU-SpARKFuse) for fusion detection that interrogates complete transcripts from 93 kinase and transcription factor genes. From a total of 74 positive and 36 negative control samples, OSU-SpARKFuse had 93.3% sensitivity and 100% specificity for fusion detection. Assessment of repeatability and reproducibility revealed 96.3% and 94.4% concordance between intrarun and interrun technical replicates, respectively. Application of this assay on prospective patient samples uncovered OLFM4 as a novel RET fusion partner in a small-bowel cancer and led to the discovery of a KLK2-FGFR2 fusion in a patient with prostate cancer who subsequently underwent treatment with a pan-fibroblast growth factor receptor inhibitor. Beyond fusion detection, OSU-SpARKFuse has built-in capabilities for discovery research, including gene expression analysis, detection of single-nucleotide variants, and identification of alternative splicing events.


Figures

Figure 1
Figure 1
OSU-SpARKFuse workflow. After tumor content estimation, RNA is extracted from routine clinical specimens. A total of 250 ng of RNA is used for library construction, including rRNA depletion, cDNA synthesis, and ligation of unique indexed adapters. cDNA libraries are hybridized and captured with 3522 custom probes and sequenced on the Illumina MiSeq. FASTQ files are processed with a customized in-house pipeline to generate alignment metrics and accurately call gene fusions. High-confidence fusion calls are reported. DV200, percentage of RNA fragments >200 nucleotides; ERCC, External RNA Controls Consortium; QC, quality control; RINe, RNA integrity number equivalent.
Figure 2
Figure 2
Target enrichment and performance of OSU-SpARKFuse on 110 validation samples. A: Comparison of gene expression [measured as fragments per kilobase of transcript per million mapped reads (FPKM)] in total RNA sequencing (RNAseq) data versus OSU-SpARKFuse data in the H2228 cell line. B: Percentage of reads aligning to the HG19 transcriptome (mapped), OSU-SpARKFuse target regions (on-target), targeted kinase/transcription factor (TF) genes, External RNA Controls Consortium (ERCC) transcripts, and housekeeping (HK) genes in cell lines (51 samples), formalin-fixed, paraffin-embedded (FFPE) tissues (43 samples), and fresh-frozen tissues (16 samples). C: Distribution of mean per-base coverage for 93 kinase/TF genes, nine housekeeping genes, and 10 ERCC transcripts in cell lines, FFPE tissues, and fresh-frozen tissues. Outliers are plotted as individual dots. Kinase/TF genes, housekeeping genes, and ERCC vtranscripts on the y axis are listed in Supplemental Table S1. n = 51 cell line samples (C); n = 43 FFPE tissue samples (C); n = 16 fresh-frozen tissue samples (C).
Figure 3
Figure 3
Fusion detection in degraded and diluted fusion-positive samples. A: RNA from H2228 was incubated at 90°C for 0 to 5 hours, and RNA integrity number equivalent (RINe) was determined (purple bars). Normalized fusion-spanning reads derived from TopHat-Fusion are plotted at each time point for EML4-ALK and ALK-PTPN3 fusions. RNA from eight fusion-positive cell lines (B), four fusion-positive FFPE tissues (C), and four fusion-positive fresh frozen tissues (D) was serially diluted to simulate the indicated tumor purities. Dashed lines indicate threshold for high-confidence fusion calls.
Figure 4
Figure 4
Intrarun repeatability and interrun reproducibility of OSU-SpARKFuse. A: RNA isolated from 12.5% cell line dilutions was prepared and sequenced in the same run by the same technician for a total of three replicates. Normalized fusion-spanning reads derived from TopHat-Fusion are plotted. B: RNA isolated from 25% and 12.5% cell line mixes was prepared by four different technicians and sequenced on two different MiSeq instruments. Normalized fusion-spanning reads derived from TopHat-Fusion are plotted. Dashed lines indicate threshold for high confidence fusion calls.
Figure 5
Figure 5
Detection of novel clinically actionable fusions. A: A novel fusion that involves exons 1 to 4 of OLFM4 and exons 10 to 19 of RET was detected in a formalin-fixed, paraffin-embedded sample from a 61-year-old man with small-bowel cancer. B: A novel fusion that involves exon 1 of KLK2 and 4 to 17 of FGFR2 was detected in a fresh frozen biopsy sample from a 61-year-old man with prostate cancer. Top: Representative hematoxylin and eosin images from a Whipple resection (A) and a liver biopsy (B). Middle: Schematic of fusion gene with indicated exonic break points. Bar graph represents average exon level read depth for indicated RET exons (https://www.ncbi.nlm.nih.gov/refseq; accession number NM_020630) (A) and FGFR2 exons (https://www.ncbi.nlm.nih.gov/refseq; accession number NM_001144913.1) (B). Bottom: chromatogram trace of OLFM4-RET (A) and KLK2-FGFR2 (B) fusion transcripts. Dashed lines indicate break point.
Figure 6
Figure 6
Potential clinical applications of OSU-SpARKFuse. A: Venn diagram representing concordance of variant calls from OSU-SpARKFuse and high-confidence variant calls from National Institute of Standards and Technology (NIST) for the GM12878 cell line. B: Genome Browser screen shot depicting C to G bp substitution, resulting in a C481S mutation in a patient with chronic lymphocytic leukemia resistant to treatment with ibrutinib. C: Mean exon-level read depth for indicated MET exons (https://www.ncbi.nlm.nih.gov/refseq; accession number NM_001127500). Red text indicates skipped exon. Asterisk represents untranslated region not covered by OSU-SpARKFuse probes.
Supplemental Figure S1
The OSU-SpARKFuse assay schematic. External RNA Controls Consortium (ERCC) control RNA is added to total RNA isolated from clinical specimens. After rRNA depletion, samples undergo chemical fragmentation, cDNA synthesis, A-tailing, adapter ligation, and PCR amplification. Pooled cDNA libraries are hybridized to biotinylated custom probes in the presence of blocking oligos and captured using streptavidin-coated magnetic beads. Final libraries undergo a second round of PCR amplification and subsequent sequencing.
Supplemental Figure S2
The OSU-SpARKFuse pipeline schematic. RNA sequencing (RNAseq) data are analyzed using variant calling, expression analysis, and fusion calling modules. Raw FASTQ files generated by the sequencing instrument (MiSeq) are processed through each module with the specified alignment tool. For variant calling, FASTQ files are aligned using STAR, and Genome Analysis Toolkit's HaplotypeCaller is used to nominate single-nucleotide variants and indels. The output is filtered for in-target regions and annotated using ANNOVAR, Catalogue of Somatic Mutations in Cancer (COSMIC), Cancer Data Log (CanDL), and Single Nucleotide Polymorphism database (dbSNP). For expression analysis, FASTQ files are aligned using TopHat2, and Cufflinks is used to calculate gene and isoform level expression (as fragments per kilobase per million mapped reads). For fusion calling, tool-specific versions of Bowtie are used for alignment, and then fusion calling algorithms are applied. NFSRs are determined, and the output is filtered for in-target fusions. Quality control metrics are determined, known fusions present in our internal database are flagged, and protein domains are annotated using Oncofuse.
Supplemental Figure S3
OSU-SpARKFuse target enrichment. A–C: Comparison of gene expression [measured as fragments per kilobase per million mapped reads (FPKM)] in total RNA sequencing (RNAseq) data versus OSU-SpARKFuse data in HCC78 (A), TC71 (B), and KG1a (C) cell lines. D: Percentage of sequencing reads mapped to OSU-SpARKFuse target regions from total RNAseq and OSU-SpARKFuse data.
Supplemental Figure S4
RNA quality in analytical validation cohort. Distribution of percentage of RNA fragments >200 nucleotides (DV200) (A) and RNA integrity number equivalent (RINe) (B) values for RNA derived from cell lines (51 samples), formalin-fixed, paraffin-embedded (FFPE) tissues (43 samples), and fresh-frozen tissues (16 samples). Line indicates mean for all 110 samples.
Supplemental Figure S5
rRNA depletion in analytical validation cohort. Percentage of rRNA reads detected in cell lines (51 samples), formalin-fixed, paraffin-embedded (FFPE) tissues (43 samples), and fresh-frozen tissues (16 samples). Outliers are plotted as individual dots.
Supplemental Figure S6
Threshold determination for high-confidence fusion calls. Normalized fusion spanning read counts were determined for 75 fusion events from 74 positive control samples (true positives), for additional unexpected fusion events from these samples (false positives), and for fusion events present in 36 negative control samples (true negatives). Dashed line indicates threshold for high-confidence fusion calls.
Supplemental Figure S7
Fusion detection in low-input samples. RNA (50 and 100 ng) from the H2228 cell line was used as input for OSU-SpARKFuse. Normalized fusion spanning reads derived from TopHat-Fusion (A) and ChimeraScan (B) are plotted for ALK-PTPN3 and EML4-ALK. Dashed lines indicate threshold for high-confidence fusion calls.
Supplemental Figure S8
Fusion detection in degraded and diluted fusion-positive samples. RNA from H2228 was incubated at 90°C for 0 to 5 hours, and percentage of RNA fragments >200 nucleotides (DV200) (A and C) and RNA integrity number equivalent (RINe) (B) values were determined (purple lines and bars). Normalized fusion-spanning reads derived from TopHat-Fusion (A) and ChimeraScan (B and C) are plotted at each time point for EML4-ALK and ALK-PTPN3 fusions. RNA from eight fusion-positive cell lines (D), four fusion-positive formalin-fixed, paraffin-embedded tissues (E), and four fusion-positive fresh-frozen tissues (F) was serially diluted to simulate the indicated tumor purities. Normalized fusion-spanning reads derived from ChimeraScan are plotted. Dashed lines indicate threshold for high-confidence fusion calls.
Supplemental Figure S9
Intrarun repeatability and interrun reproducibility of OSU-SpARKFuse. A: RNA isolated from 12.5% cell line dilutions was prepared and sequenced in the same run by the same technician for a total of three replicates. Normalized fusion-spanning reads derived from ChimeraScan are plotted. Dotted line indicates threshold for high-confidence fusion calls. B: RNA isolated from 25% and 12.5% cell line mixes was prepared by four different technicians and sequenced on two different MiSeq instruments. Normalized fusion-spanning reads derived from ChimeraScan are plotted. Dashed lines indicates threshold for high-confidence fusion calls.
Supplemental Figure S10
Florescence in situ hybridization (FISH) to detect novel RET fusion. Representative image of RET break-apart FISH on formalin-fixed, paraffin-embedded small-bowel cancer specimen. Inset shows the boxed area at higher magnification. Red, RET 3′ signal; green, RET 5′ signal; blue, DAPI. Yellow arrows represent break-apart RET signal. Pink arrows represent intact RET signal. Original magnification, ×100 (main image).
Supplemental Figure S11
Detection of novel clinically actionable fusion. A second novel fusion break point was identified that involved exons 1 to 2 of KLK2 and 4 to 17 of FGFR2 in a fresh-frozen biopsy sample from a 61-year-old man with prostate cancer. Top: Schematic of fusion gene with indicated exonic break points. Middle: Bar graph represents average exon level read depth for indicated FGFR2 exons (https://www.ncbi.nlm.nih.gov/refseq; accession number NM_001144913.1). Bottom: Chromatogram trace of KLK2-FGFR2 fusion transcript. Dashed line indicates break point.

References

    1. Nowell P.C., Hungerford D.A. Chromosome studies on normal and leukemic human leukocytes. J Natl Cancer Inst. 1960;25:85–109. - PubMed
    1. Nowell P.C., Hungerford D.A. Chromosome studies in human leukemia, II: chronic granulocytic leukemia. J Natl Cancer Inst. 1961;27:1013–1035. - PubMed
    1. Kumar-Sinha C., Kalyana-Sundaram S., Chinnaiyan A.M. Landscape of gene fusions in epithelial cancers: seq and ye shall find. Genome Med. 2015;7:129. - PMC - PubMed
    1. Mertens F., Johansson B., Fioretos T., Mitelman F. The emerging complexity of gene fusions in cancer. Nat Rev Cancer. 2015;15:371–381. - PubMed
    1. Maher C.A., Kumar-Sinha C., Cao X., Kalyana-Sundaram S., Han B., Jing X., Sam L., Barrette T., Palanisamy N., Chinnaiyan A.M. Transcriptome sequencing to detect gene fusions in cancer. Nature. 2009;458:97–101. - PMC - PubMed

Publication types

MeSH terms