. 2017 Sep 7;170(6):1120-1133.e17.
doi: 10.1016/j.cell.2017.07.024. Epub 2017 Aug 10.

Distinct Cellular Mechanisms Underlie Anti-CTLA-4 and Anti-PD-1 Checkpoint Blockade

Affiliations

Distinct Cellular Mechanisms Underlie Anti-CTLA-4 and Anti-PD-1 Checkpoint Blockade

Spencer C Wei et al. Cell. .

Abstract

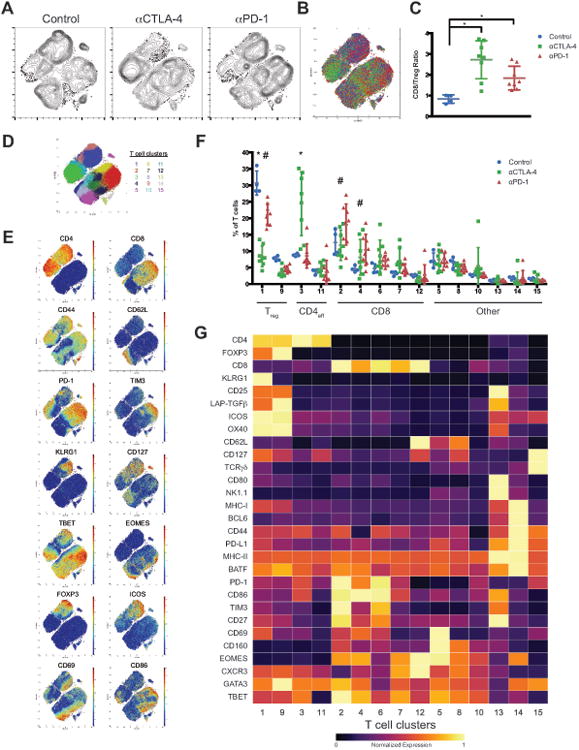
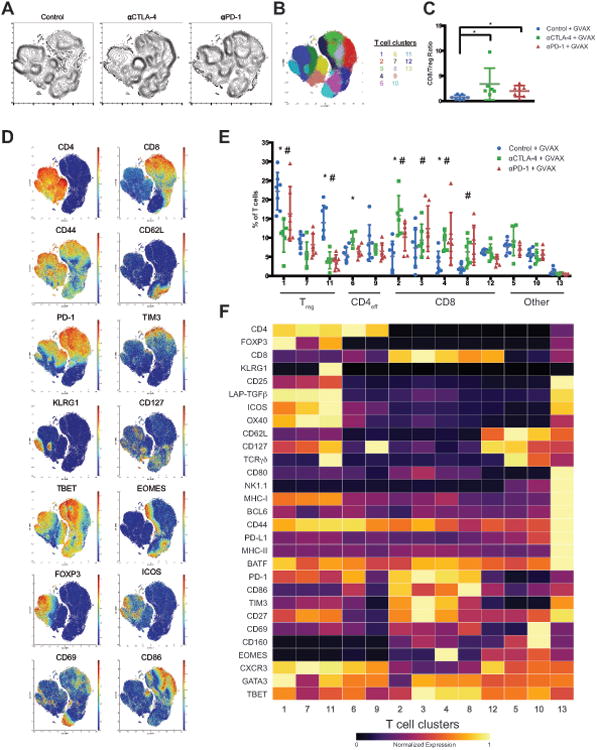
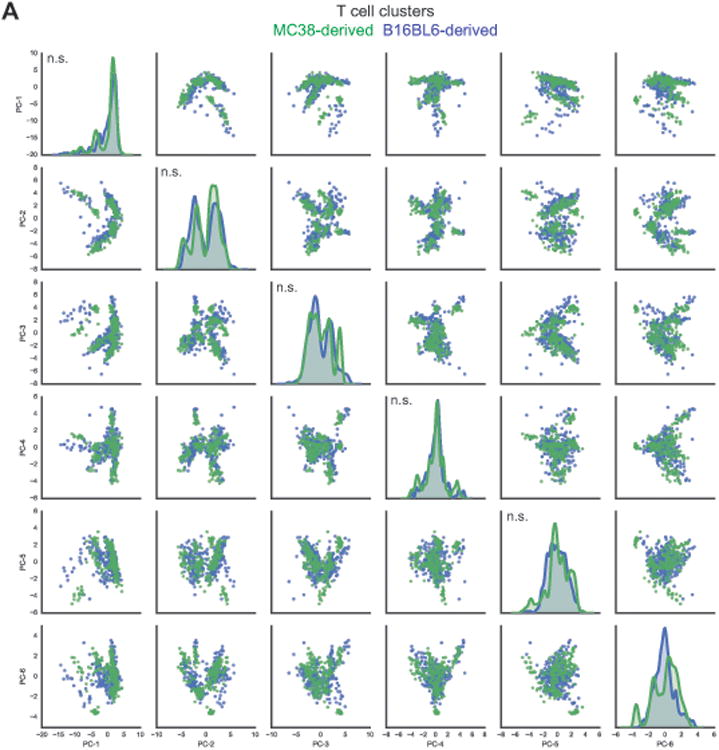
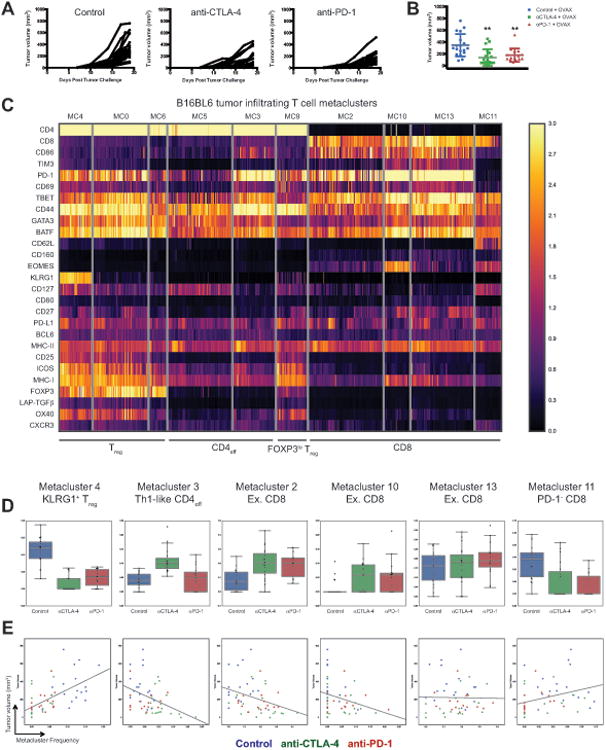
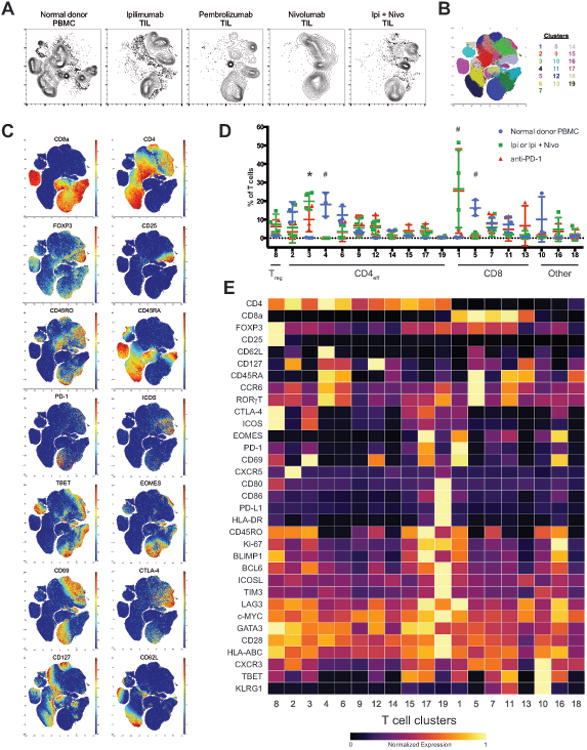
Immune-checkpoint blockade is able to achieve durable responses in a subset of patients; however, we lack a satisfying comprehension of the underlying mechanisms of anti-CTLA-4- and anti-PD-1-induced tumor rejection. To address these issues, we utilized mass cytometry to comprehensively profile the effects of checkpoint blockade on tumor immune infiltrates in human melanoma and murine tumor models. These analyses reveal a spectrum of tumor-infiltrating T cell populations that are highly similar between tumor models and indicate that checkpoint blockade targets only specific subsets of tumor-infiltrating T cell populations. Anti-PD-1 predominantly induces the expansion of specific tumor-infiltrating exhausted-like CD8 T cell subsets. In contrast, anti-CTLA-4 induces the expansion of an ICOS+ Th1-like CD4 effector population in addition to engaging specific subsets of exhausted-like CD8 T cells. Thus, our findings indicate that anti-CTLA-4 and anti-PD-1 checkpoint-blockade-induced immune responses are driven by distinct cellular mechanisms.

Keywords: CTLA-4; PD-1; T cell; checkpoint blockade; costimulation; host immune response; mass cytometry; melanoma; tumor; tumor-infiltrating lymphocyte.


Figures

Figure 1
Figure 1. Identification of checkpoint blockade responsive MC38 tumor infiltrating T cell populations
(A) Density t-SNE plots of an equal number of CD3ε+ MC38 tumor infiltrating T cells from each treatment group. (B) Overlaid t-SNE plot displaying equal number of events from each treatment group (control, blue; anti-CTLA-4, green; anti-PD-1, red). (C) Plot of CD8/Treg ratios displayed on a per mouse basis with mean ± SD (*, P<0.05, unpaired T-test). (D) t-SNE plot of MC38 infiltrating T cells overlaid with color-coded clusters. (E) t-SNE plot of infiltrating T cells overlaid with the expression of selected markers. (F) Frequency of T cell clusters displayed on a per mouse basis with mean ± SD (*, control v.s. anti- CTLA-4; #, control v.s. anti-PD-1; p<0.05, Dunnett's multiple comparison). T cell compartments are denoted including CD8, Treg, and CD4 effector (CD4eff). (G) Heat map displaying normalized marker expression of each T cell cluster. Representative data from three independent experiments is shown. See also Figure S1 and STAR Methods.
Figure 2
Figure 2. Identification of checkpoint blockade responsive B16BL6 tumor infiltrating T cellpopulations
(A) Density t-SNE plots of an equal number of CD3ε+ B16BL6 tumor infiltrating T cells from eachtreatment group. (B) t-SNE plot of infiltrating T cells overlaid with color-coded clusters. (C) Plot of CD8/Treg ratios displayed on a per mouse basis with mean ± SD (*, P<0.05, unpaired T-test). (D) t-SNE plot of tumor infiltrating T cells overlaid with the expression of selected markers. (E) Frequency of T cell clusters displayed on a per mouse basis with mean ± SD (*, control v.s. anti- CTLA-4; #, control v.s. anti-PD-1; p<0.05, Dunnett's multiple comparison). (F) Heat map displaying normalized marker expression of each T cell cluster. Representative data from three independent experiments is shown. See also Figure S2.
Figure 3
Figure 3. B16BL6 and MC38 tumor infiltrating T cell populations are quantitatively similar
(A) PCA was applied to T cell clusters identified on a per mouse basis from MC38 and B16BL6 mass cytometry datasets. Projections of MC38 and B16BL6 infiltrating T cell clusters on to the first 6 principal components (PC), which together account for 78% of the phenotypic variance, are displayed in a pair wise fashion (MC38, green; B16BL6, blue). Univariate distributions of T cell clusters along each of the first 6 principal components are displayed along the diagonal. The Kolmogorov-Smirnov test was applied to test whether distributions of MC38 and B16BL6 derived T cell clusters along each PC are different (n.s., not significant). See also Table S1.
Figure 4
Figure 4. Identification of B16BL6 tumor infiltrating T cell populations that correlate with tumor growth
(A) B16BL6 tumor growth curves in each treatment group. (B) Final tumor volume in each treatment group displayed on a per mouse basis with mean ± SD (**, control v.s. treatment, p<0.01, unpaired T-test). (C) Metaclustering analysis of B16BL6 tumor infiltrating T cell clusters. Two-way hierarchical clustering of T cell metaclusters and individual parameters displayed as a heat map. Only CD4 and CD8 T cell metaclusters are displayed. (D) The frequencies of T cell metaclusters in individual mice plotted as a fraction of total tumor infiltrating T cells and displayed as a box plot. (E) The frequencies of T cell metaclusters in individual mice plotted as a function of B16BL6 tumor volume with linear regression best-fit lines displayed. See also Figure S3 and Table S2.
Figure 5
Figure 5. Identification of checkpoint blockade responsive tumor infiltrating T cell populationsin human melanoma
(A) Density t-SNE plots of CD3+ tumor infiltrating T cells from melanoma patients being treated withindicated ICB therapies and T cells from normal donor peripheral blood. (B) t-SNE plot of total T cells from all samples overlaid with color-coded clusters. (C) t-SNE plots of total T cells from all samples overlaid with the expression of selected markers. (D) Frequency of T cell clusters displayed on a per sample basis with mean ± SD (*, ipi/ipi plus nivov.s. anti-PD-1; #, anti-PD-1 and ipi/ipi plus nivo v.s. normal PBMC; p<0.05, Tukey's multiplecomparison). (E) Heat map displaying normalized marker expression of T cell clusters. See also Figure S5 and Table S3.

References

    1. Amir el AD, Davis KL, Tadmor MD, Simonds EF, Levine JH, Bendall SC, Shenfeld DK, Krishnaswamy S, Nolan GP, Pe'er D. viSNE enables visualization of high dimensional single-cell data and reveals phenotypic heterogeneity of leukemia. Nat Biotechnol. 2013;31:545–552. - PMC - PubMed
    1. Behbehani GK, Bendall SC, Clutter MR, Fantl WJ, Nolan GP. Single-cell mass cytometry adapted to measurements of the cell cycle. Cytometry A. 2012;81:552–566. - PMC - PubMed
    1. Bendall SC, Simonds EF, Qiu P, Amir el AD, Krutzik PO, Finck R, Bruggner RV, Melamed R, Trejo A, Ornatsky OI, et al. Single-cell mass cytometry of differential immune and drug responses across a human hematopoietic continuum. Science. 2011;332:687–696. - PMC - PubMed
    1. Bengsch B, Johnson AL, Kurachi M, Odorizzi PM, Pauken KE, Attanasio J, Stelekati E, McLane LM, Paley MA, Delgoffe GM, et al. Bioenergetic Insufficiencies Due to Metabolic Alterations Regulated by the Inhibitory Receptor PD-1 Are an Early Driver of CD8(+) T Cell Exhaustion. Immunity. 2016;45:358–373. - PMC - PubMed
    1. Brahmer JR, Drake CG, Wollner I, Powderly JD, Picus J, Sharfman WH, Stankevich E, Pons A, Salay TM, McMiller TL, et al. Phase I study of single-agent anti-programmed death-1 (MDX-1106) in refractory solid tumors: safety, clinical activity, pharmacodynamics, and immunologic correlates. J Clin Oncol. 2010;28:3167–3175. - PMC - PubMed

MeSH terms