. 2017 Nov 1:161:80-93.
doi: 10.1016/j.neuroimage.2017.08.025. Epub 2017 Aug 10.

Real-time motion analytics during brain MRI improve data quality and reduce costs

Affiliations

Real-time motion analytics during brain MRI improve data quality and reduce costs

Nico U F Dosenbach et al. Neuroimage. .

Abstract

Head motion systematically distorts clinical and research MRI data. Motion artifacts have biased findings from many structural and functional brain MRI studies. An effective way to remove motion artifacts is to exclude MRI data frames affected by head motion. However, such post-hoc frame censoring can lead to data loss rates of 50% or more in our pediatric patient cohorts. Hence, many scanner operators collect additional 'buffer data', an expensive practice that, by itself, does not guarantee sufficient high-quality MRI data for a given participant. Therefore, we developed an easy-to-setup, easy-to-use Framewise Integrated Real-time MRI Monitoring (FIRMM) software suite that provides scanner operators with head motion analytics in real-time, allowing them to scan each subject until the desired amount of low-movement data has been collected. Our analyses show that using FIRMM to identify the ideal scan time for each person can reduce total brain MRI scan times and associated costs by 50% or more.

Keywords: Functional MRI; Head motion distortion; MRI acquisition; MRI methods; Real-time quality control; Resting state functional connectivity MRI; Structural MRI.


Figures

Fig. 1
Fig. 1
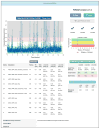
Framewise Integrated Real-time MRI Monitoring (FIRMM) graphical user interface. Sample data are from the Adolescent Brain Cognitive Development (ABCD) study and include both task fMRI and resting state runs.
Fig. 2
Fig. 2
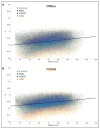
Effects of age, diagnosis and gender on head motion. The mean FD values (y-axis; Offline) for 1134 MRI scan participants are shown relative to participants’ ages (x-axis). Within all cohorts there is massive inter-individual variance in head motion. (a) Shows the participants labeled by diagnoses (Controls, Family History of Alcoholism (Brown et al., 1989), Attention Deficit Hyperactivity Disorder (ADHD-200-Consortium) and Autism Spectrum Disorder [ASD]). (b) Shows the same data labeled by gender. At the top and to the right of each plot the histograms for each cohort are shown. Lines represent LOWESS with span of 0.5.
Fig. 3
Fig. 3
Comparison of FD values generated by FIRMM (red) and Offline approach (blue). FD data shown are from 1134 children and adolescents. (a) Shows the percentage of low movement data (FD < 0.2) for each participant included (y-axis), sorted by the mean percentage of low-movement frames across both methods for each participant (x-axis). (b) Shows the correlation (r = 0.98; linear fit and fit equation shown in green; identity line shown in black) between estimates of low-movement data as calculated by FIRMM (x-axis) and the standard offline post-hoc approach (y-axis).
Fig. 4
Fig. 4
Distance-dependent artifact removal when frame-censoring using Offline and FIRMM FD values. The analysis was implemented as originally published by (Power et al., 2012) using all possible functional connections for a canonical set of 264 regions of interest (Power et al., 2011). The y-axis shows the difference in correlation strength for all functional connections when comparing the frame censored data with the original data (censored – uncensored). Connection lengths (rms distance in mm) are plotted on the x-axis. Within each cohort data were averaged across scanning sessions, prior to plotting. (a) Shows the effects of frame censoring (FD < 0.2 mm) when using the Offline FD numbers. (b) Shows the effects of frame censoring (FD < 0.2 mm) when using the FIRMM FD numbers.
Fig. 5
Fig. 5
Accumulation of low movement data (FD < 0.2 mm; FIRMM FD values). (a) This plot shows the accumulation of low movement data (min. FD < 0.2; y-axis) relative to the time spent scanning (min.; x-axis) for sample individuals from each of our cohorts. For standardization, we chose to display the accumulation plot for those participants at the 50th percentile of usable data after 15 min of scanning, for each cohort. (b) Shows the percentage of participants that have reached the chosen data criterion of at least 5 min of data with FD < 0.2 mm for each of our cohorts as well as the total sample (black). In this plot the area under the curve represents the relative scan time savings when scanning-to-criterion instead of scanning all participants for 20 min. Time savings would have been 57% for the entire sample (black), 63% for controls (green), 64% for FHA (purple), 51% for ADHD (blue) and 46% for ASD (orange).
Fig. 6
Fig. 6
Linear accumulation of low-movement data allows accurate prediction of time-to-criterion. (a) Shows the mean FD (FIRMM processing) for each cohort (FHA excluded because only 8 min of data were collected for most subjects) and the sample as a whole (black line) as a function of the time participants have already spent in the scanner. (b) Shows the % of data frames with FD < 0.2 at every time point in the scan for each of the cohorts. (c) Shows the relationship between the time scanned (x-axis) and the mean amount of low movement data (FD < 0.2) accumulated for each cohort (actual data shown with solid lines; linear fits shown with dashed lines). (d) Shows the FD trace for a single individual participant (black line) and compares it to the predictions FIRMM made at different points during the experiment (colored traces). (e) Shows FIRMM’s prediction error (in minutes; thick line) and actual data accumulation (thin black line) across the length of the scan (x-axis) for the same subject as in (d). (f) Shows FIRMM’s average prediction error (%) over time (x-axis) for each cohort and the entire group (solid lines), while the dashed lines indicate ± 1 standard deviation.
Fig. 7
Fig. 7
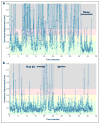
Sample FIRMM FD traces. For the MRI scans shown here, access to FIRMM’s real-time FD traces enabled scanner operators to intervene and improve MRI data quality. (a) Shows the FIRMM trace for a child who fell asleep towards the end of the scanning session. (b) Shows the FIRMM trace for a child who had much greater head movement for run #4.

References

    1. ADHD-200-Consortium. The ADHD-200 consortium: a model to advance the translational potential of neuroimaging in clinical neuroscience. Front Syst Neurosci. 2012;6:62. - PMC - PubMed
    1. Alhamud A, Taylor PA, Laughton B, van der Kouwe AJ, Meintjes EM. Motion artifact reduction in pediatric diffusion tensor imaging using fast prospective correction. J Magn Reson Imaging. 2015;41:1353–1364. - PMC - PubMed
    1. Alhamud A, Taylor PA, van der Kouwe AJ, Meintjes EM. Real-time measurement and correction of both B0 changes and subject motion in diffusion tensor imaging using a double volumetric navigated (DvNav) sequence. Neuroimage. 2016;126:60–71. - PMC - PubMed
    1. Behzadi Y, Restom K, Liau J, Liu TT. A component based noise correction method (CompCor) for BOLD and perfusion based fMRI. Neuroimage. 2007;37:90–101. - PMC - PubMed
    1. Benner T, van der Kouwe AJ, Sorensen AG. Diffusion imaging with prospective motion correction and reacquisition. Magn Reson Med. 2011;66:154–167. - PMC - PubMed

Publication types

MeSH terms