

Metabolomics based markers predict type 2 diabetes in a 14-year follow-up study
- PMID: 28804275
- PMCID: PMC5533833
- DOI: 10.1007/s11306-017-1239-2
Metabolomics based markers predict type 2 diabetes in a 14-year follow-up study
Abstract
Background: The growing field of metabolomics has opened up new opportunities for prediction of type 2 diabetes (T2D) going beyond the classical biochemistry assays.
Objectives: We aimed to identify markers from different pathways which represent early metabolic changes and test their predictive performance for T2D, as compared to the performance of traditional risk factors (TRF).
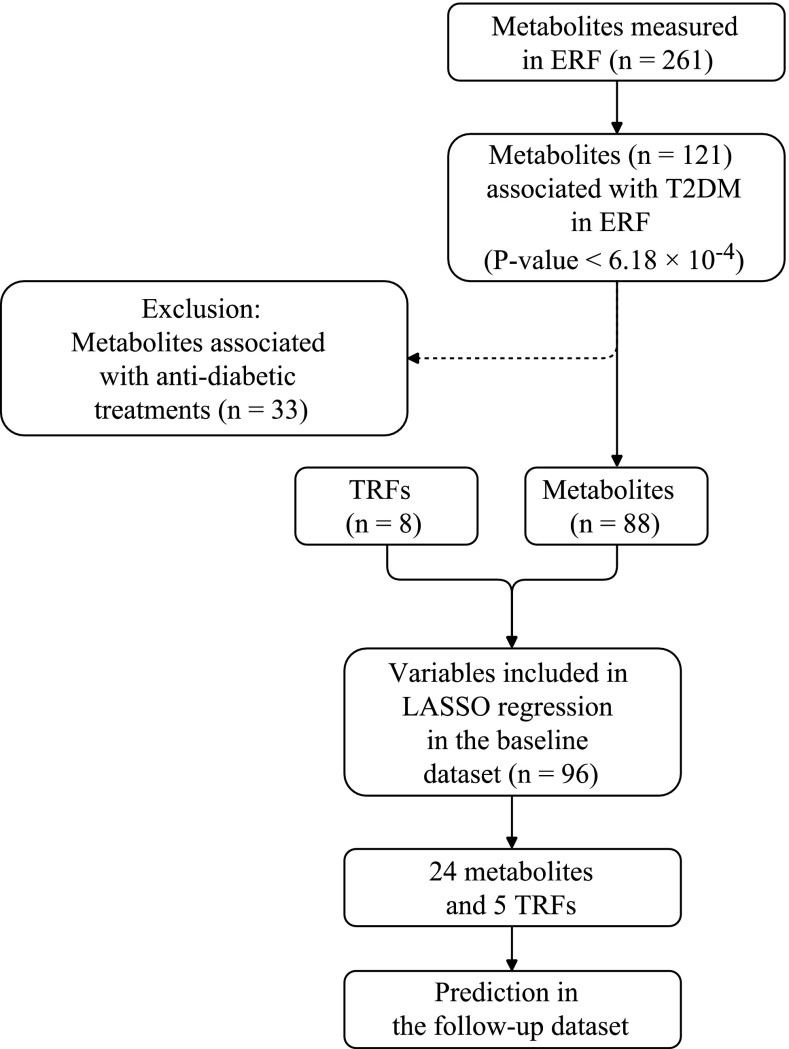
Methods: We analyzed 2776 participants from the Erasmus Rucphen Family study from which 1571 disease free individuals were followed up to 14-years. The targeted metabolomics measurements at baseline were performed by three different platforms using either nuclear magnetic resonance spectroscopy or mass spectrometry. We selected 24 T2D markers by using Least Absolute Shrinkage and Selection operator (LASSO) regression and tested their association to incidence of disease during follow-up.
Results: The 24 markers i.e. high-density, low-density and very low-density lipoprotein sub-fractions, certain triglycerides, amino acids, and small intermediate compounds predicted future T2D with an area under the curve (AUC) of 0.81. The performance of the metabolic markers compared to glucose was significantly higher among the young (age < 50 years) (0.86 vs. 0.77, p-value <0.0001), the female (0.88 vs. 0.84, p-value =0.009), and the lean (BMI < 25 kg/m2) (0.85 vs. 0.80, p-value =0.003). The full model with fasting glucose, TRFs, and metabolic markers yielded the best prediction model (AUC = 0.89).
Conclusions: Our novel prediction model increases the long-term prediction performance in combination with classical measurements, brings a higher resolution over the complexity of the lipoprotein component, increasing the specificity for individuals in the low risk group.
Keywords: Early biomarkers; Metabolites; Metabolomics; Prediction; Prospective study; Type 2 diabetes.
Conflict of interest statement
Conflict of interest
All the authors report no financial or other conflict of interest relevant to the subject of this article.
Ethical approval
Informed consent has been obtained from patients where appropriate. The study protocol was approved by the medical ethics board of the Erasmus Medical Center Rotterdam, the Netherlands. This article does not contain any studies with animals performed by any of the authors.
Figures


Similar articles
-
Biomarkers for predicting type 2 diabetes development-Can metabolomics improve on existing biomarkers?PLoS One. 2017 Jul 10;12(7):e0177738. doi: 10.1371/journal.pone.0177738. eCollection 2017. PLoS One. 2017. PMID: 28692646 Free PMC article.
-
Early metabolic markers identify potential targets for the prevention of type 2 diabetes.Diabetologia. 2017 Sep;60(9):1740-1750. doi: 10.1007/s00125-017-4325-0. Epub 2017 Jun 8. Diabetologia. 2017. PMID: 28597074 Free PMC article.
-
Identification of metabolic markers predictive of prediabetes in a Korean population.Sci Rep. 2020 Dec 15;10(1):22009. doi: 10.1038/s41598-020-78961-4. Sci Rep. 2020. PMID: 33319826 Free PMC article.
-
Metabolomics in diabetes, a review.Ann Med. 2016;48(1-2):89-102. doi: 10.3109/07853890.2015.1137630. Epub 2016 Jan 30. Ann Med. 2016. PMID: 26883715 Review.
-
Metabolomics in diabetes.Clin Chim Acta. 2014 Feb 15;429:106-10. doi: 10.1016/j.cca.2013.11.037. Epub 2013 Dec 7. Clin Chim Acta. 2014. PMID: 24321733 Review.
Cited by
-
Quartet metabolite reference materials for inter-laboratory proficiency test and data integration of metabolomics profiling.Genome Biol. 2024 Jan 24;25(1):34. doi: 10.1186/s13059-024-03168-z. Genome Biol. 2024. PMID: 38268000 Free PMC article.
-
Metabolomics and Proteomics in Type 2 Diabetes.Circ Res. 2020 May 22;126(11):1613-1627. doi: 10.1161/CIRCRESAHA.120.315898. Epub 2020 May 21. Circ Res. 2020. PMID: 32437301 Free PMC article. Review.
-
Interpretable machine learning methods for predictions in systems biology from omics data.Front Mol Biosci. 2022 Oct 17;9:926623. doi: 10.3389/fmolb.2022.926623. eCollection 2022. Front Mol Biosci. 2022. PMID: 36387282 Free PMC article. Review.
-
Identification and Functional Characterization of Metabolites for Bone Mass in Peri- and Postmenopausal Chinese Women.J Clin Endocrinol Metab. 2021 Jul 13;106(8):e3159-e3177. doi: 10.1210/clinem/dgab146. J Clin Endocrinol Metab. 2021. PMID: 33693744 Free PMC article.
-
The Regulation Role of the Gut-Islets Axis in Diabetes.Diabetes Metab Syndr Obes. 2024 Mar 22;17:1415-1423. doi: 10.2147/DMSO.S455026. eCollection 2024. Diabetes Metab Syndr Obes. 2024. PMID: 38533266 Free PMC article. Review.
References
-
- Andrew G, Jennifer H. Data analysis using regression and multilevel/hierarchical models. Cambridge: Cambridge University Press; 2006. pp. 529–543.
LinkOut - more resources
Full Text Sources
Other Literature Sources