. 2017 Jul 28:8:1326.
doi: 10.3389/fpls.2017.01326. eCollection 2017.

A Comprehensive Biophysical Model of Ion and Water Transport in Plant Roots. I. Clarifying the Roles of Endodermal Barriers in the Salt Stress Response

Affiliations

A Comprehensive Biophysical Model of Ion and Water Transport in Plant Roots. I. Clarifying the Roles of Endodermal Barriers in the Salt Stress Response

Kylie J Foster et al. Front Plant Sci. .

Abstract

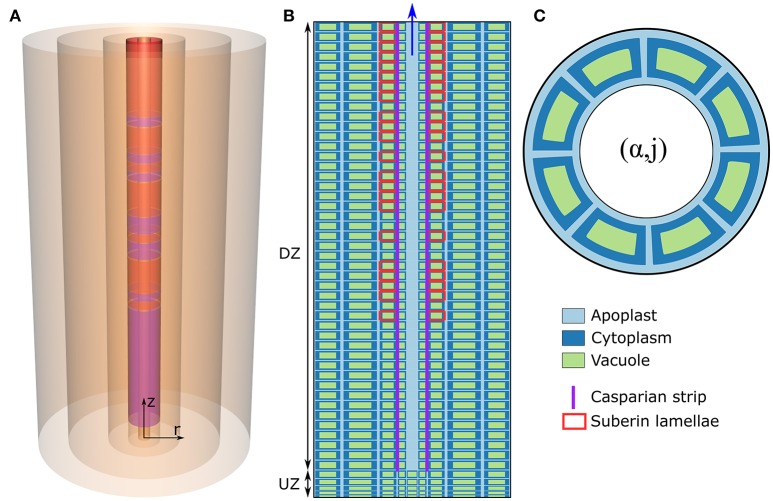
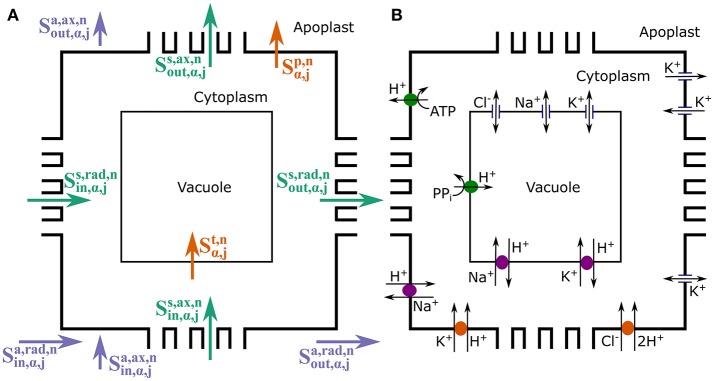
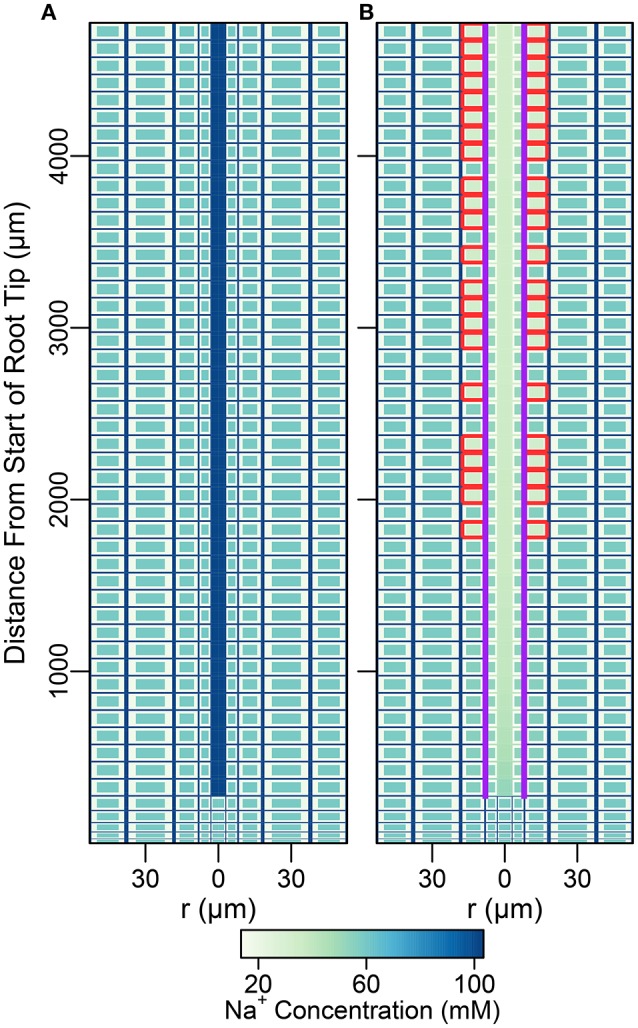
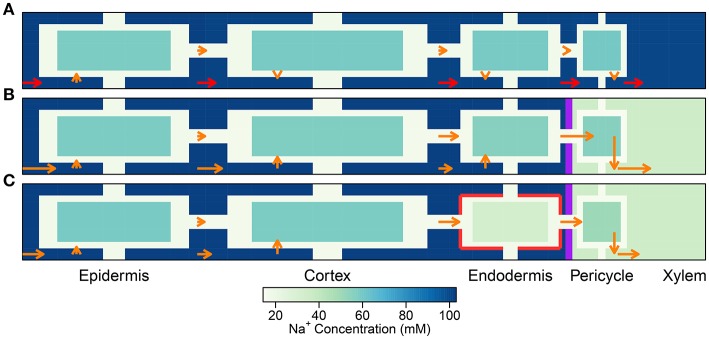
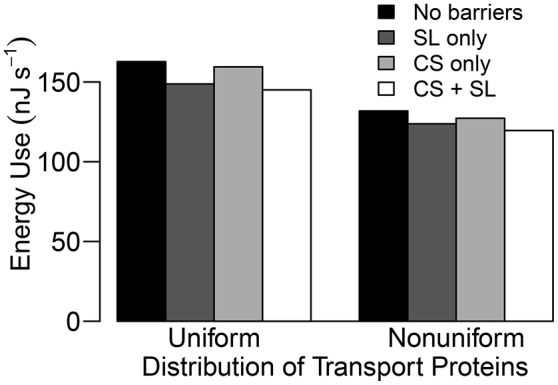
In this paper, we present a detailed and comprehensive mathematical model of active and passive ion and water transport in plant roots. Two key features are the explicit consideration of the separate, but interconnected, apoplastic, and symplastic transport pathways for ions and water, and the inclusion of both active and passive ion transport mechanisms. The model is used to investigate the respective roles of the endodermal Casparian strip and suberin lamellae in the salt stress response of plant roots. While it is thought that these barriers influence different transport pathways, it has proven difficult to distinguish their separate functions experimentally. In particular, the specific role of the suberin lamellae has been unclear. A key finding based on our simulations was that the Casparian strip is essential in preventing excessive uptake of Na+ into the plant via apoplastic bypass, with a barrier efficiency that is reflected by a sharp gradient in the steady-state radial distribution of apoplastic Na+ across the barrier. Even more significantly, this function cannot be replaced by the action of membrane transporters. The simulations also demonstrated that the positive effect of the Casparian strip of controlling Na+ uptake, was somewhat offset by its contribution to the osmotic stress component: a more effective barrier increased the detrimental osmotic stress effect. In contrast, the suberin lamellae were found to play a relatively minor, even non-essential, role in the overall response to salt stress, with the presence of the suberin lamellae resulting in only a slight reduction in Na+ uptake. However, perhaps more significantly, the simulations identified a possible role of suberin lamellae in reducing plant energy requirements by acting as a physical barrier to preventing the passive leakage of Na+ into endodermal cells. The model results suggest that more and particular experimental attention should be paid to the properties of the Casparian strip when assessing the salt tolerance of different plant varieties and species. Indeed, the Casparian strip appears to be a more promising target for plant breeding and plant genetic engineering efforts than the suberin lamellae for the goal of improving salt tolerance.

Keywords: Casparian strip; apoplastic and symplastic transport; osmotic stress; salt tolerance; suberin lamellae.


Figures

Figure 1
Figure 1
(A) Schematic of the cylindrical model root, showing the radial discretization and the endodermal barriers. The purple (red) cylinders represent the CS (SL). (B) Schematic longitudinal cross-section of the root. Different cell compartments are highlighted by different colors: apoplast (light blue); cytoplasms (dark blue); the vacuoles (green). For clarity, these compartments are not drawn to scale and the z and r axes are scaled differently. The extent of the different developmental zones—the differentiation zone (DZ) and undifferentiated zone (UZ)—are indicated by arrows. Purple (red) lines represent the location of the CS (SL). (C) Top view of the root showing the angular distribution of cells in a given (α, j) element.
Figure 2
Figure 2
Schematic longitudinal cross-sections of an (α, j) element, showing the three compartments (apoplast, cytoplasm, and vacuole) and the different ion fluxes included in the model. The cross-sections illustrate: (A) the symplastic (green), apoplastic (purple), and transmembrane (orange) ion fluxes; and (B) the membrane transport proteins (pumps, antiporters, symporters, and channels) present on the tonoplast and plasma membranes responsible for the transmembrane fluxes. For reaction processes see Figure S1.
Figure 3
Figure 3
Color maps of steady-state Na+ concentrations assuming a uniform distribution of membrane transport proteins and two different root structures: (A) no endodermal barriers present; (B) CS and SL with passage cells present. Purple (red) lines show the location of the CS (SL). Results are shown for all three compartments (apoplast, cytoplasm, and vacuole, not drawn to scale). Pb = −0.5 MPa, remaining boundary conditions and transport parameters are as described in Sections 3.3 and 3.4, as well as Tables S1, S2. Compare the results of (B) with results shown in Figure S2B for the CS located at the cortical-endodermal interface.
Figure 4
Figure 4
Plots of steady-state Na+ fluxes (arrows) and Na+ concentrations (color maps) at a point halfway along the differentiation zone (j = 28), for a uniform distribution of transporters and three different root structures: (A) no endodermal barriers present, (B) CS present, and (C) CS and SL present. Purple (red) lines show the location of the CS (SL). Arrows indicate relative flux magnitudes via the apoplast, symplast, and across the cell plasma membranes (for clarity, axial fluxes are not displayed). Orange arrows are drawn to the same scale across all three subfigures. Red arrows represent 100 times larger fluxes relative to the orange arrows. Na+ concentrations are shown for all three compartments (apoplast, cytoplasm, and vacuole), although the latter are not drawn to scale (different scale to Figure 3). The simulation conditions are as described in Figure 3.
Figure 5
Figure 5
Plots of steady-state (A) Na+ concentrations, (B) Na+ fluxes, and (C) water flow rates, in the transpiration stream at the top of the root under pre-salt (light lines) and salt stress (dark lines) conditions, as a function of Pb for a uniform distribution of transporters and five different root structures (see also Figure S3). Panels (D–F) show the same information as (A–C), respectively, excluding the no endodermal barrier scenario to highlight the effects of the SL. Line types refer to root structure: solid red lines ≡ no endodermal barriers (as shown in Figure 3A); dashed blue lines ≡ CS only; dotted green lines ≡ CS and a continuous, uninterrupted SL; and dot-dashed purple lines ≡ CS and SL with passage cells (as shown in Figure 3B). Squares represent the SL-only case (corresponding to the root structure shown in Figure S10B). The simulation conditions are as described in Sections 3.3 and 3.4, as well as Tables S1, S2.
Figure 6
Figure 6
Plot of steady-state pre-salt minus salt stress water flow rates in the transpiration stream at the top of the root, as a function of Pb for CSs with a range of permeabilities. Line types indicate CS effectiveness: no CS present (dotted lines); kα = 4,jCSa,rad,n and Lp:α = 4,jCSa,rad reduced by one order of magnitude (short dot-dashed lines); kα = 4,jCSa,rad,n and Lp:α = 4,jCSa,rad reduced by two orders of magnitude (short dashed lines); kα = 4,jCSa,rad,n and Lp:α = 4,jCSa,rad reduced by three orders of magnitude (long dot-dashed lines); kα = 4,jCSa,rad,n and Lp:α = 4,jCSa,rad reduced by four orders of magnitude (long dashed lines); a completely impermeable CS (solid lines). The SL were excluded from all simulations. The remaining transport parameters and boundary conditions are as described in Sections 3.3 and 3.4, as well as Tables S1, S2.
Figure 7
Figure 7
Plots of steady-state percentage of Na+ flux across the apoplastic endodermis-pericycle interface (apoplastic bypass flow) vs. (A) the difference in apoplastic Na+ concentration across the CS (the apoplastic Na+ concentration in the endodermis minus the apoplastic Na+ concentration in the pericycle), and (B) the difference in vacuolar Na+ concentration across the outer tissues (the vacuolar Na+ concentration in the endodermis minus the vacuolar Na+ concentration in the epidermis), based on the range of partially permeable CSs shown in Figure 6. The results are shown for three different levels of transpiration: Pb = −0.1 MPa (light gray triangles), Pb = −0.25 MPa (dark gray circles), and Pb = −0.5 MPa (black squares). The percentage of apoplastic bypass flow of Na+ was determined using: 100×(radial apoplastic flux of Na+ across the endodermis − pericycle interface)/total radial Na+ flux across the endodermis-pericycle interface. The total flux is the sum of the symplastic and apoplastic fluxes. All concentrations were taken at a point halfway along the DZ (j = 28). The simulation conditions are as described in Figure 6.
Figure 8
Figure 8
As per Figure 4 except for the non-uniform distribution of membrane transport proteins as described in Section 3.4. Simulations were conducted using Pb = −0.5 MPa and conditions and parameters as described in Sections 3.3 and 3.4, as well as Table 1 and Tables S1, S2.
Figure 9
Figure 9
Steady state energy use histograms for a uniform and a non-uniform distribution of transporters as described in Section 3.4 for four different root structures: no endodermal barriers (black); SL only (dark gray); CS only (light gray); CS and SL present (white). Energy use is estimated by the energy released from hydrolysis of ATP (approximately 54.8 kJ per mole of ATP hydrolyzed (Schmidt and Briskin, 1993) and hence, 54.8 kJ per mole of H+ pumped across the plasma membranes) and hydrolysis of PPi (≈24.9 kJ per mole of H+ pumped across the tonoplasts, Schmidt and Briskin, 1993). This is a measure of the energy used to pump H+ which cannot then be used by the plant for other processes. Qualitatively identical results are obtained if the total steady state flux of H+ via all pumps is used as a proxy for energy use. Simulations were conducted using Pb = −0.5 MPa with remaining conditions and parameters as described in Sections 3.3 and 3.4, as well as Table 1 and Tables S1, S2.

Similar articles

Cited by

References

    1. Anil V. S., Krishnamurthy H., Mathew M. K. (2007). Limiting cytosolic Na+ confers salt tolerance to rice cells in culture: a two-photon microscopy study of SBFI-loaded cells. Physiol. Plant. 129, 607–621. 10.1111/j.1399-3054.2006.00854.x - DOI
    1. Barberon M., Geldner N. (2014). Radial transport of nutrients: the plant root as a polarized epithelium. Plant Physiol. 166, 528–537. 10.1104/pp.114.246124 - DOI - PMC - PubMed
    1. Barberon M., Vermeer J., DeăBellis D., Wang P., Naseer S., Andersen T., et al. . (2016). Adaptation of root function by nutrient-induced plasticity of endodermal differentiation. Cell 164, 447–459. 10.1016/j.cell.2015.12.021 - DOI - PubMed
    1. Baxter I., Hosmani P. S., Rus A., Lahner B., Borevitz J. O., Muthukumar B., et al. . (2009). Root suberin forms an extracellular barrier that affects water relations and mineral nutrition in Arabidopsis. PLoS Genet. 5:e1000492. 10.1371/journal.pgen.1000492 - DOI - PMC - PubMed
    1. Claus J., Bohmann A., Chavarría-Krauser A. (2013). Zinc uptake and radial transport in roots of Arabidopsis thaliana: a modelling approach to understand accumulation. Ann. Bot. 112, 369–380. 10.1093/aob/mcs263 - DOI - PMC - PubMed

LinkOut - more resources