. 2017 Sep 1;127(9):3441-3461.
doi: 10.1172/JCI93825. Epub 2017 Aug 14.

YAP/TAZ regulates sprouting angiogenesis and vascular barrier maturation

Affiliations

YAP/TAZ regulates sprouting angiogenesis and vascular barrier maturation

Jongshin Kim et al. J Clin Invest. .

Abstract

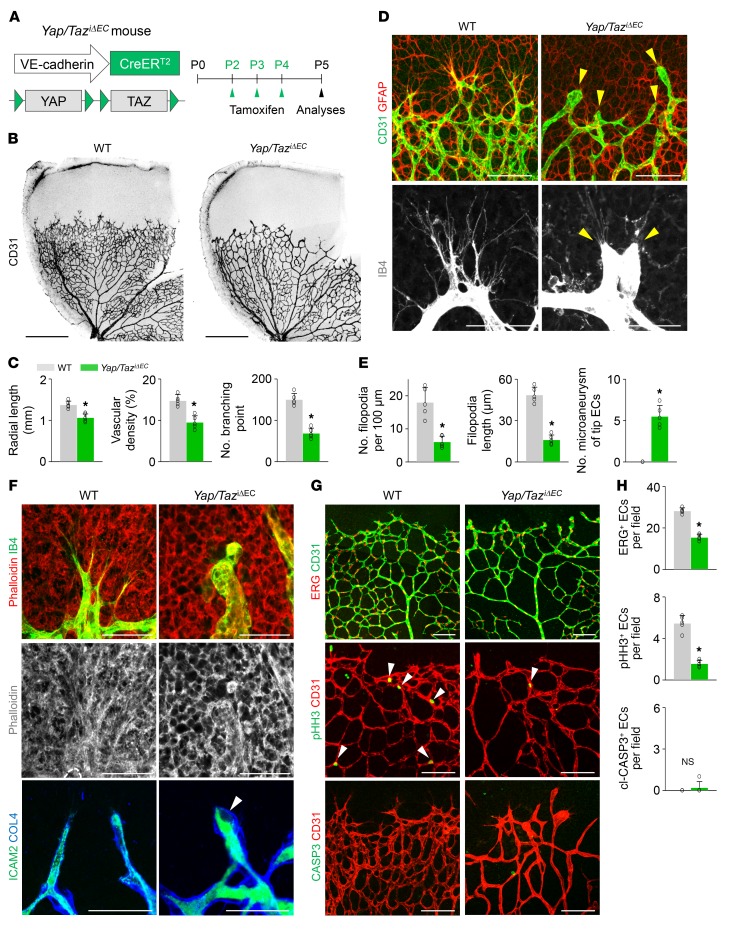
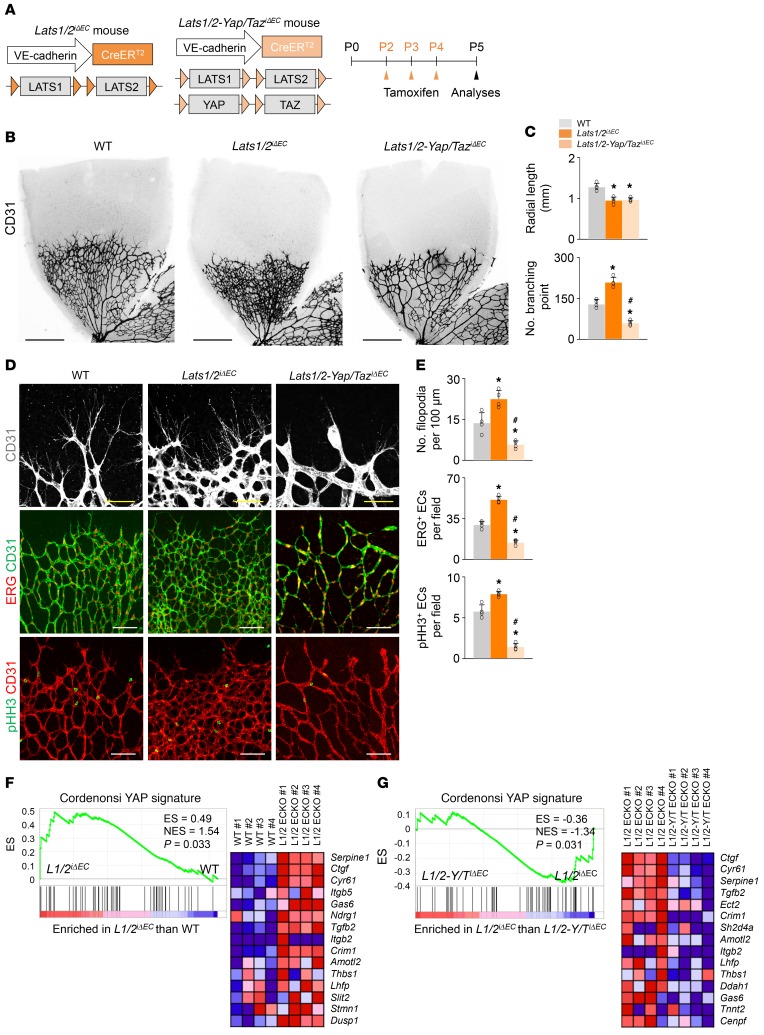
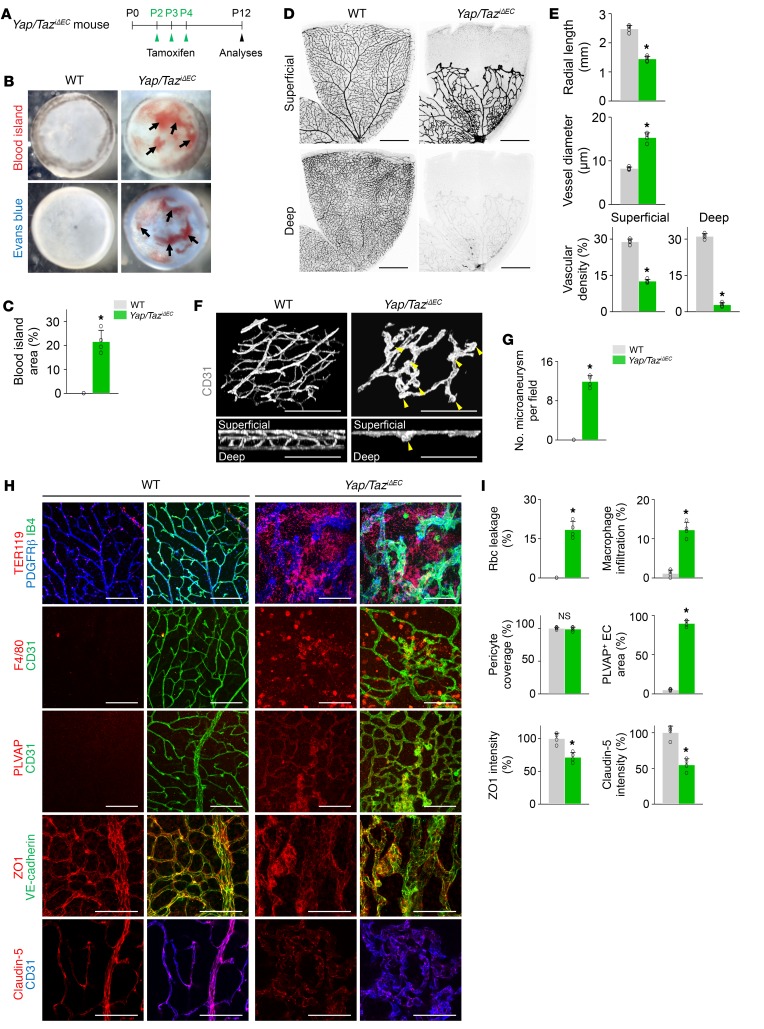
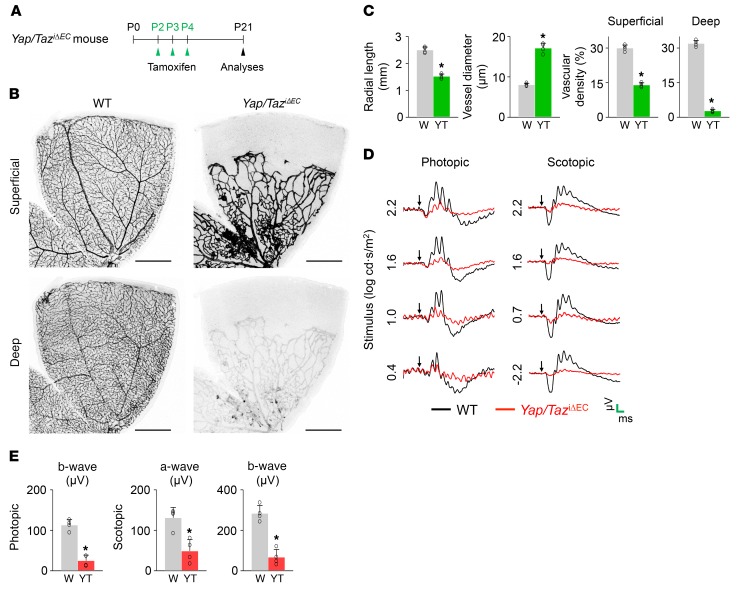
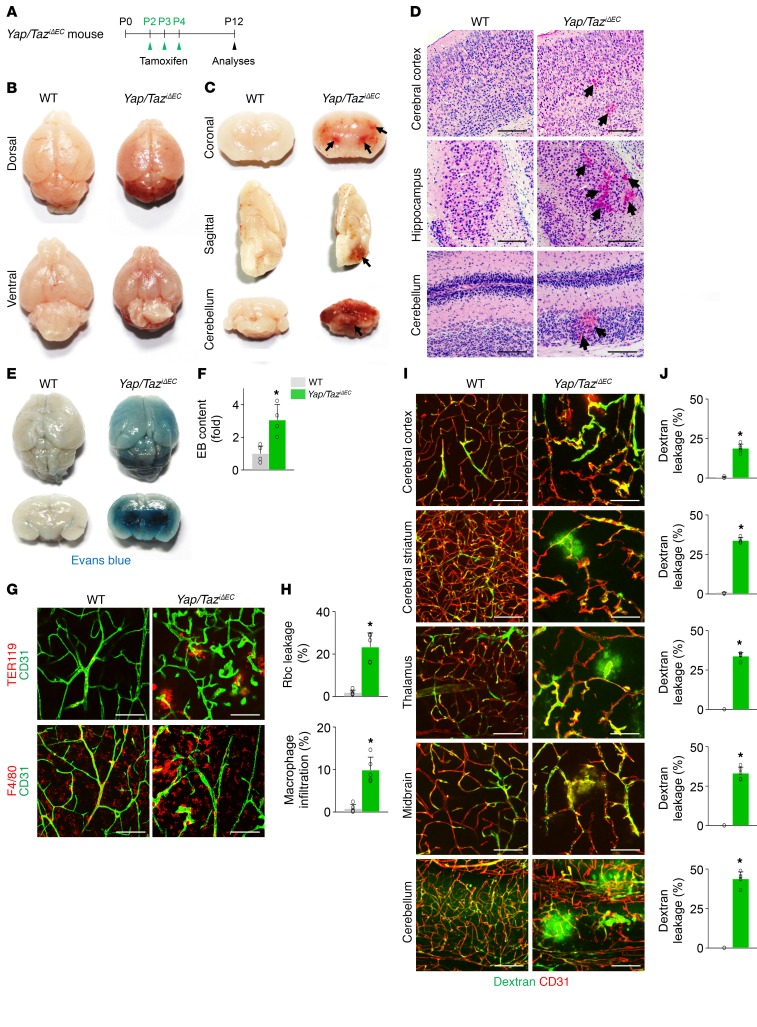
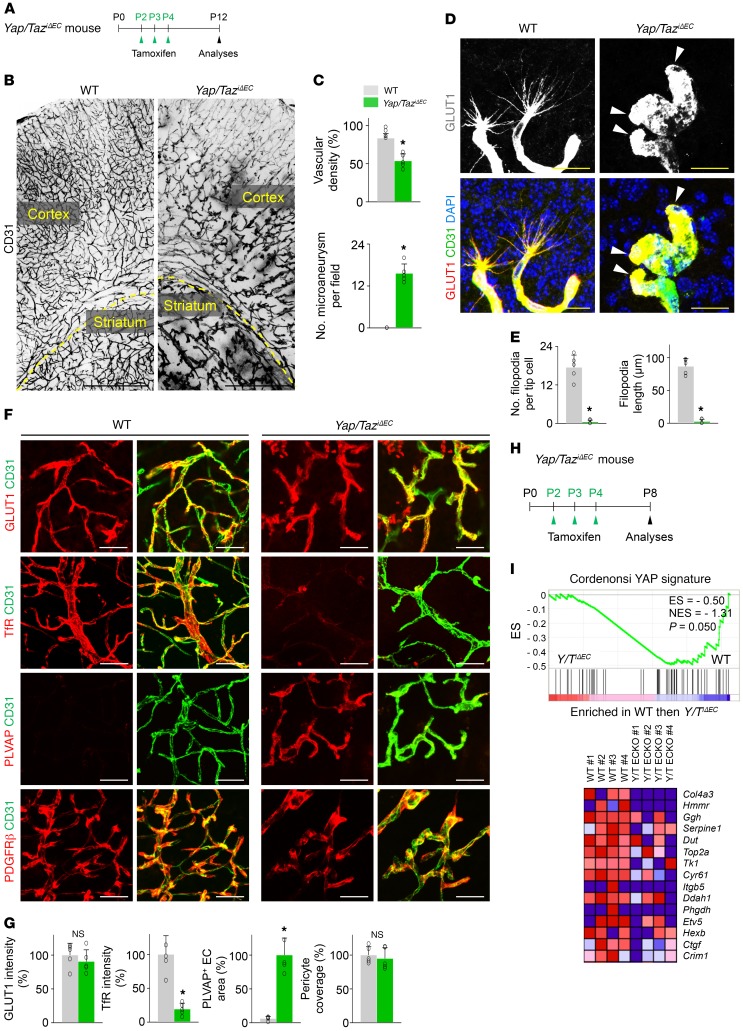
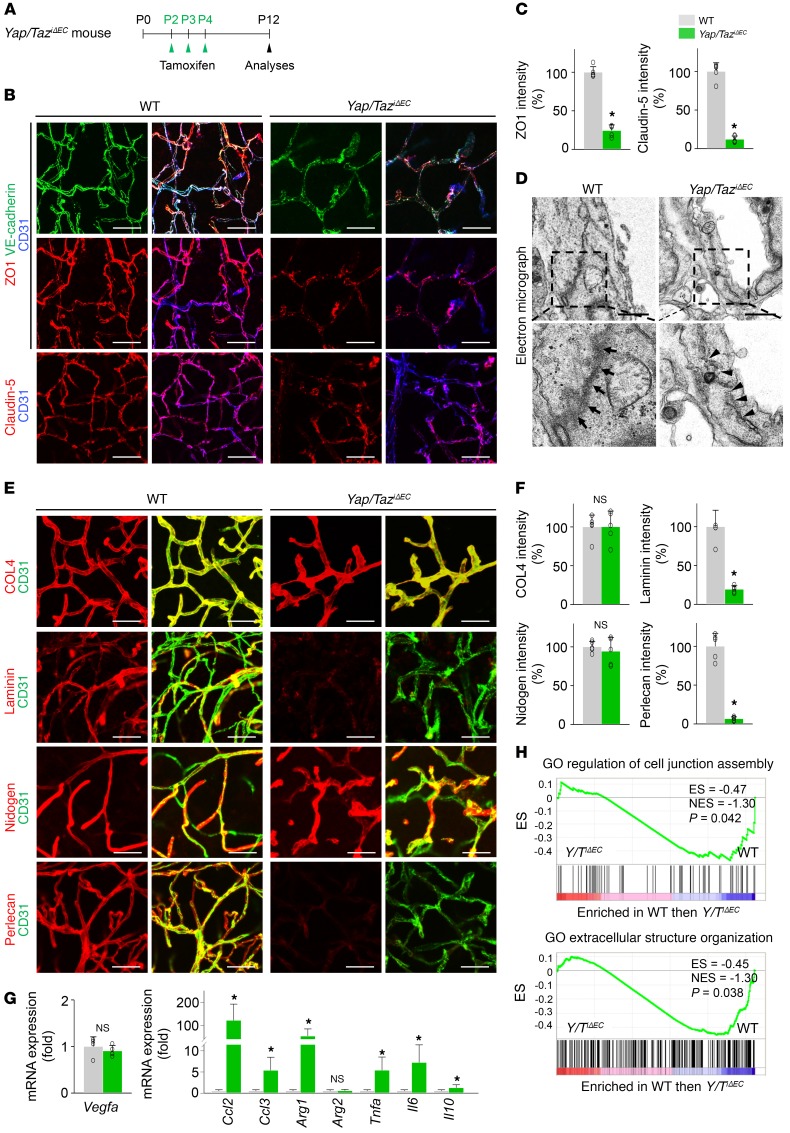
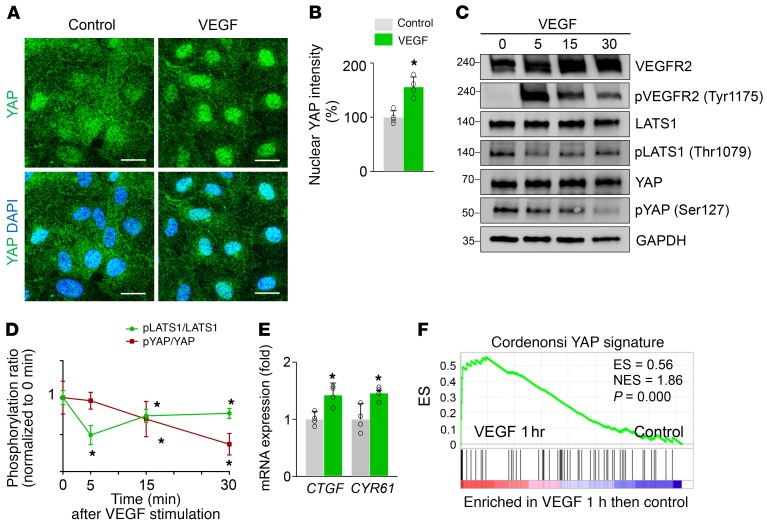
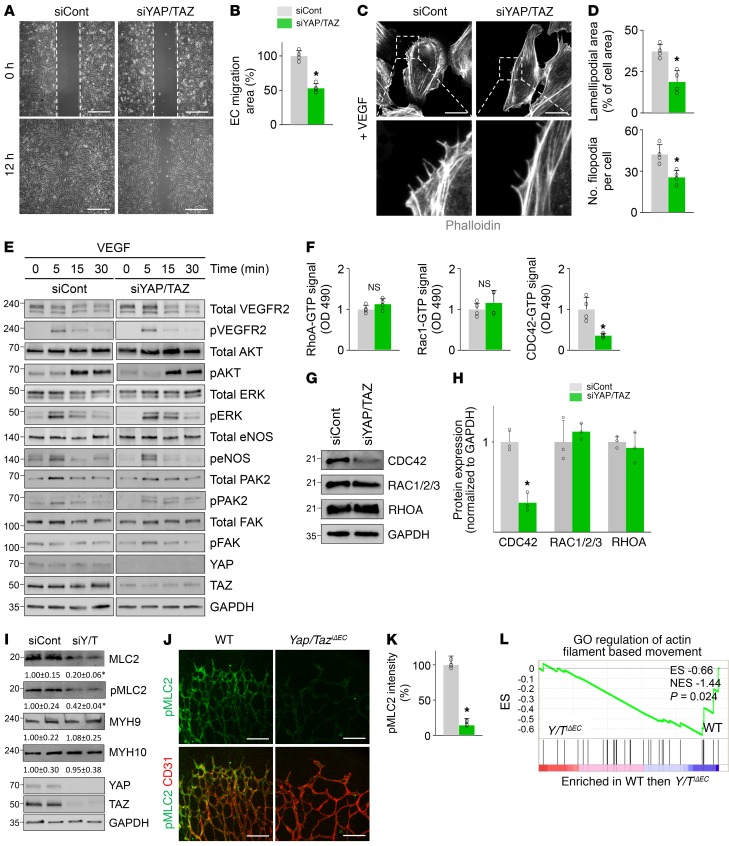
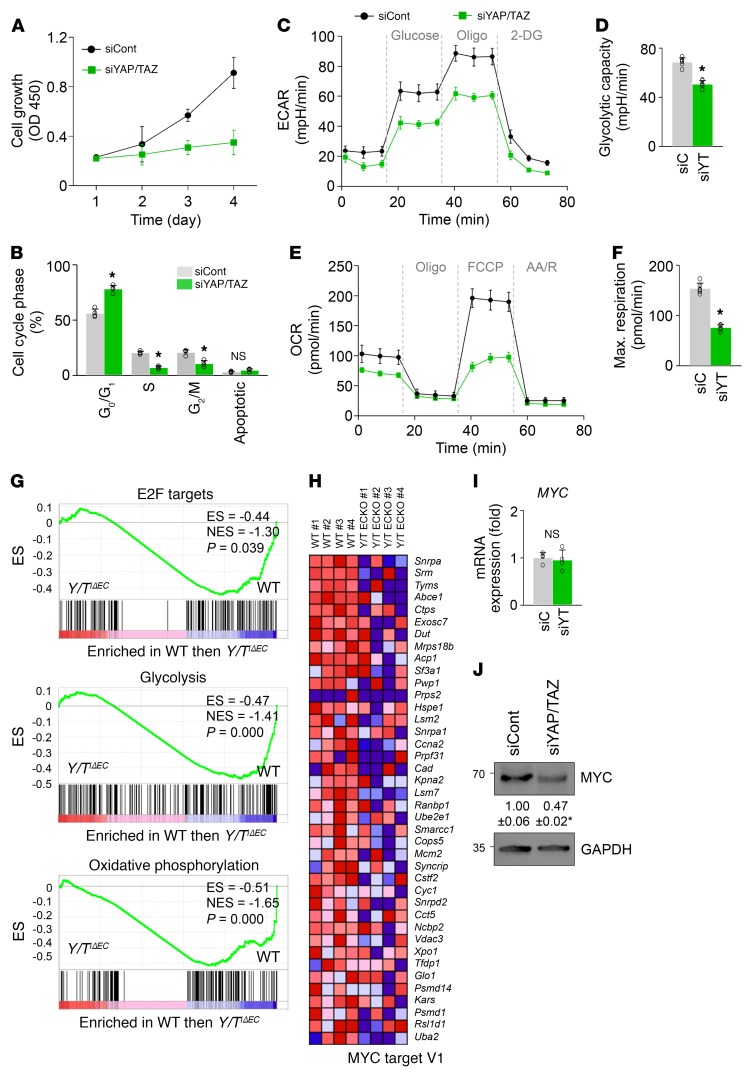
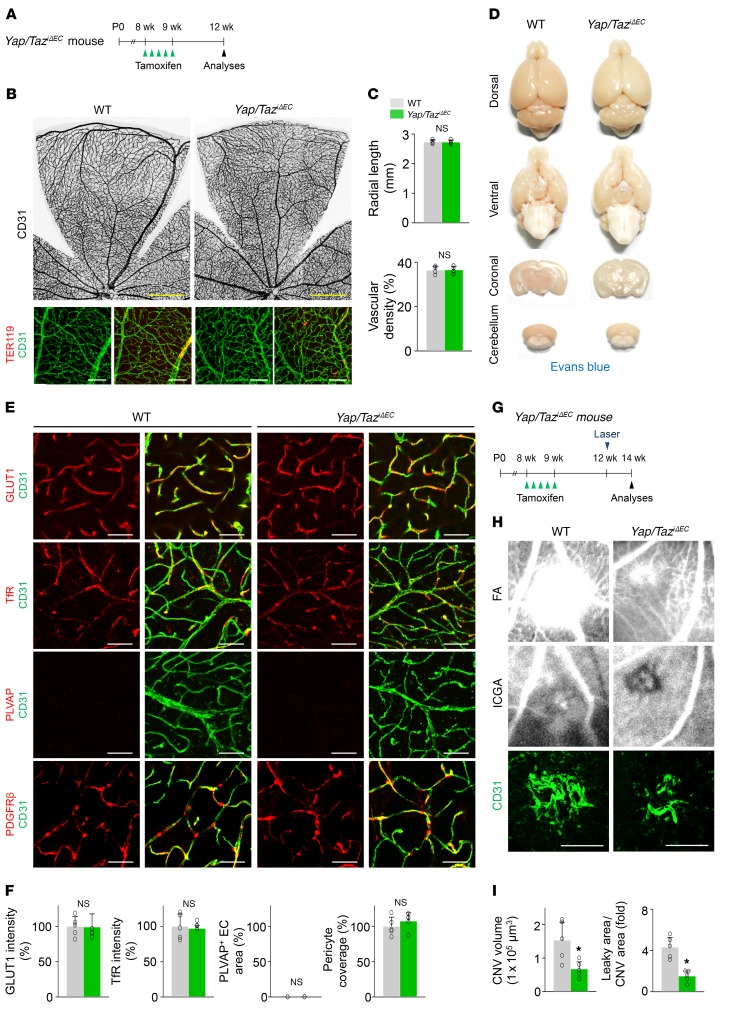
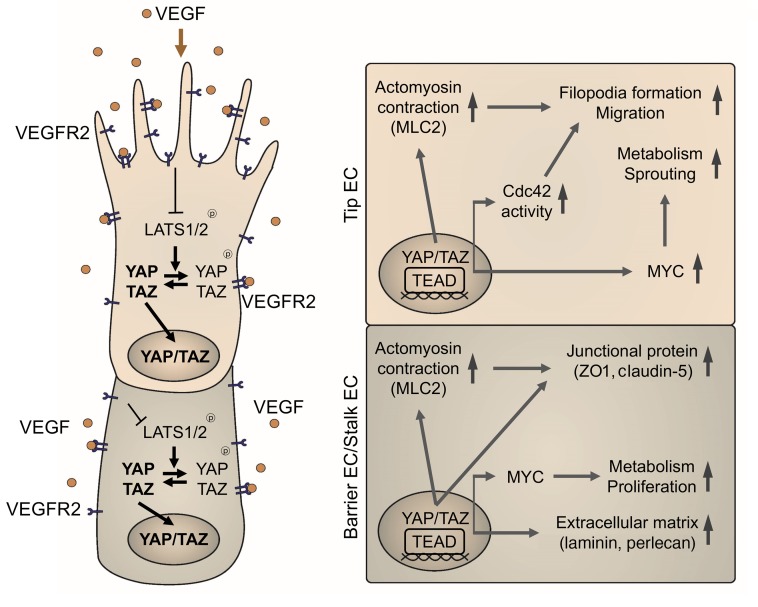
Angiogenesis is a multistep process that requires coordinated migration, proliferation, and junction formation of vascular endothelial cells (ECs) to form new vessel branches in response to growth stimuli. Major intracellular signaling pathways that regulate angiogenesis have been well elucidated, but key transcriptional regulators that mediate these signaling pathways and control EC behaviors are only beginning to be understood. Here, we show that YAP/TAZ, a transcriptional coactivator that acts as an end effector of Hippo signaling, is critical for sprouting angiogenesis and vascular barrier formation and maturation. In mice, endothelial-specific deletion of Yap/Taz led to blunted-end, aneurysm-like tip ECs with fewer and dysmorphic filopodia at the vascular front, a hyper-pruned vascular network, reduced and disarranged distributions of tight and adherens junction proteins, disrupted barrier integrity, subsequent hemorrhage in growing retina and brain vessels, and reduced pathological choroidal neovascularization. Mechanistically, YAP/TAZ activates actin cytoskeleton remodeling, an important component of filopodia formation and junction assembly. Moreover, YAP/TAZ coordinates EC proliferation and metabolic activity by upregulating MYC signaling. Overall, these results show that YAP/TAZ plays multifaceted roles for EC behaviors, proliferation, junction assembly, and metabolism in sprouting angiogenesis and barrier formation and maturation and could be a potential therapeutic target for treating neovascular diseases.


Conflict of interest statement

Conflict of interest: The authors have declared that no conflict of interest exists.

Figures

Figure 1
Figure 1. Endothelial YAP/TAZ is a crucial regulator of vascular sprouting and growth.
(A) Diagram for EC-specific depletion of YAP/TAZ in retinal vessels from P2 and their analyses at P5 using Yap/TaziΔEC mice. (B and C) Images of CD31+ retinal vessels and comparisons of indicated parameters in WT and Yap/TaziΔEC mice (n = 5, each group). Scale bars: 500 μm. (D and E) Magnified images and comparisons of retinal vessels in the vascular front region of WT and Yap/TaziΔEC mice at P5 (n = 5, each group). Tip ECs in Yap/TaziΔEC mice exhibit an aneurysm-like structure with less and dysmorphic filopodia (yellow arrowheads). Scale bars: 100 μm, top panels; 50 μm, bottom panels. (F) Images showing phalloidin+ actin filament (F-actin) bundle and ICAM2+/collagen IV+ (COL4+) lumen formation in tip ECs of WT and Yap/TaziΔEC mice. No organized F-actin bundle–containing protrusions and defective lumen formation (white arrowhead) are detected in tip ECs of Yap/TaziΔEC mice. Scale bars: 50 μm. (G and H) Images and comparisons of ERG+ ECs, pHH3+ proliferating ECs (white arrowheads), and cl-CASP3+ apoptotic ECs in WT and Yap/TaziΔEC mice (n = 5, each group). Scale bars: 100 μm. Error bars represent mean ± SD. *P < 0.05 vs. WT by Mann-Whitney U test.
Figure 2
Figure 2. Endothelial Lats1/2 deletion causes dense and hyperplastic vascular network in growing retinal vessels, and their phenotypes are vanished by endothelial Yap/Taz codeletion.
(A) Diagram for EC-specific deletion of Lats1/2 and double deletions of Lats1/2 and Yap/Taz in retinal vessels from P2 and their analyses at P5 in Lats1/2iΔEC and Lats1/2-Yap/TaziΔEC mice. (B and C) Images of CD31+ retinal vessels and comparisons of indicated parameters in WT, Lats1/2iΔEC, and Lats1/2-Yap/TaziΔEC mice (n = 4, each group). Scale bars: 500 μm. (D and E) Images and comparisons of CD31+ retinal vessels in the vascular front region, ERG+ ECs, and pHH3+ proliferative ECs in WT, Lats1/2iΔEC, and Lats1/2-Yap/TaziΔEC mice (n = 4, each group). Scale bars: 100 μm. (F) GSEA of isolated lung ECs showing the upregulation of YAP signature genes in Lats1/2iΔEC compared with WT mice, and corresponding heatmaps of the top 15 enriched genes. ES, enrichment score; NES, normalized enrichment score. (G) GSEA of isolated lung ECs showing the downregulation of YAP signature genes in Lats1/2-Yap/TaziΔEC compared with Lats1/2iΔEC mice, and corresponding heatmaps of the top 15 enriched genes. Error bars represent mean ± SD. *P < 0.05 vs. WT, #P < 0.05 vs. Lats1/2iΔEC by Mann-Whitney U test.
Figure 3
Figure 3. Endothelial Yap/Taz deletion impairs formation of vertical branching and barrier integrity in retina.
(A) Diagram depicting the experiment schedule for EC-specific deletion of Yap/Taz in retinal vessels from P2 and their analyses at P12 in Yap/TaziΔEC mice. (B and C) Images of inner surface of retinal cup and comparison of blood island area of WT and Yap/TaziΔEC mice (n = 4, each group). Vitreous and retinal hemorrhage (arrows) and Evans blue (EB) leakage (bottom panels) are detected in Yap/TaziΔEC mice. (D and E) Images of CD31+ vessels in superficial and deep layers of retinas and comparisons of indicated parameters in WT and Yap/TaziΔEC mice (n = 4, each group). Scale bars: 500 μm. (F and G) 3D reconstructed images of CD31+ vascular plexus and comparison of number of microaneurysms in WT and Yap/TaziΔEC mice (n = 4, each group). Multiple microaneurysms (yellow arrowheads) but no vertical branch and deep vascular plexus are observed in Yap/TaziΔEC mice. Scale bars: 100 μm. (H and I) Images and comparisons of TER119+ rbc leakage, F4/80+ macrophage infiltration, PDGFRβ+ pericyte coverage onto CD31+ vessels, level of PLVAP on CD31+ vessels, and distributions of VE-cadherin, ZO1, and claudin-5 on CD31+ vessels in retinas of WT and Yap/TaziΔEC mice (n = 4, each group). Scale bars: 100 μm. Error bars represent mean ± SD. *P < 0.05 vs. WT by Mann-Whitney U test.
Figure 4
Figure 4. Endothelial Yap/Taz deletion leads to sustained and severe impairment of BRB and vision.
(A) Diagram depicting the experiment schedule for EC-specific deletion of Yap/Taz in retinal vessels from P2 and their analyses at P21 in Yap/TaziΔEC mice. (B and C) Images of CD31+ vessels in superficial and deep layers of retinas and comparisons of indicated parameters in WT (W) and Yap/TaziΔEC (YT) mice (n = 4, each group). Scale bars: 500 μm. (D) Electroretinography in WT and Yap/TaziΔEC mice. Normal electroretinographic responses as shown by photopic B wave and scotopic a- and b- waves in WT mice (black line) are hardly detected in Yap/TaziΔEC mice (red line). Arrows, flash stimuli. Scale bars (green): 40 ms (x) and 40 μV (y) for photopic electroretinography; 40 ms (x) and 160 μV (y) for scotopic electroretinography. (E) Comparisons of amplitude of photopic b-wave and scotopic a- and b- waves in WT and Yap/TaziΔEC mice (n = 4, each group). Error bars represent mean ± SD. *P < 0.05 vs. WT by Mann-Whitney U test.
Figure 5
Figure 5. Endothelial Yap/Taz deletion leads to extensive and multifocal brain hemorrhage.
(A) Diagram depicting the experiment schedule for Yap/Taz deletion in brain ECs from P2 and their analyses at P12 in Yap/TaziΔEC mice. (B and C) Images of whole and sectioned brains. Severe hemorrhage is detected in cerebral striatum and nuclei, and cerebellum (arrows). (D) H&E staining of brain sections at indicated areas. Brain hemorrhage (arrows) is detected in Yap/TaziΔEC mice. Scale bars: 100 μm. (E and F) Images of whole and sectioned brains and comparison of Evans blue (EB) leakage in brains after EB injection in WT and Yap/TaziΔEC mice (n = 4, each group). (G and H) Images and comparisons of TER119+ rbc leakage and F4/80+ macrophage infiltration in cerebral striatum of WT and Yap/TaziΔEC mice (n = 5, each group). Scale bars: 100 μm. (I and J) Images and comparisons of FITC-conjugated dextran (70 kDa) leakage in the indicated areas of WT and Yap/TaziΔEC brains (n = 5, each group). Scale bars: 100 μm. Error bars represent mean ± SD. *P < 0.05 vs. WT by Mann-Whitney U test.
Figure 6
Figure 6. Endothelial YAP/TAZ is required for vascular network formation in brain.
(A) Diagram for EC-specific deletion of Yap/Taz in brain vessels from P2 and their analyses at P12 in Yap/TaziΔEC mice. (B and C) Images of CD31+ vessels of cerebral cortex and striatum, and comparisons of indicated parameters in WT and Yap/TaziΔEC mice (n = 5, each group). The yellow dashed line demarcates the border between cortex and striatum. Scale bars: 500 μm. (D and E) Magnified images of tip ECs and comparisons of indicated parameters in WT and Yap/TaziΔEC mice (n = 5, each group). Tip ECs of Yap/TaziΔEC mice exhibit an aneurysm-like structure with less and dysmorphic filopodia (white arrowheads). Scale bars: 25 μm. (F and G) Images and comparisons of levels of glucose transporter 1 (GLUT1), transferrin receptor (TfR), PLVAP, and PDGFRβ+ pericyte coverage onto CD31+ vessels in cerebral striatum of WT and Yap/TaziΔEC mice (n = 5, each group). Scale bars: 50 μm. (H) Diagram for EC-specific deletion of Yap/Taz from P2 and sampling of brain ECs and their analyses at P8 in Yap/TaziΔEC mice. (I) GSEA of isolated brain ECs showing downregulation of YAP signature genes in Yap/TaziΔEC compared with those in WT mice, and correspondent heatmaps of the top 15 enriched genes. ES, enrichment score; NES, normalized enrichment score. Error bars represent mean ± SD. *P < 0.05 vs. WT by Mann-Whitney U test.
Figure 7
Figure 7. Endothelial YAP/TAZ is indispensable for BBB maturation.
(A) Diagram for EC-specific deletion of Yap/Taz in brain vessels from P2 and their analyses at P12 in Yap/TaziΔEC mice. (B and C) Images and comparisons of distributions of VE-cadherin, ZO1, and claudin-5 on CD31+ vessels in cerebral striatum of WT and Yap/TaziΔEC mice (n = 5, each group). Scale bars: 50 μm. (D) Electron microscopic images showing electron-dense and continuous junction between brain ECs in WT mice (arrows), while junction between ECs is disrupted and less electron-dense in Yap/TaziΔEC mice (arrowheads). Scale bars: 1 μm. (E and F) Images and comparisons of levels of COL4, laminin, nidogen, and perlecan on CD31+ vessels in cerebral striatum of WT and Yap/TaziΔEC mice (n = 5, each group). Scale bars: 50 μm. (G) Comparisons of expressions of indicated mRNA in brains of WT and Yap/TaziΔEC mice (n = 4, each group). (H) GSEA showing downregulated GO terms “cell junction assembly” and “extracellular structure organization” in brain ECs of Yap/TaziΔEC mice compared with those of WT mice. ES, enrichment score; NES, normalized enrichment score. Error bars represent mean ± SD. *P < 0.05 vs. WT by Mann-Whitney U test.
Figure 8
Figure 8. VEGF upregulates YAP/TAZ transcriptional activity in ECs.
(A and B) Images and quantification of the nuclear enrichment of YAP in HUVECs stimulated with VEGF (50 ng/ml) for 30 minutes (n = 4, each group). Scale bars: 20 μm. (C and D) Immunoblot analyses and comparisons of indicated proteins in HUVECs stimulated with VEGF (50 ng/ml) for indicated times (n = 3, each group). Note that, upon VEGFR2 activation, the level of pLATS1 (Thr1079) is reduced after 5 minutes, and reduction in pYAP (Ser127) level follows after 30 minutes. (E) Quantitative PCR analysis of CTGF and CYR61 mRNA levels in HUVECs stimulated with VEGF for 1 hour (n = 4, each group). (F) GSEA of the microarray data (GSE18913) showing upregulation of YAP signature genes in HUVECs stimulated with VEGF for 1 hour compared with control. ES, enrichment score; NES, normalized enrichment score. Error bars and dots represent mean ± SD. *P < 0.05 vs. control or 0 minutes by Mann-Whitney U test.
Figure 9
Figure 9. YAP/TAZ depletion impairs EC migration and filopodia/lamellipodia formation by suppressing CDC42 and MLC2 activity.
(A and B) Images and comparison of wound healing migration in HUVECs transfected with siCont (siCont-ECs) or siYAP/TAZ (siYAP/TAZ-ECs) (n = 4, each group). Scale bars: 500 μm. (C and D) Images of phalloidin+ actin cytoskeleton and comparisons of indicated parameters in siCont-ECs and siYAP/TAZ-ECs after VEGF stimulation for 30 minutes (n = 4, each group). Scale bars: 20 μm. (E) Immunoblot analyses of indicated proteins in siCont-ECs and siYAP/TAZ-ECs stimulated with VEGF for indicated times. Similar findings were observed in 3 independent experiments. (F) Comparisons of activities of RhoA, Rac1, and CDC42 in siCont-ECs and siYAP/TAZ-ECs stimulated with VEGF for 30 minutes (n = 4, each group). Note that siYAP/TAZ-ECs show markedly attenuated CDC42 activity. (G and H) Immunoblot analyses and comparisons of indicated proteins in siCont-ECs and siYAP/TAZ-ECs (n = 3, each group). Note that siYAP/TAZ-ECs show selectively reduced protein level of CDC42. (I) Immunoblot analyses and comparisons of indicated proteins in siCont-ECs and siYAP/TAZ-ECs (siY/T) (n = 3–4, each group). Numbers indicate mean ± SD. Note that siYAP/TAZ-ECs show significantly reduced MLC2, a key regulator of contractile force. (J and K) Images and comparison of pMLC2 (at Ser19) in CD31+ retinal vessels at P5 in WT and Yap/TaziΔEC mice (n = 4, each group). Scale bars: 100 μm. (L) GSEA of isolated brain ECs showing downregulated GO term “regulation of actin filament based movement” in Yap/TaziΔEC mice compared with WT mice. ES, enrichment score; NES, normalized enrichment score. Error bars represent mean ± SD. *P < 0.05 vs. siCont or WT mice by Mann-Whitney U test.
Figure 10
Figure 10. YAP/TAZ positively regulates proliferation and metabolic activity of ECs through MYC signaling.
(A and B) Growth and cell cycle analysis of HUVECs transfected with siCont (siCont-ECs) or siYAP/TAZ (siYAP/TAZ-ECs) (n = 4, each group). (C and D) Comparisons of extracellular acidification rate (ECAR) of siCont-ECs (siC) and siYAP/TAZ-ECs (siYT) under basal conditions and in response to glucose, oligomycin (Oligo), and 2-deoxy-d-glucose (2-DG) (n = 5, each group). (E and F) Comparisons of oxygen consumption rate (OCR) of siCont-ECs and siYAP/TAZ-ECs under basal conditions and in response to oligo, fluoro-carbonyl cyanide phenylhydrazone (FCCP), and antimycin A (AA)/rotenone (R) (n = 5, each group). (G) GSEA of isolated brain ECs showing downregulations of E2F target, glycolysis, and oxidative phosphorylation signature genes in Yap/TaziΔEC compared with WT mice. ES, enrichment score; NES, normalized enrichment score. (H) Heatmap of MYC signature genes of brain ECs sorted from WT and Yap/TaziΔEC mice. (I and J) Quantitative PCR (n = 4, each group) and immunoblot analysis of MYC expression in siCont-ECs and siYAP/TAZ-ECs. Error bars represent mean ± SD. *P < 0.05 vs. siCont by Mann-Whitney U test.
Figure 11
Figure 11. Endothelial YAP/TAZ is required for pathological angiogenesis, but dispensable for the maintenance of barrier integrity during adulthood.
(A) Diagram for EC-specific deletion of Yap/Taz in retinal and brain vessels of 8-week-old mice and their analyses after 4 weeks in Yap/TaziΔEC mice. (B and C) Images of CD31+ retinal vessels and comparisons of indicated parameters in WT and Yap/TaziΔEC mice (n = 4, each group). Scale bars: 500 μm, top panels; 100 μm, bottom panels. (D) Images of whole and sectioned brains from WT and Yap/TaziΔEC mice. No visible hemorrhage or EB leakage is detected in both mice. (E and F) Images and comparisons of levels of GLUT1, TfR, PLVAP, and PDGFRβ+ pericyte coverage onto CD31+ vessels in cerebral striatum of WT and Yap/TaziΔEC mice (n = 5, each group). Scale bars: 50 μm. (G) Diagram for EC-specific deletion of Yap/Taz in retinal vessels of 8-week-old mice, generation of choroidal neovascularization (CNV) 4 weeks later, and their analyses at 2 weeks after laser photocoagulation in Yap/TaziΔEC mice. (H) Images of late-phase fluorescein angiography (FA) for detecting vascular leakage surrounding the site of laser injury, and indocyanine green angiography (ICGA) and CD31 staining of retinal pigment epithelium–choroid–sclera flat mounts for quantifying the extent of CNV in WT and Yap/TaziΔEC mice. Scale bars: 100 μm. (I) Comparisons of CNV volumes calculated by total measurements of CD31+ CNV volume, and leaky areas from CNV calculated as total measured hyperfluorescent areas in FA images divided by total measured CNV areas in ICGA images, in WT and Yap/TaziΔEC mice (n = 5, each group). Error bars represent mean ± SD. *P < 0.05 vs. WT by Mann-Whitney U test.
Figure 12
Figure 12. Schematic diagram depicting the roles of YAP/TAZ in sprouting angiogenesis and vascular barrier maturation.
In response to VEGF, YAP/TAZ binds to TEAD family transcriptional factors, and positively controls activity of Cdc42 and MLC2 for actomyosin contractility, which are essential for filopodia formation and cell migration in tip ECs. Simultaneously, YAP/TAZ upholds expression and activity of MYC signaling, which is a key driver of EC metabolism and growth, thereby promoting cell proliferation in stalk ECs and maturation in barrier ECs forming the BBB. Along with angiogenic sprouting, YAP/TAZ also promotes formation and maturation of vascular barrier by upregulating expressions of junctional molecules and ECM components.

References

    1. Potente M, Gerhardt H, Carmeliet P. Basic and therapeutic aspects of angiogenesis. Cell. 2011;146(6):873–887. doi: 10.1016/j.cell.2011.08.039. - DOI - PubMed
    1. Chung AS, Ferrara N. Developmental and pathological angiogenesis. Annu Rev Cell Dev Biol. 2011;27:563–584. doi: 10.1146/annurev-cellbio-092910-154002. - DOI - PubMed
    1. Blanco R, Gerhardt H. VEGF and Notch in tip and stalk cell selection. Cold Spring Harb Perspect Med. 2013;3(1):a006569. - PMC - PubMed
    1. Geudens I, Gerhardt H. Coordinating cell behaviour during blood vessel formation. Development. 2011;138(21):4569–4583. doi: 10.1242/dev.062323. - DOI - PubMed
    1. Eilken HM, Adams RH. Dynamics of endothelial cell behavior in sprouting angiogenesis. Curr Opin Cell Biol. 2010;22(5):617–625. doi: 10.1016/j.ceb.2010.08.010. - DOI - PubMed

MeSH terms

Substances