. 2017 Oct;13(10):1081-1087.
doi: 10.1038/nchembio.2453. Epub 2017 Aug 7.

Bisphosphoglycerate mutase controls serine pathway flux via 3-phosphoglycerate

Affiliations

Bisphosphoglycerate mutase controls serine pathway flux via 3-phosphoglycerate

Rob C Oslund et al. Nat Chem Biol. 2017 Oct.

Abstract

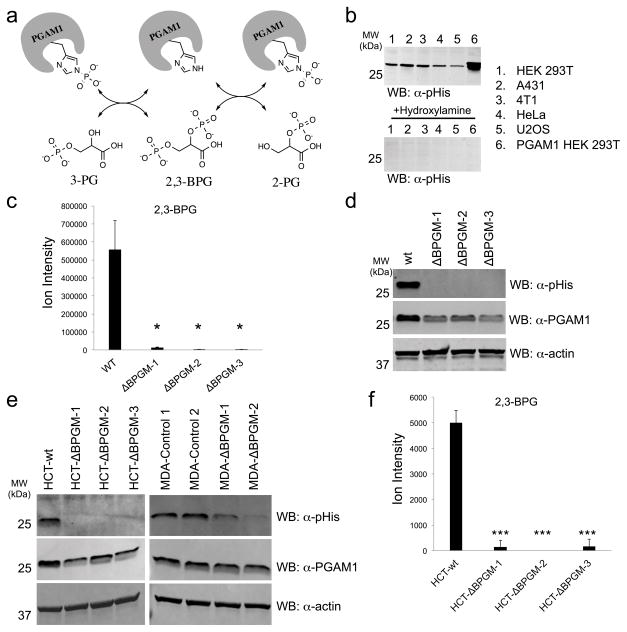
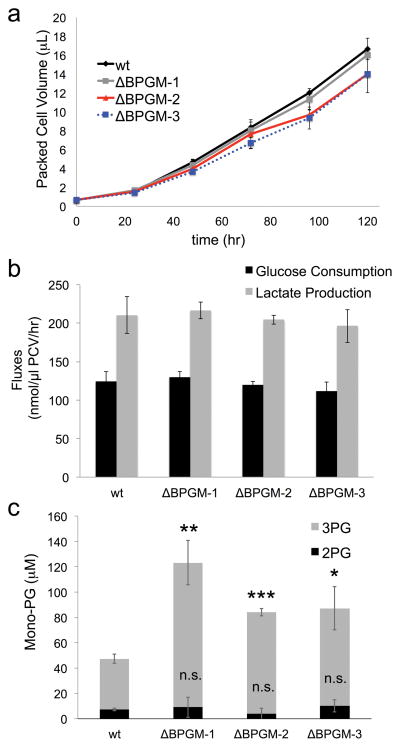
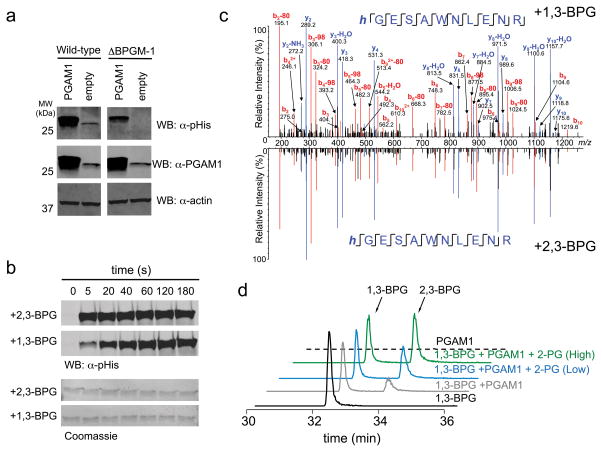
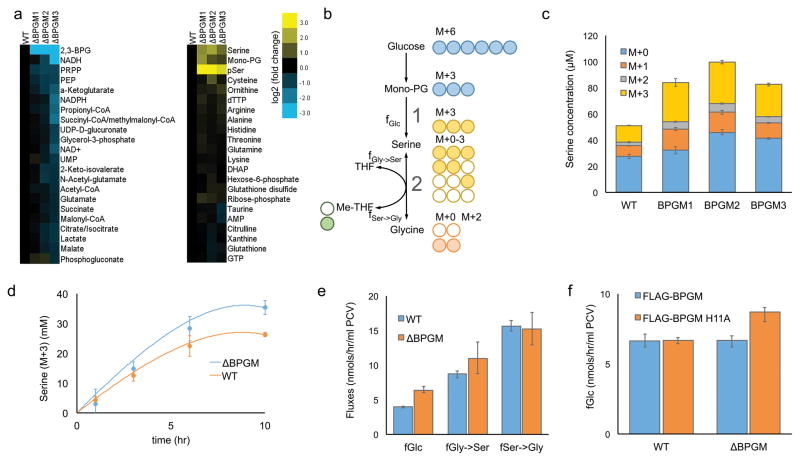
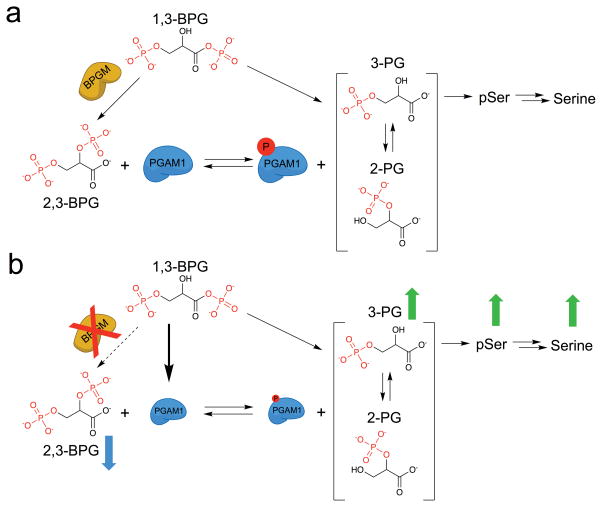
Lower glycolysis involves a series of reversible reactions, which interconvert intermediates that also feed anabolic pathways. 3-phosphoglycerate (3-PG) is an abundant lower glycolytic intermediate that feeds serine biosynthesis via the enzyme phosphoglycerate dehydrogenase, which is genomically amplified in several cancers. Phosphoglycerate mutase 1 (PGAM1) catalyzes the isomerization of 3-PG into the downstream glycolytic intermediate 2-phosphoglycerate (2-PG). PGAM1 needs to be histidine phosphorylated to become catalytically active. We show that the primary PGAM1 histidine phosphate donor is 2,3-bisphosphoglycerate (2,3-BPG), which is made from the glycolytic intermediate 1,3-bisphosphoglycerate (1,3-BPG) by bisphosphoglycerate mutase (BPGM). When BPGM is knocked out, 1,3-BPG can directly phosphorylate PGAM1. In this case, PGAM1 phosphorylation and activity are decreased, but nevertheless sufficient to maintain normal glycolytic flux and cellular growth rate. 3-PG, however, accumulates, leading to increased serine synthesis. Thus, one biological function of BPGM is controlling glycolytic intermediate levels and thereby serine biosynthetic flux.


Conflict of interest statement

Competing financial interests

The authors declare no competing financial interests.

Figures

Figure 1
Figure 1. BPGM deletion diminishes cellular 2,3-BPG and PGAM1 phosphorylation
a) Schematic depicting phosphoryl-transfer step between 3-PG, 2-PG and PGAM1. b) Western blot analysis of different mammalian cell lysates using an α-pHis antibody. Top panel shows untreated lysates and bottom panel shows lysates treated with hydroxylamine prior to Western blot analysis (see Supplementary Fig. 6 for Coomassie stain loading control). c) LC-MS analysis of 2,3-BPG levels in wt and BPGM knockout HEK 293T cells (n = 3, mean ± s.d., * = p<0.05). d) Western blot analysis of wt and BPGM knockout HEK 293T cells using an α–pHis or α–PGAM1 antibody (α–actin antibody was used as a loading control). e) Western blot analysis of wt and BPGM knockout HCT116 or MDA-MB-231 cells using an α–pHis or α–PGAM1 antibody (α–actin antibody was used as a loading control). f) LC-MS analysis of 2,3-BPG levels in wt and BPGM knockout HCT116 cells (n = 3, mean ± s.d., *** = p<0.001). See Supplementary Figure 23 for full Western blot images.
Figure 2
Figure 2. BPGM deletion does not affect cell growth nor glycolytic flux
a) Cell growth rates for wt and BPGM deficient HEK 293T cells (ΔBPGM-1, ΔBPGM-2, ΔBPGM-3) were determined by measuring packed cell volumes (PCV) over the indicated time course (n = 3, mean ± s.d.). b) Media glucose and lactate were measured at t = 24 hours for wt and BPGM deficient HEK 293T cells (ΔBPGM-1, ΔBPGM-2, ΔBPGM-3) and the consumption and production fluxes were calculated and plotted (n = 3, mean ± s.d.). c) 3-PG and 2-PG metabolite levels were quantified in wt and BPGM deficient HEK 293T cells (ΔBPGM-1, ΔBPGM-2, ΔBPGM-3) based on differences in MS/MS-based fragmentation patterns. (n = 3, mean ± s.d., * = p<0.05, ** = p<0.01, *** = p<0.001, n.s. = no significance).
Figure 3
Figure 3. 1,3-BPG is an alternative source of PGAM1 phosphorylation
a) Western blot analysis of PGAM1 overexpression lysates from wt and BPGM knockout HEK 293T cell lysates using an α–pHis and α–PGAM1 antibody (α–actin antibody was used as a loading control). b) Western blot analysis of a PGAM1 phosphorylation time course in the presence of 2,3-BPG or 1,3-BPG (membranes were stained with Coomassie to serve as a loading control). c) 1,3-BPG-treated PGAM1 was subjected to trypsinization and LC-MS analysis. Shown is the MS/MS spectrum of the tryptic peptide of PGAM1 containing the pHis site (His-11) and in mirror image is shown the MS/MS spectrum of 2,3-BPG induced phosphorylation of PGAM1 to demonstrate that both 1,3-BPG and 2,3-BPG result in His-11 phosphorylation. d) LC-MS analysis of PGAM1 phosphorylation with 1,3-BPG in the absence of 2-PG, low 2-PG (50 μM), or high 2-PG (1000 μM). Extracted ion chromatograms for 1,3-BPG and 2,3-BPG (m/z=264.952) are shown for each of the described reaction conditions. See Supplementary Figure 24 for full Western blot images.
Figure 4
Figure 4. BPGM deletion results in higher serine de novo synthesis flux
a) Heat map of metabolite levels measured by LC-MS in wt and BPGM deficient HEK 293T cells. Yellow and blue color scale indicates the changes to metabolite levels. b) Cellular serine production pathways. 13C6-glucose makes M+3 serine through fGlc (pathway 1). M+3 serine makes M+2 glycine and M+1 Me-THF through fSer→Gly (pathway 2). This same flux makes M+0 glycine and M+0 Me-THF from M+0 serine in DMEM. The M+0 and M+2 glycine plus M+0 and M+1 Me-THF makes Serine M+0−M+3 through fGly→Ser. c) A bar graph measuring the media serine concentration at t = 24 hours of each labeled fraction is plotted for wt and BPGM deficient HEK 293T cells (n = 3, mean ± s.d.). d) M+3 serine concentrations measured at different time points over 10 hours are plotted for wt (orange dots) and BPGM deficient (blue dots) HEK 293T cells. Based on the fluxes calculated from the 10 h time points only, the model predictions of M+3 serine concentration are plotted as single lines for wt (orange) and BPGM deficient (blue) HEK 293T cells. Error bars represent 95% CI (n=3). e) Serine and glycine biosynthetic fluxes in wt and BPGM deficient HEK 293T cells. Error bars represent 95% CI (n=3). f) Bar graph indicating the serine de novo synthesis flux from glucose (fGlc) for wt and BPGM deficient HEK 293T cells overexpressing active BPGM or catalytically inactive BPGM (H11A). Error bars represent 95% CI (n=3).
Figure 5
Figure 5. Effect of BPGM disruption on lower glycolysis
a) BPGM activity converts 1,3-BPG to 2,3-BPG for activation of PGAM1 via histidine phosphorylation. b) Upon BPGM disruption, 2,3-BPG levels and PGAM1 protein and phosphorylation levels decrease without impacting overall glycolysis likely because of 1,3-BPG mediated phosphorylation of PGAM1. Furthermore, as a result of decreased PGAM1 protein and phosphorylation levels, 3-PG, phosphoserine, and serine metabolite levels increase.

References

    1. Vander Heiden MG, Cantley LC, Thompson CB. Understanding the Warburg effect: the metabolic requirements of cell proliferation. Science. 2009;324:1029–33. - PMC - PubMed
    1. Hitosugi T, et al. Phosphoglycerate mutase 1 coordinates glycolysis and biosynthesis to promote tumor growth. Cancer Cell. 2012;22:585–600. - PMC - PubMed
    1. Possemato R, et al. Functional genomics reveal that the serine synthesis pathway is essential in breast cancer. Nature. 2011;476:346–50. - PMC - PubMed
    1. Labuschagne CF, van den Broek NJ, Mackay GM, Vousden KH, Maddocks OD. Serine, but not glycine, supports one-carbon metabolism and proliferation of cancer cells. Cell Rep. 2014;7:1248–58. - PubMed
    1. Mattaini KR, et al. An epitope tag alters phosphoglycerate dehydrogenase structure and impairs ability to support cell proliferation. Cancer Metab. 2015;3:5. - PMC - PubMed

MeSH terms