. 2017 Oct;18(10):1117-1127.
doi: 10.1038/ni.3816. Epub 2017 Aug 14.

T-bet-dependent NKp46+ innate lymphoid cells regulate the onset of TH17-induced neuroinflammation

Affiliations

T-bet-dependent NKp46+ innate lymphoid cells regulate the onset of TH17-induced neuroinflammation

Brandon Kwong et al. Nat Immunol. 2017 Oct.

Erratum in

Abstract

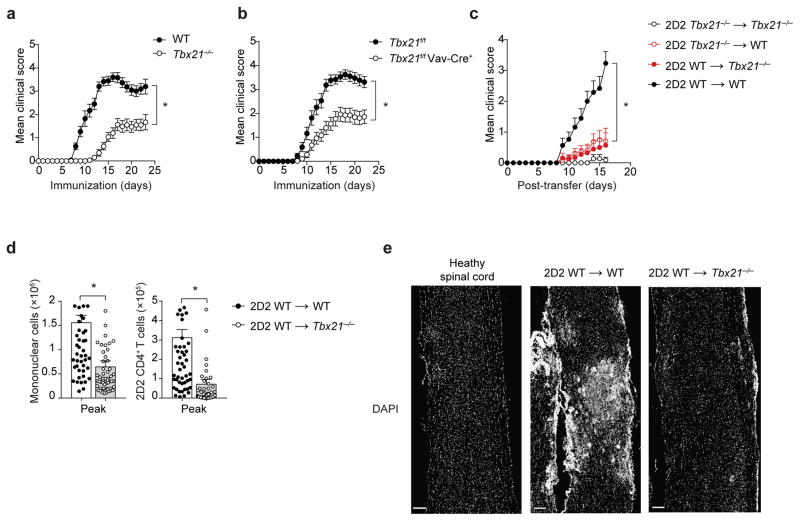
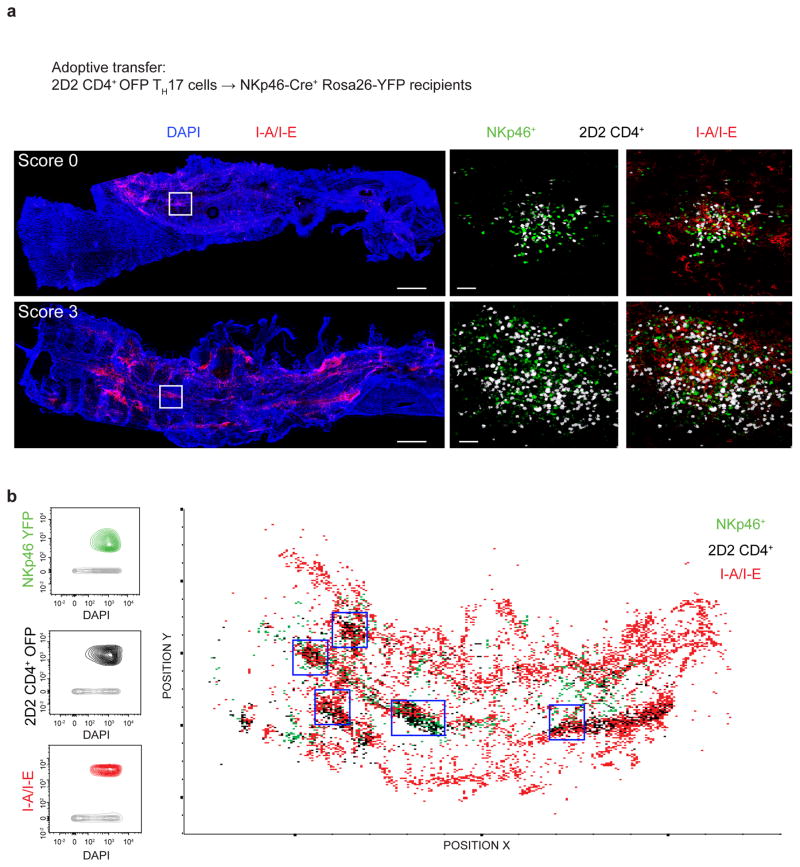
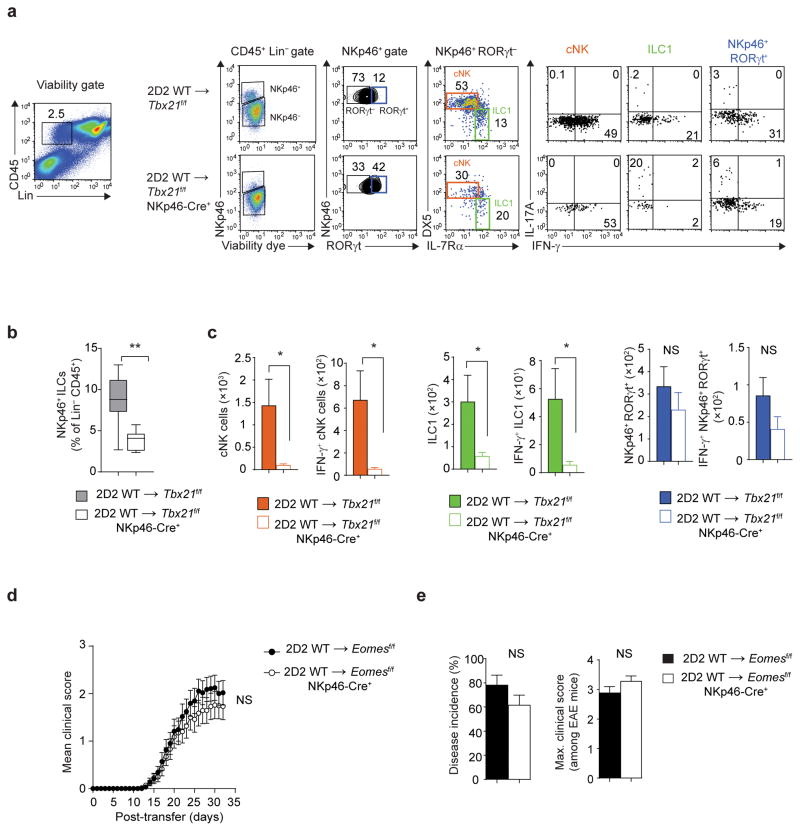
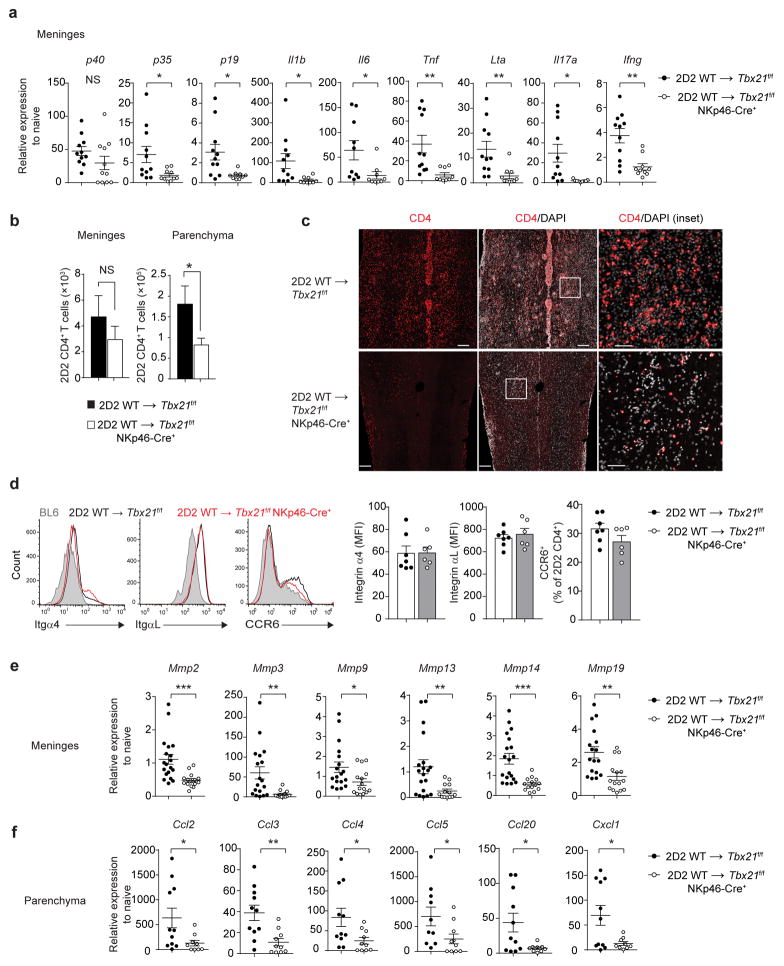
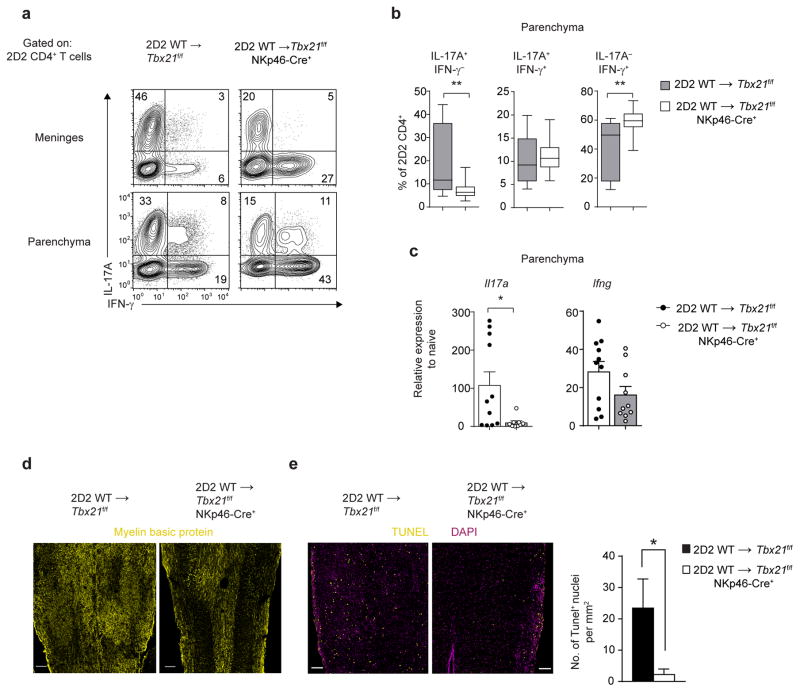
The transcription factor T-bet has been associated with increased susceptibility to systemic and organ-specific autoimmunity, but the mechanism by which T-bet expression promotes neuroinflammation remains unknown. In this study, we demonstrate a cardinal role of T-bet-dependent NKp46+ innate lymphoid cells (ILCs) in the initiation of CD4+ TH17-mediated neuroinflammation. Loss of T-bet specifically in NKp46+ ILCs profoundly impaired the ability of myelin-reactive TH17 cells to invade central nervous system (CNS) tissue and protected the mice from autoimmunity. T-bet-dependent NKp46+ ILCs localized in the meninges and acted as chief coordinators of meningeal inflammation by inducing the expression of proinflammatory cytokines, chemokines and matrix metalloproteinases, which together facilitated T cell entry into CNS parenchyma. Our findings uncover a detrimental role of T-bet-dependent NKp46+ ILCs in the development of CNS autoimmune disease.


Conflict of interest statement

COMPETING FINANCIAL INTERESTS

The authors declare no competing financial interests.

Figures

Figure 1
Figure 1
T-bet expression in T cells is insufficient to cause EAE. (a–b) Mean clinical scores in wild-type (WT) versus Tbx21−/− mice (a), or Tbx21f/f versus Tbx21f/f Vav-Cre+ mice (b), immunized with MOG35-55/CFA and pertussis toxin. (c) Mean clinical scores in Tbx21−/− or WT mice receiving 5 × 10⁶ 2D2 Tbx21−/− or 2D2 WT TH17 cells. (d) Enumeration of total CNS-infiltrating mononuclear cells or CNS-infiltrating 2D2 CD4+ T cells (CD4+Vβ11+) at the peak of EAE disease (day 15–17 post-transfer), in Tbx21−/− or WT recipients of 2D2 WT TH17 cells (5–7.5 × 10⁶), analyzed by flow cytometry. (e) DAPI staining of spinal cord longitudinal sections from a naïve healthy mouse or Tbx21−/− or WT recipients of 2D2 WT TH17 cells (7.5 × 10⁶). Scale bar, 200 μm. *, P < 0.0001 (two-way ANOVA (a–c) or two-tailed Student’s t-test (d)). Data are combined from three independent experiments (a; mean ± s.e.m. of n = 30 mice per group), four independent experiments (b; mean ± s.e.m. of n = 28 mice per group), five independent experiments (c; mean ± s.e.m. of n = 15 – 20 mice per group) and 12 independent experiments (d; mean ± s.e.m. of n = 54, 57 mice per group). Histological images are representative of three independent experiments (n = 6, 9 mice per group).
Figure 2
Figure 2
Peripheral licensing of CD4+ TH17 cells in Tbx21−/− host. (a) Time-course analysis quantifying the number of 2D2 CD4+ T cells (CD4+Vβ11+) in the spleens or lungs of Tbx21−/− or WT mice, following adoptive transfer of 7.5 × 10⁶ 2D2 WT TH17 cells. (b) Ki67 intracellular staining of 2D2 CD4+ T cells (CD3+CD4+Vβ11+) trafficking through the spleens or lungs of Tbx21−/− or WT mice five days post-adoptive transfer (n = 5 mice per group). Histograms are overlaid with Ki67 expression in endogenous WT (BL6) CD4+ T cells (shaded). (c) Expression of migratory receptors on 2D2 CD4+ T cells trafficking through the spleens or lungs of Tbx21−/− or WT mice five days post-adoptive transfer. Histograms are overlaid with expression detected on endogenous WT (BL6) CD4+ T cells (shaded). (d) Intracellular cytokine staining of 2D2 CD4+ T cells from the spleens or lungs of Tbx21−/− or WT mice, five days post-adoptive transfer. (e) Intracellular cytokine staining of 2D2 CD4+ T cells from the CNS of Tbx21−/− or WT mice at the peak of EAE disease (day 15–17 post-transfer). *, P < 0.0001 (two-tailed Student’s t-test). Data are representative of two independent experiments (a,d; mean ± s.e.m. of n = 6 mice per group), three independent experiments (c; n = 10 mice per group) or five independent experiments (e; mean ± s.e.m. of n = 27 mice per group).
Figure 3
Figure 3
T-bet-expressing cells in the CNS during EAE. (a) DAPI staining of spinal cord longitudinal sections from T-bet-ZsGreen reporter mice immunized with MOG35-55/CFA and pertussis toxin, harvested at the peak of EAE disease (day 14 post-immunization). Inset images show ZsGreen reporter+ cells in the meninges (m) and central canal (c) of the spinal cord. Scale bar, 50 μm. (b) Flow cytometric analysis of the CNS of WT (BL6) or T-bet ZsGreen reporter mice immunized with MOG35-55/CFA and pertussis toxin. Analysis is gated on total live cells. (c) Analysis of T-bet ZsGreen expression in CNS-infiltrating immune cell populations from T-bet ZsGreen reporter mice immunized with MOG35-55/CFA and pertussis toxin. Immune cell subsets were gated on live CD45+ cells, then further identified as follows: T cells, MHCIICD3+; dendritic cells, CD3MHCII+CD11c+; NK1.1+ innate cells, CD3MHCIINK1.1+; B cells, CD3MHCII+B220+; inflammatory monocytes, CD3CD11b+Ly6ChiLy6G; neutrophils, CD3CD11b+Ly6CintLy6G+. (d) Quantitation by flow cytometry of T-bet-expressing CD45+ immune cells, T cells, dendritic cells or NK1.1+ innate cells from the CNS of T-bet ZsGreen reporter mice immunized with MOG35-55/CFA and pertussis toxin. CNS-infiltrating cells were harvested at the onset (day 7) or peak of EAE disease (day 13–14 post-immunization) and stained for lineage-specific markers as in (c). Data in (b–d) are combined from 2–3 independent experiments, using 5 pooled mice per group per experiment; data are presented as mean ± s.e.m (d). Histological images are representative of 2 independent experiments (n = 4 mice).
Figure 4
Figure 4
T-bet-dependent NKp46+ ILCs initiate TH17-mediated EAE. (a–b) Mean clinical scores of Tbx21−/− and WT mice following the adoptive transfer of 7.5 × 10⁶ 2D2 WT TH17 cells, with anti-NK1.1-mediated depletion (αNK1.1) or PBS control injections performed before and during EAE disease. Detailed description of the anti-NK1.1 (clone PK136) depletion regimen is described in Supplementary Fig. 3. (c) Mean clinical scores of Tbx21f/f or Tbx21f/f NKp46-Cre+ mice following adoptive transfer of 7.5 × 10⁶ 2D2 WT TH17 cells. (d) The disease incidence in each independent experiment (percentage of mice demonstrating EAE symptoms) and the maximum clinical score among EAE symptomatic mice only. NS, P > 0.05; *, P < 0.01; ** P < 0.0001 (two-way ANOVA (b,c) or two-tailed Student’s t-test (d)). Data are representative of 2 independent experiments (a; mean ± s.e.m. of n = 12 mice per group), four independent experiments (b; mean ± s.e.m. of n = 25, 27 mice per group) and 8 independent experiments (c,d; mean ± s.e.m. of n = 37, 49 mice per group).
Figure 5
Figure 5
Localization of T-bet-dependent NKp46+ ILCs during EAE. (a) A total of 7.5 × 10⁶ 2D2 CD4+ OFP+ TH17 cells were adoptively transferred into NKp46+ reporter mice (NKp46-Cre+ Rosa26-loxP-STOP-loxP-YFP). Spinal cord meninges were isolated from NKp46+ reporter mice before the onset of symptoms (score 0) and during the peak of disease (score 3) and stained with DAPI and anti-MHCII (I-A/I-E). Inset images show clusters of NKp46+ (green) and 2D2 CD4+ T cells (white), without (left) and with (right) MHCII (I-A/I-E) staining. Scale bars, 500 mm for main images or 40 μm for insets. (b) Spots statistics from the whole mount shown in (a) (score 3) were exported and plotted for identification of distinct immune subsets. NKp46-YFP+, 2D2 CD4+ OFP and I-A/I-E voxel gating allowed identification and spatial visualization of the NKp46+ ILCs, 2D2 CD4+ T cells and MHCII-expressing APCs, respectively, by histo-cytometry (as described in Methods). Histological analysis is representative of 2 independent experiments (n = 3 mice for score 0 and n = 4 mice for score 3).
Figure 6
Figure 6
Pathogenic function of T-bet maps to ILC1/NKp46+ ILC3. (a) Flow cytometry analysis of meningeal immune cells following adoptive transfer of 7.5 × 10⁶ 2D2 WT TH17 cells into Tbx21f/f or Tbx21f/f NKp46-Cre+ mice. Cells were stimulated with PMA and ionomycin for 3 h in the presence of monensin in the last 1.5 h of stimulation. Stimulated cells were stained with viability dye, antibodies to lineage markers (TCRβ, TCRγδ, B220, Gr1) and anti-CD45, anti-NKp46, anti-IL-7Rα, anti-CD49b (DX5), anti-RORγt, anti-IL-17A and anti-IFN-γ. Production of IL-17A and IFN-γ by meningeal NK cells (gated on LinCD45+NKp46+RORγtDX5+IL-7Rα), ILC1 (gated on LinCD45+NKp46+RORγtDX5−/loIL-7Rα+) and NKp46+ ILC3 (gated on LinCD45+NKp46+RORγt+IL-7Rα+) was measured by intracellular cytokine staining. (b) The box-and-whiskers plot depict the frequency of NKp46+ ILCs within LinCD45+ population in the meninges of Tbx21f/f or Tbx21f/f NKp46-Cre+ mice. (c) Absolute numbers of NK cells, ILC1 and NKp46+ ILC3 and IFN-γ-producing NK cells, ILC1 and NKp46+ ILC3 (gated as in a) in the meninges of Tbx21f/f or Tbx21f/f NKp46-Cre+ mice. (d–e) Mean clinical scores, percent disease incidence and maximum clinical score of Eomesf/f or Eomesf/f NKp46-Cre+mice following adoptive transfer of 7.5 × 10⁶ 2D2 WT TH17 cells. NS, P > 0.05; *, P < 0.05; **, P < 0.001 (two-tailed Student’s t-test (b,c,e) or two-way ANOVA (d)). Data are combined from two independent experiments (b,c; n = 9, 10 mice per group) or three independent experiments (d,e; n = 29, 35 mice per group).
Figure 7
Figure 7
NKp46+ ILCs regulate infiltration of CD4+ TH17 cells. (a) Quantitative RT-PCR analysis of genes encoding pro-inflammatory cytokines in the spinal cord meninges of Tbx21f/f or Tbx21f/f NKp46-Cre+ mice following the adoptive transfer of 7.5 × 10⁶ 2D2 WT TH17 cells. Gene expression is presented relative to the housekeeping gene Hprt, and normalized to transcript abundance from naïve WT (BL6) mice. (b) Absolute number of 2D2 CD4+ T cells (CD4+Vβ11+) in the spinal cord meninges and CNS parenchyma of Tbx21f/f or Tbx21f/f NKp46-Cre+ mice as quantitated by flow cytometry. (c) Immunohistological analysis of longitudinal spinal cord sections from Tbx21f/f or Tbx21f/f NKp46-Cre+ mice following the adoptive transfer of 2D2 WT TH17 cells. Tissue sections were stained with DAPI and anti-CD4. Scale bars, 200 μm for main images or 50 μm for insets. (d) Expression of integrins α4, αL and CCR6 on CNS-infiltrating 2D2 CD4+ T cells (day 18–20 post-adoptive transfer). Bar graphs depict the average mean fluorescence intensity (MFI) of α4 and αL staining and mean percentage of CCR6+ 2D2 CD4+ T cells. (e–f) Quantitative RT-PCR analysis of genes encoding matrix metalloproteinases (MMPs) in the spinal cord meninges and chemokines in the spinal cord parenchyma of Tbx21f/f or Tbx21f/f NKp46-Cre+ mice (quantified as in a). *, P < 0.05; **, P < 0.01; ***, P < 0.001 (two-tailed Student’s t-test). Data are combined from two independent experiments (a,f; mean ± s.e.m. of n = 11 mice per group, d; n = 6, 7 mice per group), three independent experiments (e; mean ± s.e.m. of n =15, 19 mice per group) or four independent experiments (b; mean ± s.e.m. of 17 mice per group). Histology images are representative of 2 independent experiments (n = 6 mice per group).
Figure 8
Figure 8
NKp46+ ILCs regulate the stability of CD4+ TH17 cells. (a) Intracellular cytokine staining of 2D2 CD4+ T cells isolated from the meninges and CNS parenchyma of Tbx21f/f or Tbx21f/f NKp46-Cre+ mice following adoptive transfer of 7.5 × 10⁶ 2D2 WT TH17 cells. (b) Box-and-whiskers plots of cytokine producing 2D2 CD4+ T cells isolated from the CNS parenchyma of Tbx21f/f or Tbx21f/f NKp46-Cre+ mice. (c) Quantitative RT-PCR analysis of genes encoding IL-17A and IFN-γ in the CNS parenchyma of Tbx21f/f or Tbx21f/f NKp46-Cre+ mice (quantified as in Fig. 7a). (d–e) Longitudinal spinal cord sections from Tbx21f/f or Tbx21f/f NKp46-Cre+ mice were stained with anti-myelin basic protein antibody. TUNEL staining was performed to quantitate apoptotic cell death in the spinal cord tissue, and results were normalized to the total tissue area analyzed. Scale bars, 200 μm (d) or 100 μm (e). *, P < 0.05; **, P < 0.001 (two-tailed Student’s t-test). Data are representative of 2 independent experiments (meninges) or five independent experiments (parenchyma) (a), or combined from five independent experiments (b; n = 24, 28 mice per group) and 2 independent experiments (c; n = 10, 11 mice per group). Histology images are representative of 2 independent experiments, while TUNEL analysis was performed on 2 sections per mouse, with 3–4 mice per group (d–e).

Comment in

References

    1. McFarland HF, Martin R. Multiple sclerosis: a complicated picture of autoimmunity. Nat Immunol. 2007;8:913–919. - PubMed
    1. Park H, et al. A distinct lineage of CD4 T cells regulates tissue inflammation by producing interleukin 17. Nat Immunol. 2005;6:1133–1141. - PMC - PubMed
    1. Langrish CL, et al. IL-23 drives a pathogenic T cell population that induces autoimmune inflammation. J Exp Med. 2005;201:233–240. - PMC - PubMed
    1. McGeachy MJ, et al. The interleukin 23 receptor is essential for the terminal differentiation of interleukin 17-producing effector T helper cells in vivo. Nat Immunol. 2009;10:314–324. - PMC - PubMed
    1. Cua DJ, et al. Interleukin-23 rather than interleukin-12 is the critical cytokine for autoimmune inflammation of the brain. Nature. 2003;421:744–748. - PubMed

MeSH terms

Substances