. 2017 Oct;49(10):1522-1528.
doi: 10.1038/ng.3935. Epub 2017 Aug 14.

Lineage-specific dynamic and pre-established enhancer-promoter contacts cooperate in terminal differentiation

Affiliations

Lineage-specific dynamic and pre-established enhancer-promoter contacts cooperate in terminal differentiation

Adam J Rubin et al. Nat Genet. 2017 Oct.

Abstract

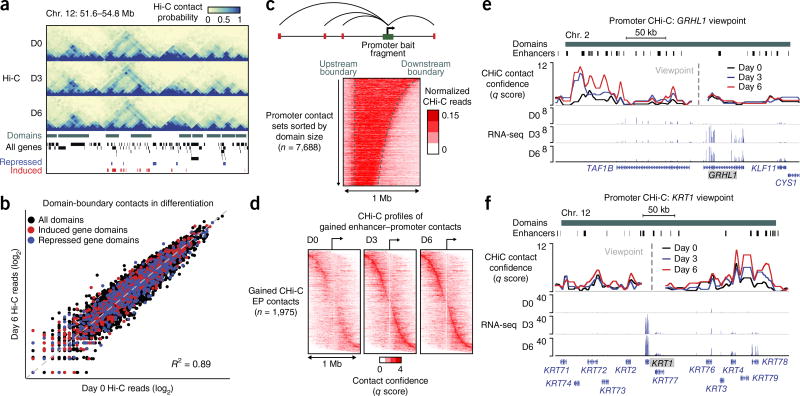
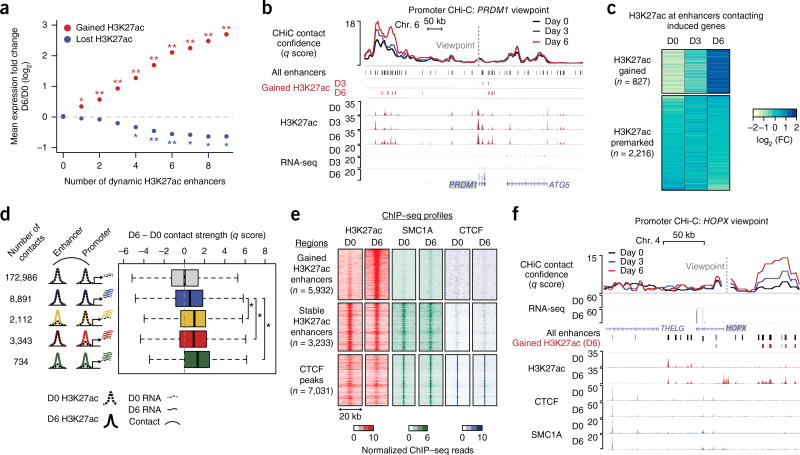
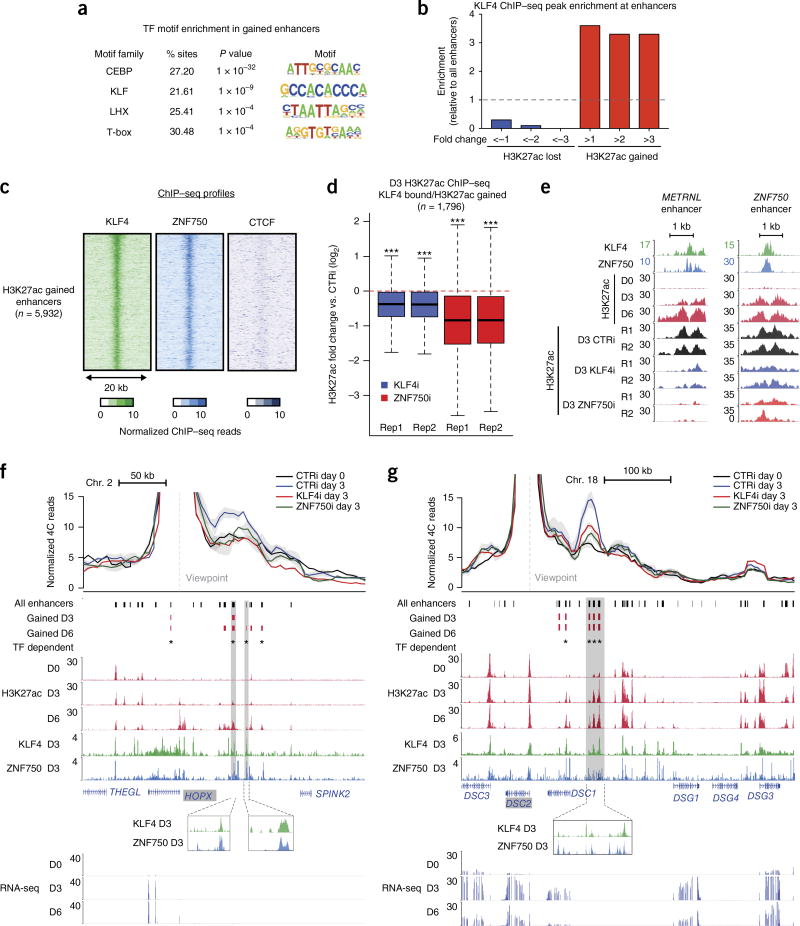
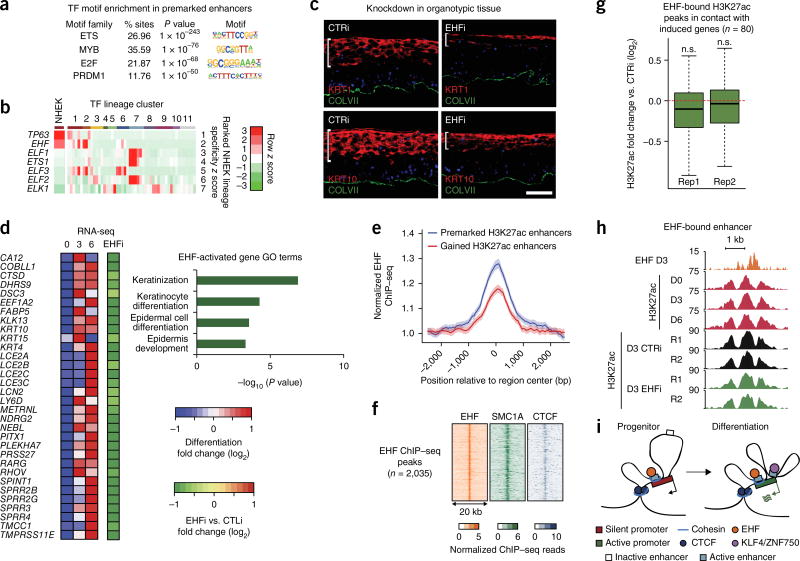
Chromosome conformation is an important feature of metazoan gene regulation; however, enhancer-promoter contact remodeling during cellular differentiation remains poorly understood. To address this, genome-wide promoter capture Hi-C (CHi-C) was performed during epidermal differentiation. Two classes of enhancer-promoter contacts associated with differentiation-induced genes were identified. The first class ('gained') increased in contact strength during differentiation in concert with enhancer acquisition of the H3K27ac activation mark. The second class ('stable') were pre-established in undifferentiated cells, with enhancers constitutively marked by H3K27ac. The stable class was associated with the canonical conformation regulator cohesin, whereas the gained class was not, implying distinct mechanisms of contact formation and regulation. Analysis of stable enhancers identified a new, essential role for a constitutively expressed, lineage-restricted ETS-family transcription factor, EHF, in epidermal differentiation. Furthermore, neither class of contacts was observed in pluripotent cells, suggesting that lineage-specific chromatin structure is established in tissue progenitor cells and is further remodeled in terminal differentiation.


Conflict of interest statement

COMPETING FINANCIAL INTERESTS

The authors declare no competing financial interests.

Figures

Figure 1
Figure 1
Remodeling of the enhancer–promoter contact landscape in terminal differentiation. (a) Genomic locus of keratin-family genes. From top to bottom: Hi-C interaction matrices, self-interacting domains (green), and genes induced (red) or repressed (blue) on day 3 or day 6 of epidermal cell differentiation identified by RNA-seq. (b) Scatterplot of Hi-C read counts supporting contacts between domain boundaries. Contacts enclosing domains containing differentially expressed genes are highlighted. (c) Heat map of CHi-C read count profiles observed for bait HindIII fragments residing within a domain. Each row represents the contact signal from a single promoter, promoters are aligned by distance to the upstream domain boundary, and rows are sorted in order of domain size. (d) Heat maps of CHi-C q scores (determined by CHiCAGO) for 1,975 enhancer contacts gained with target promoters during epidermal cell differentiation. Contacts are sorted in order of enhancer–promoter (EP) distance. (edgeR, FDR < 0.1; fold change > 2). (e,f) Genomic loci for the GRHL1 (e) and KRT1 (f) genes with promoter CHi-C signal. Enhancers correspond to promoter-distal H3K27ac ChIP–seq peaks.
Figure 2
Figure 2
Enhancer activation and contact dynamics are linked independently of cohesin. (a) Mean change in expression for genes in CHi-C contacts with enhancers displaying gained or lost H3K27ac status (empirical FDR, *, FDR < 0.05; **, FDR < 0.01). (b) Genomic locus of the PRDM1 gene, including CHi-C q score and H3K27ac ChIP–seq signal tracks. Gained enhancers correspond to H3K27ac peaks with significant gain in H3K27ac signal on day 3 or day 6 versus day 0 (edgeR, FDR < 0.05; fold change > 2). (c) Heat map of the fold change in H3K27ac ChIP–seq read count. Regions are separated into the set with gained H3K27ac signal on day 6 versus day 0 (edgeR, FDR < 0.05; fold change > 2) and the set with premarked H3K27ac on day 6 versus day 0 (edgeR, FDR > 0.7). (d) Box-and-whisker plots of the difference in contact q score between day 6 and day 0. Contact sets are defined by H3K27ac dynamics at the promoter locus (bait HindIII fragment) or enhancer. Dashed lines denote day 0 for either H3K27ac signal or mRNA expression of differentiation-related genes; solid lines denote corresponding signals for day 6. Each box represents the median and interquartile range; whiskers extend to 1.5 times the interquartile range (empirical FDR, *, FDR < 0.01). (e) Heat maps of H3K27ac, SMC1A, and CTCF ChIP–seq signals at gained enhancers, stable enhancers, and CTCF peaks (stable enhancers and CTCF peaks were restricted to chromosome 1 to approximately match the number of gained enhancer peaks). (f) HOPX locus, including CHi-C q score and ChIP–seq tracks for H3K27ac, CTCF, and SMC1A.
Figure 3
Figure 3
Induced transcription factors couple regulation of chromatin activation and conformation. (a) Enrichment of transcription factor (TF) motifs identified by HOMER in enhancers gained on day 6 versus enhancers lost on day 6. Motifs are ranked by −log10 (P value). (b) Enrichment of day 3 KLF4 ChIP–seq peaks in H3K27ac peak subsets determined by fold change in H3K27ac dynamics on day 3 versus day 0. (c) Heat maps of KLF4, ZNF750, and CTCF ChIP–seq signal on day 3 at enhancers with gained H3K27ac signal. (d) Box-and-whisker plots representing relative H3K27ac ChIP–seq signal in control versus transcription factor–knockdown conditions, for two biological replicates of each knockdown. Regions analyzed were H3K27ac-gained enhancers bound by KLF4. Keratinocytes were treated with siRNAs targeting KLF4 (KLF4i), ZNF750 (ZNF750i), or a scrambled control (CTRi) and placed in differentiation conditions for 3 d. Each box represents the median and interquartile range; whiskers extend to 1.5 times the interquartile range (empirical FDR, ***, FDR < 10 × 10−3). (e) Representative genomic loci depicting the effect of KLF4 or ZNF750 depletion at enhancers. Both loci exhibit significant loss of H3K27ac upon KLF4 or ZNF750 depletion (edgeR, FDR < 0.05). (f) UMI-4C profile of interactions anchored by the HOPX promoter in control and KLF4- or ZNF750-knockdown conditions. Error bands represent s.e.m. between replicates. Vertical shaded boxes represent KLF4- or ZNF750-binding sites coinciding with gained H3K27ac. Gained H3K27ac peaks in normal differentiation that exhibit H3K27ac signal loss in KLF4 or ZNF750 knockdown (edgeR, FDR < 0.05) are flagged as transcription factor dependent. (g) As in f, with the UMI-4C profile anchored by the DSC2 promoter.
Figure 4
Figure 4
The transcription factor EHF associates with premarked H3K27ac elements and is essential for epidermal differentiation. (a) Top enriched transcription factor motifs identified by HOMER in premarked H3K27ac elements in contact with the promoters of differentiation-induced genes. (b) Heat map representing z scores of transcription factor expression values determined by RNA-seq from the Roadmap Epigenomics Project. Each cell corresponds to the average expression z score across the cell type groups identified through hierarchical clustering of all genes. Rows are sorted by the z score in the cluster containing epidermal keratinocytes, and the z scores for epidermal keratinocytes are shown separately in the leftmost column. Cluster IDs are as follows: 1, epithelial; 2, cancer cell line; 3, simple epithelial; 4, extramedullary hematopoietic; 5, muscle; 6, gastrointestinal/hepatic; 7, immune; 8, neural; 9, mesenchymal; 10, embryonic; 11, other. (c) Immunofluorescence microscopy of organotypic epidermis treated with siRNAs targeting EHF (EHFi) or a scrambled control. The white bar highlights the height of the region marked by the differentiation-specific proteins KRT1 and KRT10. Scale bar, 50 µm. (d) Heat map representing mRNA expression of differentiation-induced genes in EHF-depleted organotypic epidermis relative to normal control. GO terms were derived for EHF-dependent genes. (e) EHF ChIP–seq metaplot signal at H3K27-premarked (n = 5,932) and H3K27ac-gained (n = 3,233) putative enhancers. Error bands represent 98% boostrapped confidence intervals. (f) Heat maps of day 3 EHF, SMC1A, and CTCF ChIP–seq profiles at all EHF ChIP–seq peaks. (g) Box-and-whisker plots representing relative H3K27ac ChIP–seq signal at day 3 of differentiation in control versus EHF-knockdown conditions. Each distribution represents a biological replicate. Regions analyzed are H3K27ac peaks bound by EHF and in contact with the promoters of differentiation-induced genes. Each box represents the median and interquartile range; whiskers extend to 1.5 times the interquartile range (empirical FDR, n.s., FDR > 0.05). (h) Representative genomic locus demonstrating the effect of EHF depletion at EHF-bound enhancers. (i) Working model. Induction of differentiation-related genes involves two types of enhancer–promoter interactions that occur within CTCF- and cohesin-bound domains: (i) H3K27ac premarked enhancers, bound by cohesin and by constitutively expressed transcription factors, such as EHF, in stable contact with differentiation-related genes and (ii) enhancers that bind inducible transcription factors, such as KLF4 and ZNF750, to gain H3K27ac marks and increase contact with differentiation-related genes.

References

    1. Mifsud B, et al. Mapping long-range promoter contacts in human cells with high-resolution capture Hi-C. Nat. Genet. 2015;47:598–606. - PubMed
    1. Dixon JR, Gorkin DU, Ren B. Chromatin domains: the unit of chromosome organization. Mol. Cell. 2016;62:668–680. - PMC - PubMed
    1. Dixon JR, et al. Chromatin architecture reorganization during stem cell differentiation. Nature. 2015;518:331–336. - PMC - PubMed
    1. Schoenfelder S, et al. The pluripotent regulatory circuitry connecting promoters to their long-range interacting elements. Genome Res. 2015;25:582–597. - PMC - PubMed
    1. Lopez-Pajares V, et al. A lncRNA–MAF:MAFB transcription factor network regulates epidermal differentiation. Dev. Cell. 2015;32:693–706. - PMC - PubMed

MeSH terms