

Effects of mTOR inhibition on cardiac and adipose tissue pathology and glucose metabolism in rats with metabolic syndrome
- PMID: 28805979
- PMCID: PMC5684863
- DOI: 10.1002/prp2.331
Effects of mTOR inhibition on cardiac and adipose tissue pathology and glucose metabolism in rats with metabolic syndrome
Abstract
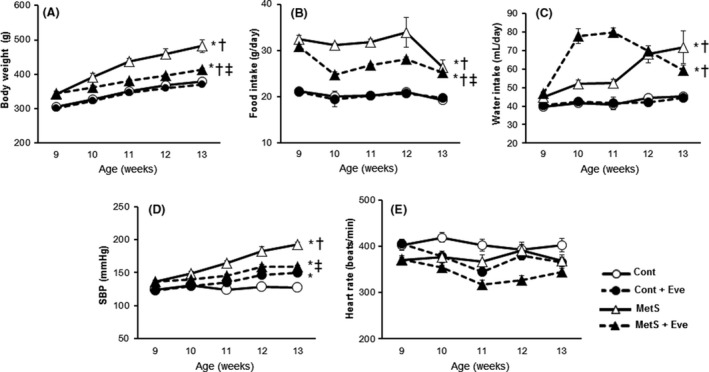
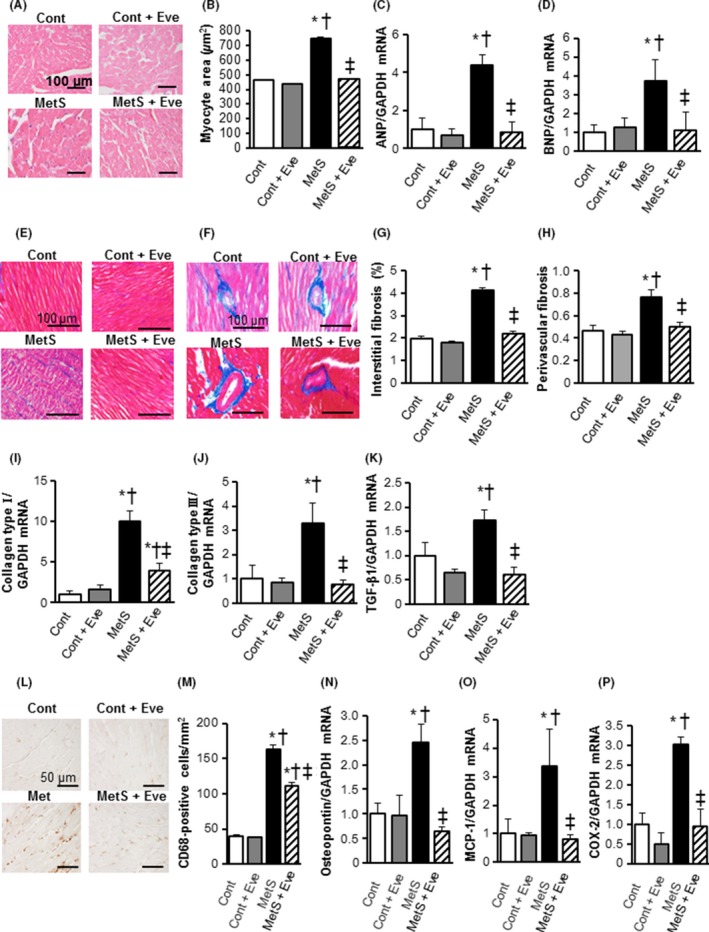
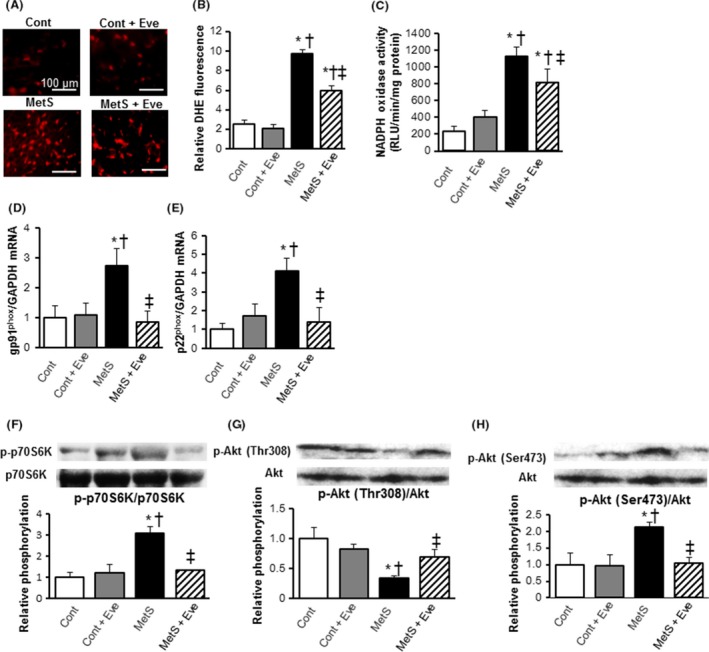
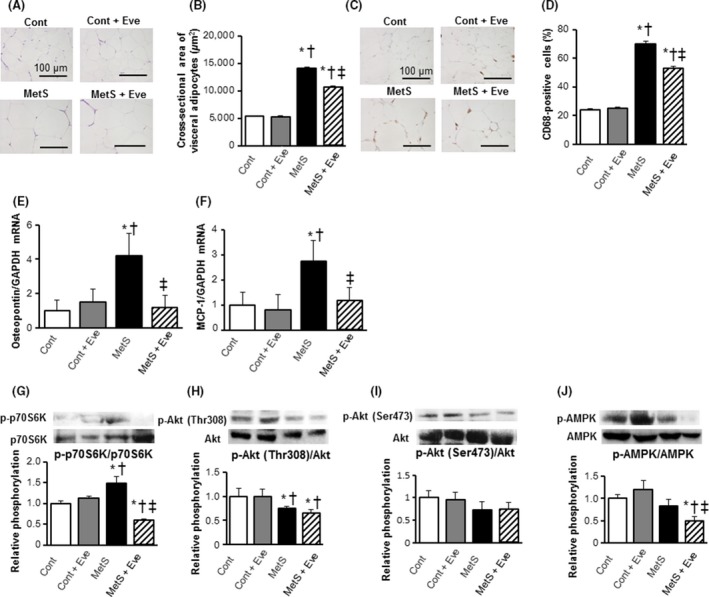
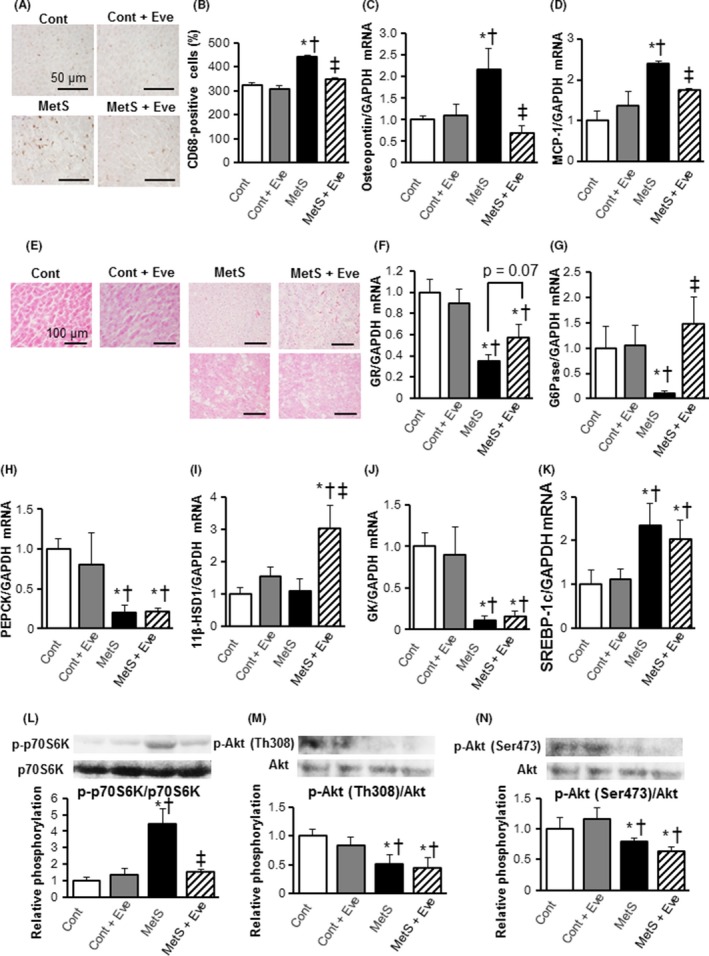
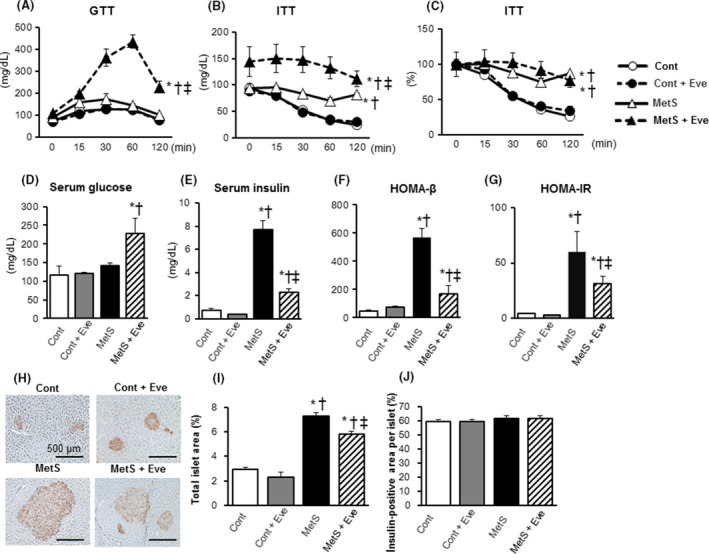
The mammalian target of rapamycin (mTOR) is a regulator of metabolism and is implicated in pathological conditions such as obesity and diabetes. We aimed to investigate the role of mTOR in obesity. A new animal model of metabolic syndrome (MetS), named DahlS.Z-Leprfa /Leprfa (DS/obese) rats was established previously in our laboratory. In this study, we used this model to evaluate the effects of mTOR inhibition on cardiac and adipose tissue pathology and glucose metabolism. DS/obese rats were treated with the mTOR inhibitor, everolimus, (0.83 mg/kg per day, per os) for 4 weeks at 9 weeks of age. Age-matched homozygous lean (DahlS.Z-Lepr+ /Lepr+ or DS/lean) littermates of DS/obese rats were used as controls. Treatment with everolimus ameliorated hypertension, left ventricular (LV) hypertrophy and fibrosis, and LV diastolic dysfunction, and attenuated cardiac oxidative stress and inflammation in DS/obese rats, but had no effect on these parameters in DS/lean rats. Treatment with everolimus reduced Akt Thr308 phosphorylation in the heart of DS/obese rats. It also alleviated obesity, hyperphagia, adipocyte hypertrophy, and adipose tissue inflammation in DS/obese rats. Everolimus treatment exacerbated glucose intolerance, but did not affect Akt phosphorylation levels in the fat or liver in these rats. Pancreatic β-cell mass was increased in DS/obese rats compared with that in DS/lean rats and this effect was attenuated by everolimus. Activation of mTOR signaling contributes to the pathophysiology of MetS and its associated complications. And mTOR inhibition with everolimus ameliorated obesity as well as cardiac and adipose tissue pathology, but exacerbated glucose metabolism in rats with MetS.
Keywords: Adipose tissue; cardiac remodeling; glucose metabolism; mammalian target of rapamycin; metabolic syndrome.
© 2017 The Authors. Pharmacology Research & Perspectives published by John Wiley & Sons Ltd, British Pharmacological Society and American Society for Pharmacology and Experimental Therapeutics.
Figures
Similar articles
-
Effects of pioglitazone on cardiac and adipose tissue pathology in rats with metabolic syndrome.Int J Cardiol. 2015 Jan 20;179:360-9. doi: 10.1016/j.ijcard.2014.11.099. Epub 2014 Nov 13. Int J Cardiol. 2015. PMID: 25464487
-
Cardiac remodeling and diastolic dysfunction in DahlS.Z-Lepr(fa)/Lepr(fa) rats: a new animal model of metabolic syndrome.Hypertens Res. 2012 Feb;35(2):186-93. doi: 10.1038/hr.2011.157. Epub 2011 Sep 15. Hypertens Res. 2012. PMID: 21918527
-
Attenuation of cold stress-induced exacerbation of cardiac and adipose tissue pathology and metabolic disorders in a rat model of metabolic syndrome by the glucocorticoid receptor antagonist RU486.Nutr Diabetes. 2016 Apr 25;6(4):e207. doi: 10.1038/nutd.2016.14. Nutr Diabetes. 2016. PMID: 27110688 Free PMC article.
-
Restraint stress exacerbates cardiac and adipose tissue pathology via β-adrenergic signaling in rats with metabolic syndrome.Am J Physiol Heart Circ Physiol. 2015 May 15;308(10):H1275-86. doi: 10.1152/ajpheart.00906.2014. Epub 2015 Mar 13. Am J Physiol Heart Circ Physiol. 2015. PMID: 25770247
-
Effects of estrogen on cardiovascular injury in ovariectomized female DahlS.Z-Lepr(fa)/Lepr(fa) rats as a new animal model of metabolic syndrome.Hypertension. 2012 Mar;59(3):694-704. doi: 10.1161/HYPERTENSIONAHA.111.180976. Epub 2012 Jan 23. Hypertension. 2012. PMID: 22275535
Cited by
-
Cardiovascular effects of immunosuppression agents.Front Cardiovasc Med. 2022 Sep 21;9:981838. doi: 10.3389/fcvm.2022.981838. eCollection 2022. Front Cardiovasc Med. 2022. PMID: 36211586 Free PMC article. Review.
-
Evaluation of Transcriptomic Regulations behind Metabolic Syndrome in Obese and Lean Subjects.Int J Mol Sci. 2020 Feb 20;21(4):1455. doi: 10.3390/ijms21041455. Int J Mol Sci. 2020. PMID: 32093387 Free PMC article. Clinical Trial.
-
Biomarkers and Seaweed-Based Nutritional Interventions in Metabolic Syndrome: A Comprehensive Review.Mar Drugs. 2024 Dec 4;22(12):550. doi: 10.3390/md22120550. Mar Drugs. 2024. PMID: 39728125 Free PMC article. Review.
-
Oxidative-Antioxidant Imbalance and Impaired Glucose Metabolism in Schizophrenia.Biomolecules. 2020 Mar 2;10(3):384. doi: 10.3390/biom10030384. Biomolecules. 2020. PMID: 32121669 Free PMC article. Review.
-
Mitophagy Disequilibrium, a Prominent Pathological Mechanism in Metabolic Heart Diseases.Diabetes Metab Syndr Obes. 2021 Nov 25;14:4631-4640. doi: 10.2147/DMSO.S336882. eCollection 2021. Diabetes Metab Syndr Obes. 2021. PMID: 34858041 Free PMC article. Review.
References
-
- Bhaskar PT, Hay N (2007). The two TORCs and Akt. Dev Cell 12: 487–502. - PubMed
-
- Buss SJ, Muenz S, Riffel JH, Malekar P, Hagenmueller M, Weiss CS, et al. (2009). Beneficial effects of mammalian target of rapamycin inhibition on left ventricular remodeling after myocardial infarction. J Am Coll Cardiol 54: 2435–2446. - PubMed
-
- Elmarakby AA, Loomis ED, Pollock JS, Pollock DM (2005). NADPH oxidase inhibition attenuates oxidative stress but not hypertension produced by chronic ET‐1. Hypertension 45: 283–287. - PubMed
-
- Goudar RK, Shi Q, Hjelmeland MD, Keir ST, McLendon RE, Wikstrand CJ, et al. (2005). Combination therapy of inhibitors of epididymis growth factor receptor/vascular endothelial growth factor receptor 2 (AEE788) and the mammalian target of rapamycin (RAD001) offers improved glioblastoma tumor growth inhibition. Mol Cancer Ther 4: 101–112. - PubMed
LinkOut - more resources
Full Text Sources
Other Literature Sources
Molecular Biology Databases
Miscellaneous
