. 2017 Sep 2;13(9):1573-1589.
doi: 10.1080/15548627.2017.1339004. Epub 2017 Aug 14.

Hsp83 loss suppresses proteasomal activity resulting in an upregulation of caspase-dependent compensatory autophagy

Affiliations

Hsp83 loss suppresses proteasomal activity resulting in an upregulation of caspase-dependent compensatory autophagy

Courtney Choutka et al. Autophagy. .

Abstract

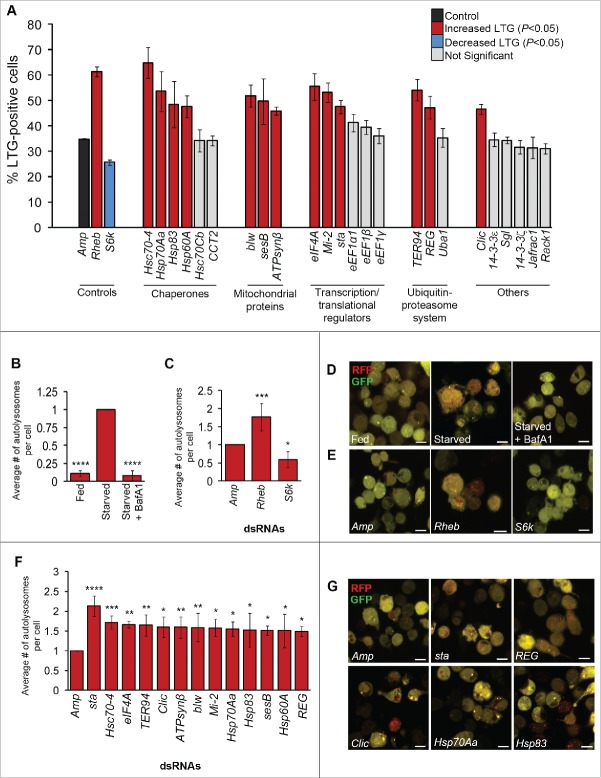
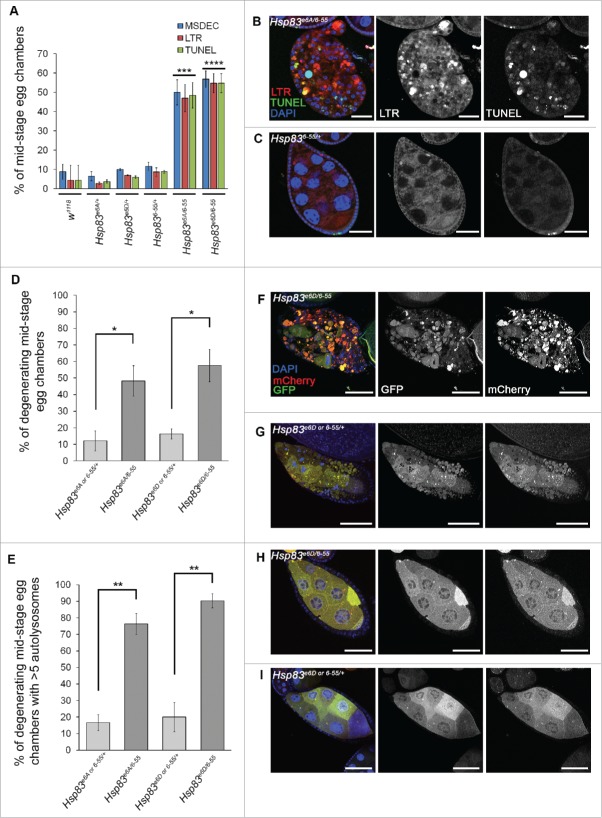
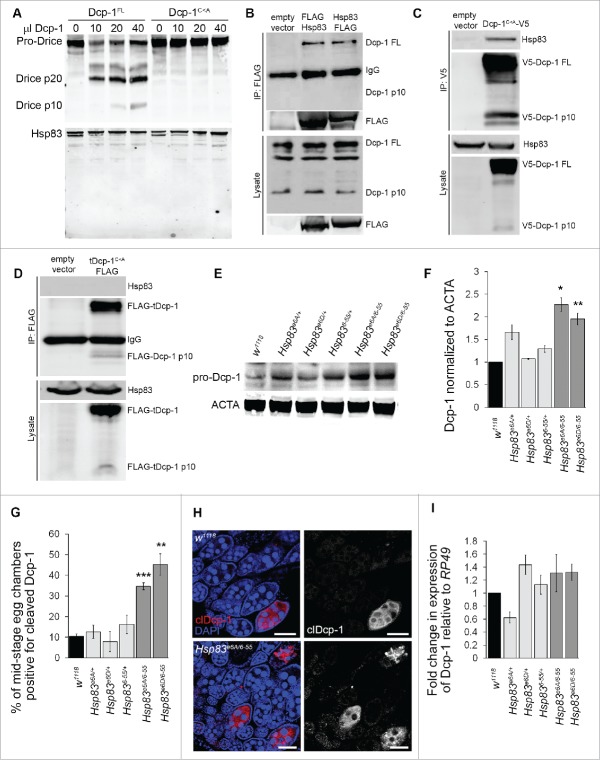
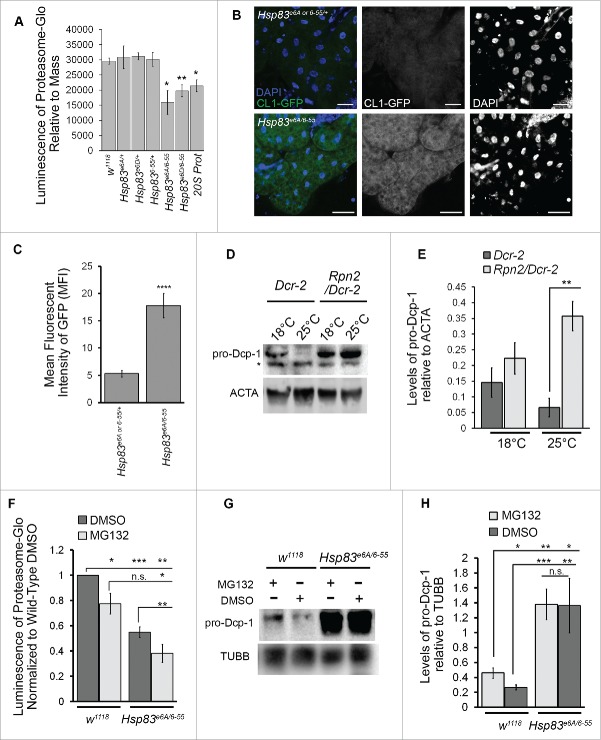
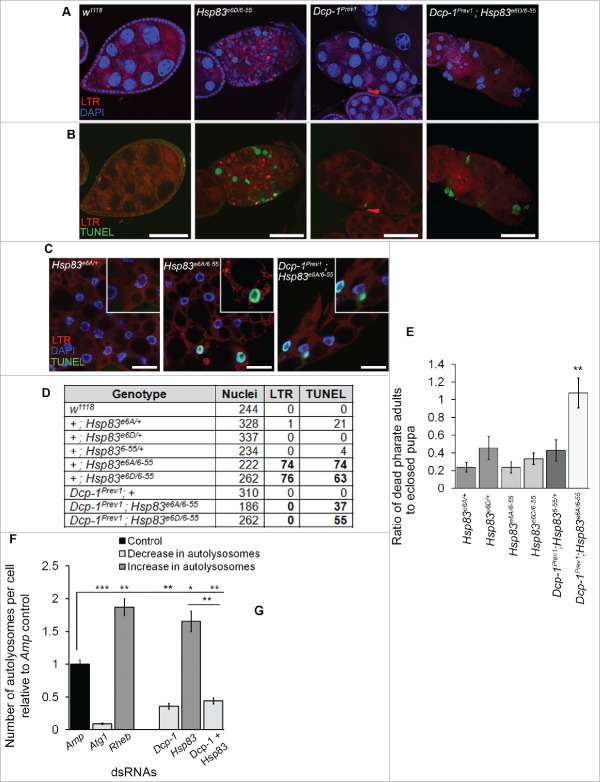
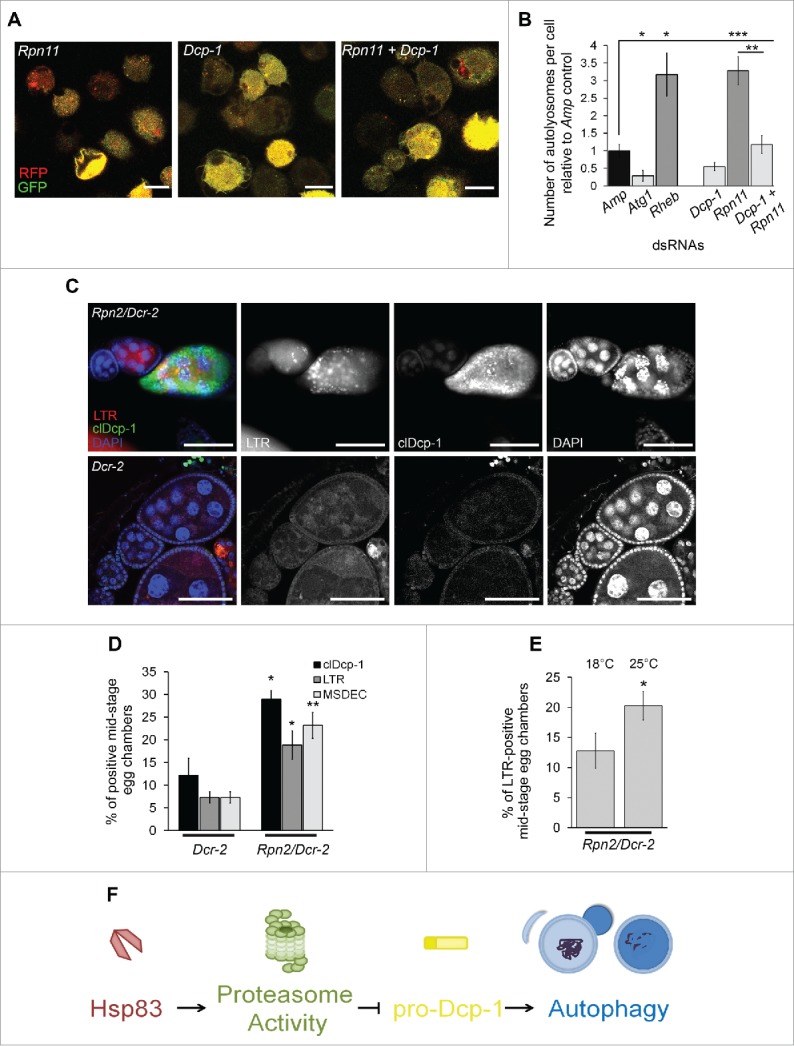
The 2 main degradative pathways that contribute to proteostasis are the ubiquitin-proteasome system and autophagy but how they are molecularly coordinated is not well understood. Here, we demonstrate an essential role for an effector caspase in the activation of compensatory autophagy when proteasomal activity is compromised. Functional loss of Hsp83, the Drosophila ortholog of human HSP90 (heat shock protein 90), resulted in reduced proteasomal activity and elevated levels of the effector caspase Dcp-1. Surprisingly, genetic analyses showed that the caspase was not required for cell death in this context, but instead was essential for the ensuing compensatory autophagy, female fertility, and organism viability. The zymogen pro-Dcp-1 was found to interact with Hsp83 and undergo proteasomal regulation in an Hsp83-dependent manner. Our work not only reveals unappreciated roles for Hsp83 in proteasomal activity and regulation of Dcp-1, but identifies an effector caspase as a key regulatory factor for sustaining adaptation to cell stress in vivo.

Keywords: Dcp-1; Drosophila; Hsp83; apoptosis; caspase; compensatory autophagy; heat-shock protein; ubiquitin-proteasome system.


Figures

Figure 1.
Figure 1.
Thirteen candidate Dcp-1 interactors modify LysoTracker® Green and autolysosomes in vitro (A) RNAi-treated l(2)mbn cells stained with LysoTracker® Green (LTG) and starved to measure autophagy-associated activity via flow cytometry. Error bars represent ± SEM(n = 3). Statistical significance was determined using one-way ANOVA with a Dunnet post-test. Knockdown of targets that significantly increased LTG levels are indicated in red (P < 0.05), and knockdown of targets that significantly decreased LTG levels are indicated in blue (P < 0.05). All samples were compared with the negative Amp control dsRNA (ampicillin resistance gene) that is shown in black. (B to G) Analysis of RFP-GFP-Atg8a puncta in RNAi-treated Drosophila S2 cells. At least 50 cells were counted per treatment (n = 3), and graphs represent the average number of autolysosomes per cell relative to the Amp control. Error bars represent the average ± SEM, and statistical significance was determined using one-way ANOVA with a Dunnet post-test. (B) Cells were subjected to nutrient rich or deprived conditions for 7 h in the presence or absence of 0.1 μM bafilomycin A1 (BafA1). ****P < 0.0001. (C) Cells were treated with Amp, Rheb, or S6k dsRNA and subjected to 7 h of starvation, *P < 0.05, ***P < 0.001. (D) Representative images of S2-RFP-GFP-Atg8a cells subjected to fed, starved, or starved + BafA1 conditions. (E) Representative images of S2-RFP-GFP-Atg8a cells treated with the indicated dsRNAs. (F) Cells were treated with the indicated dsRNAs and subjected to starvation conditions for 7 h. *P < 0.05, **P < 0.01, ***P < 0.001 ****P < 0.0001. (G) Representative images of S2-RFP-GFP-Atg8a cells treated with the indicated dsRNAs. Scale bars: 10 μm.
Figure 2.
Figure 2.
Loss of Hsp83 function leads to an increase in autophagy and cell death features in vivo. (A) Mid-stage egg chambers (MSECS) scored as being TUNEL positive, LysoTracker® Red (LTR)-positive or as having condensed degenerating nurse cell nuclei by DAPI (MSDEC) with percentages reported according to their genotype. At least 50 MSECs were counted per genotype (n = 3). Error bars represent ± SEM and statistical significance was determined using one-way ANOVA with a Bonferroni post-test and compared with w1118, ***P < 0.001, ****P < 0.0001. (B, C) Representative MSDECs and nondegenerating MSECs stained with LTR, TUNEL and DAPI, scale bars: 25 μm. (B) MSDEC from an Hsp83e6A/6–55 ovariole that scored positive for LTR and TUNEL staining. (C) Nondegenerating MSEC from Hsp836–55/+ scored as negative for LTR and TUNEL (D to I) MSECs were scored from flies expressing GFP-mCherry-Atg8a in the germline (UAsp-GFP-mCherry-DrAtg8a with single copies of the drivers otu-GAL4 and NGT-GAL4). Hsp83e6D/+ and Hsp836–55/+, Hsp83e6A/+ and Hsp836–55/+ from the same cross were analyzed together. (D) Percentage of MSDECs for the indicated genotypes is represented on the graph and reflects the mean of at least 100 MSECs scored per genotype (n = 3). Error bars represent ± SEM and statistical significance was determined using a 2-tailed Student t test, *P < 0.05. (E) Flies expressing GFP-mCherry-Atg8a in the germline were scored as either having more than 5 autolysosomes or less than or equal to 5 autolysosomes. The percentages shown reflect the mean of at least 100 MSECs scored per genotype (n = 3). Error bars represent ± SEM and statistical significance was determined using a 2-tailed Student t test, **P < 0.01. (F) to I) Representative images of MSECs expressing the construct GFP-mCherry-Atg8a, scale bar = 25μm. MSDECS found in (F) Hsp83e6D/6–55 flies and (G) Hsp83e6D or 6-55/+. (H, I) Examples of nondegenerating MSECs from (H) Hsp83e6D/6–55 flies and (I) Hsp83e6D or 6-55/+.
Figure 3.
Figure 3.
Hsp83 interacts with pro-Dcp-1 and suppresses its levels in a manner independent of transcriptional regulation. (A) Purified catalytically active Dcp-1 (Dcp-1FL) and catalytically inactive Dcp-1 (Dcp-1C<A) were incubated with in vitro translated Drice or Hsp83. Dcp-1FL cleaved Drice but not Hsp83. (B) N and C-terminal FLAG-tagged constructs of Hsp83 were expressed in l(2)mbn cells and immunoprecipitated with anti-FLAG antibodies. A representative western blot shows that both N- and C-FLAG-tagged constructs immunoprecipitated endogenous pro-Dcp-1 (Dcp-1 FL). No processed Dcp-1 was detected following immunoprecipitation. Similar results were observed in 3 independent experiments. (C) Dcp-1C<A-V5 was expressed in l(2)mbn cells and immunoprecipitated with anti-V5 antibodies. A representative western blot shows that Dcp-1C<A-V5immunoprecipitated endogenous Hsp83. Similar results were observed in 3 independent experiments. (D) Truncated Dcp-1C<A-FLAG (tDcp-1C<A-FLAG) was expressed in l(2)mbn cells and immunoprecipitated with anti-FLAG antibodies. A representative western blot (from n = 2 independent experiments) shows that tDcp-1 was unable to immunoprecipitate endogenous Hsp83. (E) Western blot of whole body lysates from females of the specified genotypes; pro-Dcp-1 = 35 kDa, ACTA/actin = 42 kDa. (F) Quantification of levels of pro-Dcp1 was determined by densitometry and normalized to levels of ACTA/actin. The average relative levels of pro-Dcp-1 were determined with 8 females per lysate (n = 3). Error bars represent ± SEM and statistical significance was determined by comparison to the w1118 control using one-way ANOVA with a Dunnet post-test, *P < 0.05, **P < 0.01. (G) MSECs were scored as being positive or negative for cleaved Dcp-1 (clDcp-1). The average percentage was determined by analyzing over 50 MSECs per genotype (n = 3). Error bars represent ± SEM and statistical significance was determined by comparison to w1118 using one-way ANOVA with a Dunnet post-test, **P < 0.01,***P < 0.001. (H) Representative images of Drosophila ovarioles that were stained with cleaved Dcp-1 antibody and DAPI for w1118 control and Hsp83e6A/6–55, scale bars: 50 μm. (I) QRT-PCR was performed on mRNA extracts from 8 animals each to determine levels of Dcp-1 mRNA relative to the RP49 control mRNA (n = 3). The relative fold change was normalized to wild-type w1118 with error bars representing ± SEM. There was no significant difference in Dcp-1 mRNA expression between genotypes.
Figure 4.
Figure 4.
Loss of Hsp83 decreases proteasomal activity resulting in elevated Dcp-1 levels. (A) Proteasomal activity was measured in females from the indicated genotypes using luminescent output (RLU) produced from cleavage of proteasomal substrates (ProteasomeGlo kit) and made relative to mass. Error bars represent ± SEM and statistical significance was determined using one-way ANOVA with a Bonferroni post-test and compared with w1118, *P < 0.05, **P < 0.01. (n = 5) (B, C) UAS-CL1-GFP expressed in the larval fat body using the driver cg-GAL4 and visualized with nonadjusted GFP channel images taken in the same experiment with identical confocal microscope settings (n = 3). (B) Representatives images, scale bars: 50 μm and (C) quantification of fluorescence intensity using mean fluorescent intensity (MFI). Error bars represent ± SEM and statistical significance was determined using a 2-tailed Student t test, ****P < 0.0001. (D, E) Females with the maternal driver nosGAL4 were collected after 2 d of exposure to 18°C or 25°C with the genotypes +/UAspDcr-2; nosGAL4/+ (Dcr-2) and Rpn2-RNAI/UAspDcr-2;nosGAL4/+ (Rpn2/Dcr-2). (D) Representative western blot of pro-Dcp-1 and ACTA/actin levels in Dcr-2 and Rpn2/Dcr-2 pro-Dcp-1 = 35 kDa, ACTA/actin = 42 kDa, * represents a nonspecific band detected by the Dcp-1 antibody. (E) Quantification of pro-Dcp-1 levels was performed by densitometry and normalized to levels of ACTA/actin. The average relative levels of pro-Dcp-1 were determined with 8 females per lysate (n = 3). Error bars represent ± SEM and statistical significance was determined using a 2-way Student t test, **P < 0.01. (F) to H) Hsp83e6A/6–55 and w1118 flies were fed proteasomal inhibitor MG132 or the control DMSO for 4 d. (F) Proteasomal activity was measured and normalized to w1118 flies fed with DMSO (n = 3). Error bars represent ± SEM and statistical significance was determined using a Student t test, *P < 0.05, **P < 0.01, ***P < 0.001. (G) Representative image of a western blot probed for pro-Dcp-1(35 kDa) and TUBB/tubulin (55 kDa). (H) Quantification of pro-Dcp-1 levels was performed by densitometry and normalized to levels of TUBB/tubulin. The average relative levels of pro-Dcp-1 were determined with 8 females per lysate (n = 3). Error bars represent ± SEM and statistical significance was determined using a 2-way Student t test, *P < 0.05, **P < 0.01, ***P < 0.001.
Figure 5.
Figure 5.
Dcp-1 is required for autophagic flux but not cell death resulting from loss of Hsp83. (A,B) Representative images of MSECs for the genotypes w1118, Hsp83e6D/6–55, Dcp-1Prev1 and Dcp-1Prev1; Hsp83e6D/6–55, stained with (A) LTR and DAPI or (B) LTR and TUNEL; experiments were performed on at least 8 females per genotype (n = 3), scale bars: 50 μm. (C)Representative images of first in-star larval fat bodies stained with LTR, DAPI and TUNEL; scale bars:10 μm. (D) Quantification of the total number of cells, determined by DAPI staining, that stained positively for LTR and/or TUNEL in larval fat bodies from listed genotype. Experiments were performed in triplicate with the total number of cells assessed listed in the table. (E) The ratio of dead pharate adult pupae to eclosed pupae was counted in vials containing different combinations of mutant Hsp83 and Dcp-1 alleles. Vials were incubated at room temperature for 14 d past first fly eclosion and then ratios were counted for at least 80 animals (n = 3). Error bars represent ± SEM and statistical significance was determined using one-way ANOVA with a Dunnet post-test (**P < 0.01). (F, G) The number of autolysosomes per cell was quantified in S2 cells stably expressing GFP-RFP-Atg8a and treated with the indicated dsRNAs. (F) All counts were normalized to the Amp dsRNA control. Atg1 and Rheb dsRNA's served as controls for decreasing and increasing the number of autolysosomes, respectively (n = 3). Error bars represent ± SEM and statistical significance was determined using one-way ANOVA with a Dunnet post-test, *P < 0.05, **P < 0.01,***P < 0.001. More than 100 cells were analyzed per treatment. (G) Representative images of GFP-RFP-Atg8a S2 cells following treatment with the indicated dsRNAs; scale bars:10 μm.
Figure 6.
Figure 6.
Proteasomal subunit loss results in Dcp-1-dependent compensatory autophagy. (A, B) The number of autolysosomes per cell was quantified in S2 cells stably expressing GFP-RFP-Atg8a and treated with the indicated dsRNAs. (A) Representative images of GFP-RFP-Atg8a S2 cells following treatment with the indicated dsRNAs; scale bars: 10 μm. (B) All counts were normalized to the Amp dsRNA control. Atg1 and Rheb dsRNA's served as controls for decreasing and increasing the number of autolysosomes, respectively. Error bars represent ± SEM and statistical significance was determined using one-way ANOVA with a Dunnet post-test, *P < 0.05, **P < 0.01,***P < 0.001 (C, D) Females were collected from flies with the UAS maternal driver kept at 25°C with the genotypes UAspDcr-2/+; nosGAL4/+ (Dcr-2) and Rpn2-RNAI/UAspDcr-2;nosGAL4/+ (Rpn2/Dcr-2). (C) Representative images of MSECs from Rpn2/Dcr-2 and Dcr-2 kept at 25°C. Ovaries were imaged with clDcp-1 antibody, LTR and DAPI; scale bars: 50 μm. (D) MSECS from Dcr-2 and Rpn2/Dcr-2 flies were scored for cleaved Dcp-1 (clDcp-1), LTR and DAPI. The graph represents the average percentage of MSECs that scored positive for LTR, MSDEC or clDcp-1. Experiments were performed with at least 8 females per genotype (n = 3). Error bars represent ± SEM and statistical significance was determined using the 2-way Student t test, *P < 0.05, **P < 0.01 (E) MSECS in Rpn2/Dcr-2 flies were scored for LTR positivity at 18°C and 25°C. At least 50 MSECS were analyzed per temperature (n = 4). Error bars represent ± SEM and statistical significance was determined using the 2-way Student t test, *P < 0.05 (F) A proposed pathway indicating that Hsp83 functions in basal conditions to contribute to proteasomal activity which suppresses pro-Dcp-1 levels and thus prevents activation of autophagy or cell death.

Similar articles

Cited by

References

    1. Labbadia J, Morimoto RI. The biology of proteostasis in aging and disease. Annu Rev Biochem 2015; 84:435-64; PMID:25784053; https://doi.org/10.1146/annurev-biochem-060614-033955 - DOI - PMC - PubMed
    1. Ding W-X, Ni HM, Gao W, Yoshimori T, Stolz DB, Ron D, Yin XM. Linking of autophagy to ubiquitin-proteasome system is important for the regulation of endoplasmic reticulum stress and cell viability. Am J Pathol 2007; 171:513-24; PMID:17620365; https://doi.org/10.2353/ajpath.2007.070188 - DOI - PMC - PubMed
    1. Iwata A, Riley BE, Johnston JA, Kopito RR. HDAC6 and microtubules are required for autophagic degradation of aggregated huntingtin. J Biol Chem 2005; 280:40282-92; PMID:16192271; https://doi.org/10.1074/jbc.M508786200 - DOI - PubMed
    1. Lőw P, Varga Á, Pircs K, Nagy P, Szatmári Z, Sass M, Juhász G. Impaired proteasomal degradation enhances autophagy via hypoxia signaling in Drosophila. BMC Cell Biol 2013; 14:29; PMID:23800266; https://doi.org/10.1186/1471-2121-14-29 - DOI - PMC - PubMed
    1. Pandey UB, Nie Z, Batlevi Y, McCray BA, Ritson GP, Nedelsky NB, Schwartz SL, DiProspero NA, Knight MA, Schuldiner O, et al.. HDAC6 rescues neurodegeneration and provides an essential link between autophagy and the UPS. Nature 2007; 447:859-63; PMID:17568747; https://doi.org/10.1038/nature05853 - DOI - PubMed

MeSH terms