. 2017 Aug 14;13(8):e1005698.
doi: 10.1371/journal.pcbi.1005698. eCollection 2017 Aug.

A systems approach reveals distinct metabolic strategies among the NCI-60 cancer cell lines

Affiliations

A systems approach reveals distinct metabolic strategies among the NCI-60 cancer cell lines

Maike K Aurich et al. PLoS Comput Biol. .

Abstract

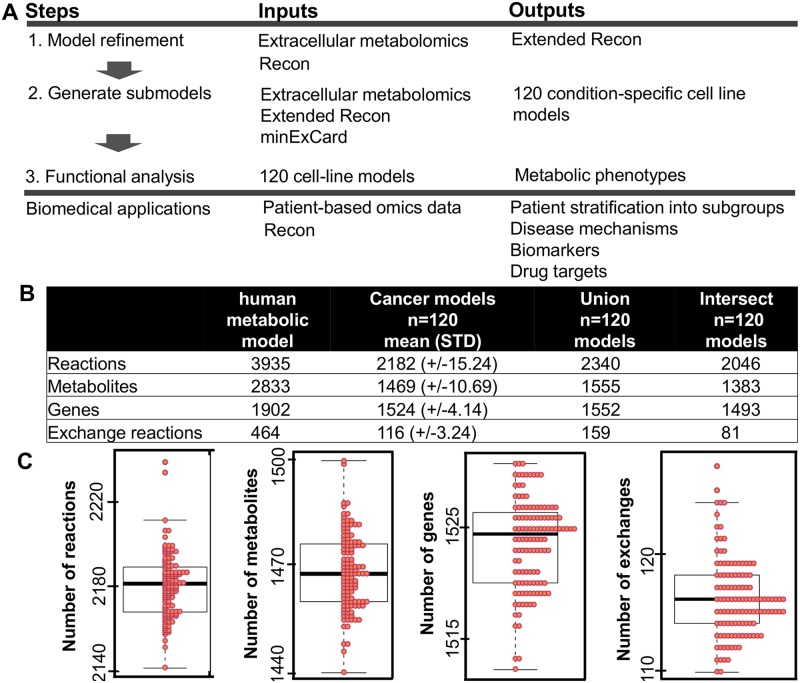
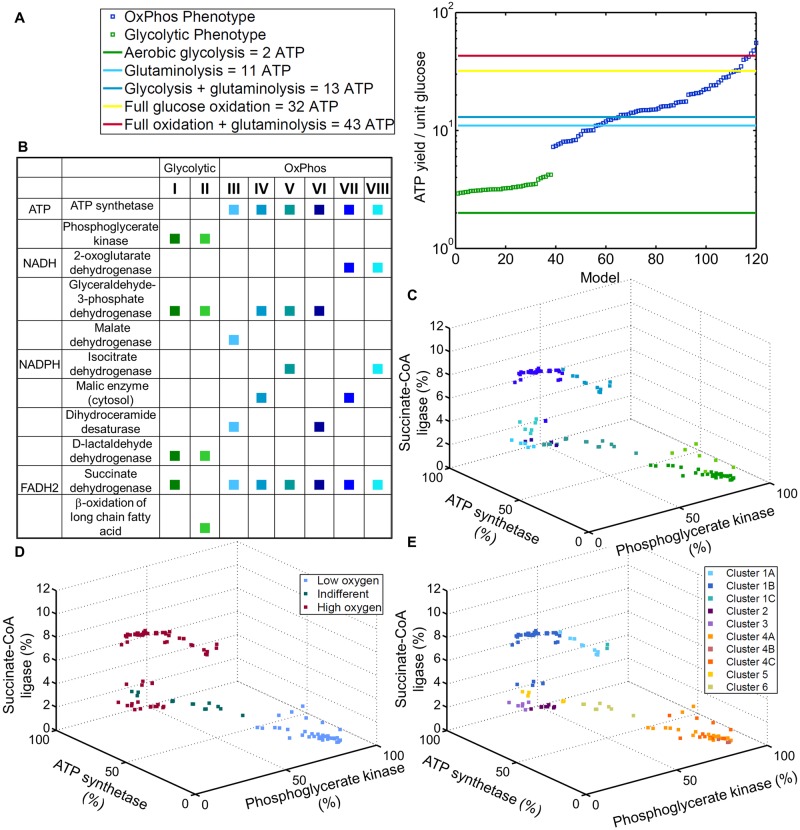
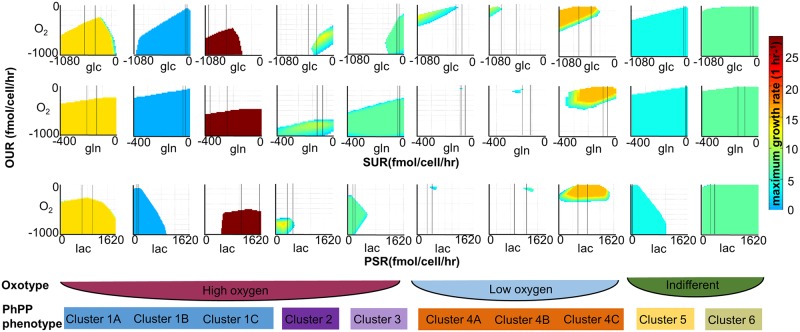
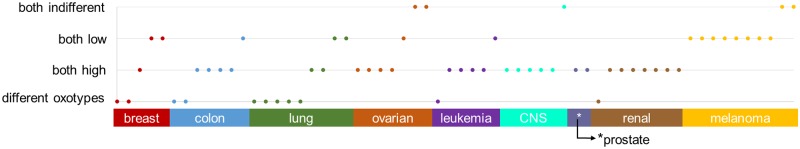
The metabolic phenotype of cancer cells is reflected by the metabolites they consume and by the byproducts they release. Here, we use quantitative, extracellular metabolomic data of the NCI-60 panel and a novel computational method to generate 120 condition-specific cancer cell line metabolic models. These condition-specific cancer models used distinct metabolic strategies to generate energy and cofactors. The analysis of the models' capability to deal with environmental perturbations revealed three oxotypes, differing in the range of allowable oxygen uptake rates. Interestingly, models based on metabolomic profiles of melanoma cells were distinguished from other models through their low oxygen uptake rates, which were associated with a glycolytic phenotype. A subset of the melanoma cell models required reductive carboxylation. The analysis of protein and RNA expression levels from the Human Protein Atlas showed that IDH2, which was an essential gene in the melanoma models, but not IDH1 protein, was detected in normal skin cell types and melanoma. Moreover, the von Hippel-Lindau tumor suppressor (VHL) protein, whose loss is associated with non-hypoxic HIF-stabilization, reductive carboxylation, and promotion of glycolysis, was uniformly absent in melanoma. Thus, the experimental data supported the predicted role of IDH2 and the absence of VHL protein supported the glycolytic and low oxygen phenotype predicted for melanoma. Taken together, our approach of integrating extracellular metabolomic data with metabolic modeling and the combination of different network interrogation methods allowed insights into the metabolism of cells.


Conflict of interest statement

The authors have declared that no competing interests exist.

Figures

Fig 1
Fig 1. Metabolic models provide a context for the analysis of metabolomic data.
A 1. The refinement step denotes the addition of transport and exchange reactions to enable the uptake and secretion of the metabolites detected in the metabolomic profiles of the NCI-60 cell lines [15]. 2. The condition-specific cell line models were generated using minExCard. In total, 120 models (NCI-60 multiplied by 2) were generated from published metabolomic data and the extended metabolic model. 3. The models were analyzed using a set of computational methods. Based on the computational results, the models were divided into different metabolic phenotypes, and drug targets were predicted for each individual model. The approach is applicable to a variety of biomedical applications. An analysis of tumor or patient-specific omics data could be used to stratify disease phenotypes and to predict personalized disease intervention strategies. B Differences in the number of reactions, metabolites, and genes across a large set of models. C Distribution of the number of reactions, metabolites, genes, and exchange reactions among the 120 cell line models.
Fig 2
Fig 2. Distinction of the models.
A Rank-ordered ATP yields achieved by the models describe a gradual increase rather than clusters around theoretical ATP yields. The spread of ATP yields highlights the metabolic heterogeneity between the 120 models. The cell lines use a mixture of pathways and metabolic fuels for ATP production, which explains that the predicted ATP yield can exceed the theoretical measures. Two major strategies for ATP production can be distinguished based on the ATP yields. The distinction lies in the higher contribution of either phosphoglycerate kinase (green squares) or ATP synthase (red squares) to the total ATP production. B A fine-grained division of the OxPhos models is achieved considering the production strategies of ATP, NADPH, NADH, and FADH2. The table lists the reactions contributing most to ATP, NADH, NADPH, and FADH2 production for each phenotype (I-VIII). C A three dimensional plot of the eight phenotypes with respect to the utilization of glycolysis, the TCA cycle, and oxidative phosphorylation. D Three different oxotypes are distinguished. The distinction between the OxPhos models (blue) is different from the phenotypic classification performed based on the energy and cofactor production strategies depicted above (see also S1 Text). E Six model clusters are distinguished according to each models’ ability to deal with environmental changes. Variations in glucose, glutamine, lactate, and oxygen lead to a distinct stratification of OxPhos models. Fig F in S1 Text shows different perspectives.
Fig 3
Fig 3. Six model clusters are distinguished according to the models’ robustness towards environmental changes.
Heatmaps display results for one model from each cluster (and subcluster). Lines in the heatmaps indicate the constraints imposed on the exemplified model. Lac = lactose, glc = glucose and gln = glutamine.
Fig 4
Fig 4. Oxotype of model pairs.
Replicate models of the same cell line predominantly share the same oxotype. Only 11 model pairs have distinct oxotypes (different oxotypes). A tissue pattern becomes apparent for the melanoma cell lines. Melanoma cell lines predominantly have a low oxotype.

References

    1. Warburg O. On the origin of cancer cells. Science. 123, 309–314 (1956). 10.1126/science.123.3191.309 - DOI - PubMed
    1. Zu X. L. & Guppy M. Cancer metabolism: facts, fantasy, and fiction. Biochem Biophys Res Commun. 313, 459–465 (2004). 10.1016/j.bbrc.2003.11.136 - DOI - PubMed
    1. Carracedo A., Cantley L. C. & Pandolfi P. P. Cancer metabolism: fatty acid oxidation in the limelight. Nat Rev Cancer. 13, 227–232 (2013). 10.1038/nrc3483 - DOI - PMC - PubMed
    1. Locasale J. W. et al. Phosphoglycerate dehydrogenase diverts glycolytic flux and contributes to oncogenesis. Nat Genet. 43, 869–874 (2011). 10.1038/ng.890 - DOI - PMC - PubMed
    1. Metallo C. M. et al. Reductive glutamine metabolism by IDH1 mediates lipogenesis under hypoxia. Nature. 481, 380–384 (2011). 10.1038/nature10602 - DOI - PMC - PubMed