. 2017 Aug 14;17(1):542.
doi: 10.1186/s12885-017-3532-x.

Tumor microenvironment conditions alter Akt and Na+/H+ exchanger NHE1 expression in endothelial cells more than hypoxia alone: implications for endothelial cell function in cancer

Affiliations

Tumor microenvironment conditions alter Akt and Na+/H+ exchanger NHE1 expression in endothelial cells more than hypoxia alone: implications for endothelial cell function in cancer

A K Pedersen et al. BMC Cancer. .

Abstract

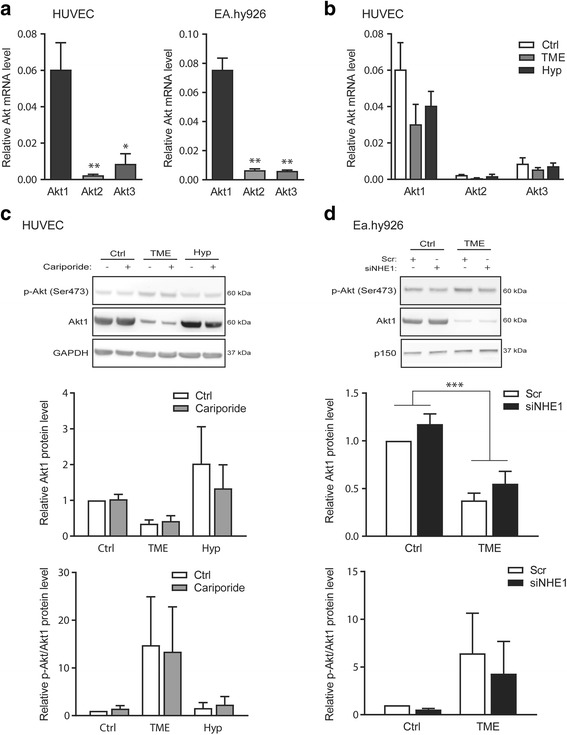
Background: Chronic angiogenesis is a hallmark of most tumors and takes place in a hostile tumor microenvironment (TME) characterized by hypoxia, low nutrient and glucose levels, elevated lactate and low pH. Despite this, most studies addressing angiogenic signaling use hypoxia as a proxy for tumor conditions. Here, we compared the effects of hypoxia and TME conditions on regulation of the Na+/H+ exchanger NHE1, Ser/Thr kinases Akt1-3, and downstream effectors in endothelial cells.

Methods: Human umbilical vein endothelial cells (HUVEC) and Ea.hy926 endothelial cells were exposed to simulated TME (1% hypoxia, low serum, glucose, pH, high lactate) or 1% hypoxia for 24 or 48 h, with or without NHE1 inhibition or siRNA-mediated knockdown. mRNA and protein levels of NHE1, Akt1-3, and downstream effectors were assessed by qPCR and Western blotting, vascular endothelial growth factor (VEGF) release by ELISA, and motility by scratch assay.

Results: Within 24 h, HIF-1α level and VEGF mRNA level were increased robustly by TME and modestly by hypoxia alone. The NHE1 mRNA level was decreased by both hypoxia and TME, and NHE1 protein was reduced by TME in Ea.hy926 cells. Akt1-3 mRNA was detected in HUVEC and Ea.hy926 cells, Akt1 most abundantly. Akt1 protein expression was reduced by TME yet unaffected by hypoxia, while Akt phosphorylation was increased by TME. The Akt loss was partly reversed by MCF-7 human breast cancer cell conditioned medium, suggesting that in vivo, the cancer cell secretome may compensate for adverse effects of TME on endothelial cells. TME, yet not hypoxia, reduced p70S6 kinase activity and ribosomal protein S6 phosphorylation and increased eIF2α phosphorylation, consistent with inhibition of protein translation. Finally, TME reduced Retinoblastoma protein phosphorylation and induced poly-ADP-ribose polymerase (PARP) cleavage consistent with inhibition of proliferation and induction of apoptosis. NHE1 knockdown, mimicking the effect of TME on NHE1 expression, reduced Ea.hy926 migration. TME effects on HIF-1α, VEGF, Akt, translation, proliferation or apoptosis markers were unaffected by NHE1 knockdown/inhibition.

Conclusions: NHE1 and Akt are downregulated by TME conditions, more potently than by hypoxia alone. This inhibits endothelial cell migration and growth in a manner likely modulated by the cancer cell secretome.

Keywords: Acid–base transport; Angiogenesis; Cancer; Proliferation; Signaling; VEGF; pH regulation.


Conflict of interest statement

Ethics approval and consent to participate

Not applicable.

Consent for publication

Not applicable.

Competing interests

The authors declare that they have no competing interests. All funding received, including that from the Novo Nordisk Foundation, is independent research funding and does not entail a conflict of interest.

Publisher’s Note

Springer Nature remains neutral with regard to jurisdictional claims in published maps and institutional affiliations.

Figures

Fig. 1
Fig. 1
TME conditions upregulate HIF-1α and VEGF – this is NHE1-independent whereas endothelial cell migration is dependent on NHE1. HUVECs or Ea.hy926 were grown under normoxic control (Ctrl), simulated tumor microenvironment (TME; 1% O2, 1% FBS, 2.5 mM glucose, 7.5 mM lactate and pH 6.5) or hypoxic (Hyp; 1% O2) conditions for 24 h, prior to cell lysis and western blotting with primary antibodies against HIF-1α, or RNA purification, reverse transcription and qPCR with primers against VEGFA165. NHE1 was inhibited by cariporide (10 μM) or knocked down by siRNA treatment as indicated. a Representative western blot and quantification of HIF-1α protein levels after 24 h relative to the untreated control. GAPDH is shown as loading control. Quantified data are presented as means with SEM error bars of n = 3–5. ** indicate p < 0.01 compared to control cells, two-way ANOVA with Bonferroni’s multiple comparison post-test. The two-way ANOVA test also revealed a significant difference between conditions (Ctrl, TME, Hyp) with p < 0.0001. b, c Quantification of VEGF mRNA levels relative to the untreated control for HUVEC (B) and Ea.hy926 (C) cells. qPCR analysis was carried out as described in Methods, using GAPDH as housekeeping gene, and analysis was performed using the Pfaffl method. Data are shown as means with SEM error bars of n = 5. * denotes p < 0.05, one-way ANOVA with Tukey’s multiple comparison post-test. d Ea.hy926 cells were treated with NHE1 siRNA or scrambled control siRNA for 48 h (for knockdown efficacy, see Fig. 2d), whereafter a scratch in the culture was made with a sterile pipette tip and cell migration into the wound area monitored. Data are presented as means with SEM error bars of n = 3. The figure shows representative images and quantification of the wound area 18 h after scratch induction, relative to that of scrambled control siRNA
Fig. 2
Fig. 2
NHE1 is downregulated by hypoxia and TME. HUVECs or Ea.hy926 were grown under normoxic control (Ctrl), TME (1% O2, 1% FBS, 2.5 mM glucose, 7.5 mM lactate and pH 6.5) or hypoxic (Hyp; 1% O2) conditions for 24 h (or 48 h as indicated in panel C). Subsequently, cells were lysed and subjected to SDS-PAGE and western blotting with primary antibodies against NHE1 or RNA purification, reverse transcription and qPCR with primers against NHE1 and GAPDH, as described in the Methods section. NHE1 was inhibited by cariporide (10 μM) as indicated. a NHE1 mRNA levels in HUVEC based on quantification of qPCR results relative to the untreated control and normalized to GAPDH levels. *** indicates p < 0.001, ANOVA with Tukey’s multiple comparison post-test. Data are shown as means with SEM error bars of n = 5. b Representative western blot and quantification (relative to Ctrl conditions), showing the protein expression levels of NHE1 in HUVEC after 24 h of TME or hypoxia exposure. GAPDH is shown as loading control. Quantified data are shown as means with SEM error bars of n = 3–5. c Representative western blot and quantification (relative to ctrl condition), showing the protein expression levels of NHE1 in HUVEC after 48 h of TME or hypoxia exposure. GAPDH is shown as loading control. Quantified data are shown as means with SEM error bars of n = 3. d, e Effects of NHE1 siRNA knockdown and TME conditions were evaluated using the Ea.hy926 cell line. Cells were treated with siRNA against NHE1 or scrambled control siRNA for 24 h prior to exposure to TME conditions. d NHE1 mRNA levels in Ea.hy926 quantified as in (A). Data are shown as means with SEM error bars, and n = 5. e Western blot analysis of NHE1 protein levels in Ea.hy926. p150 is shown as loading control. Representative of n = 3
Fig. 3
Fig. 3
TME conditions dramatically lower mRNA and protein levels of Akt1 in HUVEC and Ea.hy926 cells, associated with increased relative phosphorylation of Akt. Cells were exposed to normoxic control (Ctrl), TME (1% O2, 1% FBS, 2.5 mM glucose, 7.5 mM lactate and pH 6.5) or hypoxic (Hyp; 1% O2) conditions as indicated, for 24 h before lysis and RNA purification, reverse transcription and qPCR or western blotting, as indicated. a Relative mRNA levels of the three Akt isoforms Akt1–3 in HUVEC (left panel) and Ea.hy926 (right panel) under Ctrl conditions. b Relative mRNA levels of Akt1–3 in HUVECs exposed to Ctrl, TME or Hyp conditions. Data are shown as means with SEM error bars and n = 5. * and ** denotes p < 0.05 and p < 0.01, respectively, one-way ANOVA with Tukey’s multiple comparison post-test. c Akt1 and p-Ser473Akt levels in HUVEC cells after 24 h of Ctrl, TME or Hyp conditions in the absence or presence of 10 μM cariporide. Top: representative western blots (GAPDH is shown as loading control), middle: protein level of total Akt1, bottom: p-Ser473Akt normalized to total Akt1. d As C, except for Ea.hy926 cells treated with NHE1 siRNA or scrambled control siRNA, and exposed to Ctrl or TME conditions. p150 is shown as loading control. Data are shown as means with SEM error bars, relative to control, and n = 3 for Hyp conditions, n = 5 for all other conditions. *** denotes p < 0.001, two-way ANOVA with Bonferroni’s multiple comparison post-test. The test revealed a significant difference in Akt1 protein levels between conditions (Ctrl, TME, Hyp), p < 0.01 for HUVEC and between conditions (Ctrl, TME), p < 0.0001 for Ea.hy926 cells
Fig. 4
Fig. 4
Treatment of HUVECs with tumor conditioned medium increases Akt, but not NHE1, protein expression. a VEGF content in MCF-7 conditioned medium (MCF-7 CM) based on quantification of ELISA results. MCF-7 cells were grown under TME conditions (1% O2, 1% FBS, 2.5 mM glucose, 7.5 mM lactate and pH 6.5) for 24 h, and medium collected for ELISA. Data are presented as mean with SEM error bar (n = 4). ** indicates p < 0.01, one-sample Student’s t-test against baseline. b, c HUVECs were exposed to standard TME conditions or to TME conditions with freshly prepared MCF-7 CM for 24 h followed by lysis and western blotting. Representative western blots and quantification of total protein levels relative to that for cells grown under standard TME conditions are shown for Akt1 (b) and NHE1 (c). GAPDH is shown as loading control. Data are presented as means ± SEM, with n = 4 per condition. * indicates p < 0.05, two-tailed paired Student’s t-test
Fig. 5
Fig. 5
TME conditions regulate the phosphorylation levels of p70S6K, rpS6 and eIF2α. HUVECs or Ea.hy926 were exposed to normoxic control (Ctrl), TME (1% O2, 1% FBS, 2.5 mM glucose, 7.5 mM lactate and pH 6.5) or hypoxic (Hyp; 1% O2) conditions as indicated, followed by lysis and western blotting. NHE1 was inhibited by cariporide (10 μM) or knocked down by siRNA-treatment where indicated. a Representative western blots of p-Thr389p70S6K and total p70S6K and quantification of p-p70S6K protein levels normalized to total p70S6K and relative to the untreated control condition for 24 h for HUVEC. GAPDH is shown as a loading control. b, c Representative western blots of p-Ser235/236rpS6 and quantifications of p-rpS6 protein levels relative to the untreated control condition for 24 h for HUVEC (b) and Ea.hy926 (c). GAPDH and p150 are shown as loading controls. d, e Representative western blots of p-Ser51eIF2α and quantifications of p-eIF2α protein levels relative to the untreated control condition for 24 h for HUVEC (d) and Ea.hy926 (e). p150 is shown as loading control. Data are presented as means with SEM error bars, with n = 5 except Hyp without/with cariporide for which n = 3. *, ** and *** indicates p < 0.05, p < 0.01 and p < 0.001, respectively, as obtained by two-way ANOVA with Bonferroni’s multiple comparison post-test. The two-way ANOVA test revealed a significant difference in p-p70S6K/p70S6K (p < 0.0001), p-rpS6 (p < 0.0001 for HUVEC and p < 0.05 for Ea.hy926) and p-eIF2α (p < 0.05 for HUVEC and p < 0.01 for Ea.hy926) between conditions (Ctrl, TME, Hyp). Also, p-p70S6K/p70S6K significantly changed with cariporide (p < 0.01)
Fig. 6
Fig. 6
TME conditions decrease proliferation and increase apoptosis signaling, while hypoxia alone has no effect. HUVECs or Ea.hy926 were exposed to normoxic control (Ctrl), TME (1% O2, 1% FBS, 2.5 mM glucose, 7.5 mM lactate and pH 6.5) or hypoxic (Hyp; 1% O2) conditions as indicated, for 24 or 48 h followed by lysis and western blotting. NHE1 was inhibited by cariporide (10 μM) or knocked down by siRNA-treatment where indicated. GAPDH is shown as loading control. a, b, c Representative western blots of p-Ser807/811-pRb and quantifications of the p-pRb protein levels relative to the untreated control condition for 24/48 h for HUVEC (a, b) and 24 h for Ea.hy926 (c). Two-way ANOVA revealed a significant difference in p-pRb levels between conditions (Ctrl, TME, Hyp) with p < 0.05 for HUVEC and p < 0.01 for Ea.hy926, respectively. d Representative western blots showing PARP protein levels and quantification of cleaved PARP relative to the untreated control for 24 h in HUVEC. Data are presented as means with SEM error bars, with n = 3–5

Similar articles

Cited by

References

    1. Bergers G, Hanahan D. Modes of resistance to anti-angiogenic therapy. Nat Rev Cancer. 2008;8:592–603. doi: 10.1038/nrc2442. - DOI - PMC - PubMed
    1. Chung AS, Lee J, Ferrara N. Targeting the tumour vasculature: Insights from physiological angiogenesis. Nat Rev Cancer. 2010;10:505–514. doi: 10.1038/nrc2868. - DOI - PubMed
    1. Sennino B, McDonald DM. Controlling escape from angiogenesis inhibitors. Nat Rev Cancer. 2012;12:699–709. doi: 10.1038/nrc3366. - DOI - PMC - PubMed
    1. Kim KJ, Li B, Winer J, Armanini M, Gillett N, Phillips HS, et al. Inhibition of vascular endothelial growth factor-induced angiogenesis suppresses tumour growth in vivo. Nature. 1993;362:841–844. doi: 10.1038/362841a0. - DOI - PubMed
    1. Olsson AK, Dimberg A, Kreuger J, Claesson-Welsh L. VEGF receptor signalling - in control of vascular function. Nat Rev Mol Cell Biol. 2006;7:359–371. doi: 10.1038/nrm1911. - DOI - PubMed

Substances

LinkOut - more resources