Total internal reflectance fluorescence imaging of genetically engineered ryanodine receptor-targeted Ca2+ probes in rat ventricular myocytes
- PMID: 28807154
- PMCID: PMC5599148
- DOI: 10.1016/j.ceca.2017.07.003
Total internal reflectance fluorescence imaging of genetically engineered ryanodine receptor-targeted Ca2+ probes in rat ventricular myocytes
Abstract
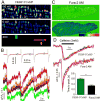
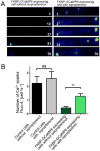
The details of cardiac Ca2+ signaling within the dyadic junction remain unclear because of limitations in rapid spatial imaging techniques, and availability of Ca2+ probes localized to dyadic junctions. To critically monitor ryanodine receptors' (RyR2) Ca2+ nano-domains, we combined the use of genetically engineered RyR2-targeted pericam probes, (FKBP-YCaMP, Kd=150nM, or FKBP-GCaMP6, Kd=240nM) with rapid total internal reflectance fluorescence (TIRF) microscopy (resolution, ∼80nm). The punctate z-line patterns of FKBP,2-targeted probes overlapped those of RyR2 antibodies and sharply contrasted to the images of probes targeted to sarcoplasmic reticulum (SERCA2a/PLB), or cytosolic Fluo-4 images. FKBP-YCaMP signals were too small (∼20%) and too slow (2-3s) to detect Ca2+ sparks, but the probe was effective in marking where Fluo-4 Ca2+ sparks developed. FKBP-GCaMP6, on the other hand, produced rapidly decaying Ca2+ signals that: a) had faster kinetics and activated synchronous with ICa3 but were of variable size at different z-lines and b) were accompanied by spatially confined spontaneous Ca2+ sparks, originating from a subset of eager sites. The frequency of spontaneously occurring sparks was lower in FKBP-GCaMP6 infected myocytes as compared to Fluo-4 dialyzed myocytes, but isoproterenol enhanced their frequency more effectively than in Fluo-4 dialyzed cells. Nevertheless, isoproterenol failed to dissociate FKBP-GCaMP6 from the z-lines. The data suggests that FKBP-GCaMP6 binds predominantly to junctional RyR2s and has sufficient on-rate efficiency as to monitor the released Ca2+ in individual dyadic clefts, and supports the idea that β-adrenergic agonists may modulate the stabilizing effects of native FKBP on RyR2.
Keywords: Ca(2+) sparks; Cardiac Ca(2+) signaling; Dyadic Ca(2+)signals; FKBP; Genetically engineered Ca(2+) probe; Ryanodine receptor.
Copyright © 2017 Elsevier Ltd. All rights reserved.
Figures


Similar articles
-
Mutation in RyR2-FKBP Binding site alters Ca2+ signaling modestly but increases "arrhythmogenesis" in human stem cells derived cardiomyocytes.Cell Calcium. 2022 Jan;101:102500. doi: 10.1016/j.ceca.2021.102500. Epub 2021 Nov 8. Cell Calcium. 2022. PMID: 34813985 Free PMC article.
-
Calcium/calmodulin-dependent kinase II and nitric oxide synthase 1-dependent modulation of ryanodine receptors during β-adrenergic stimulation is restricted to the dyadic cleft.J Physiol. 2016 Oct 15;594(20):5923-5939. doi: 10.1113/JP271965. Epub 2016 Jul 3. J Physiol. 2016. PMID: 27121757 Free PMC article.
-
Kinetics of FKBP12.6 binding to ryanodine receptors in permeabilized cardiac myocytes and effects on Ca sparks.Circ Res. 2010 Jun 11;106(11):1743-52. doi: 10.1161/CIRCRESAHA.110.219816. Epub 2010 Apr 29. Circ Res. 2010. PMID: 20431056 Free PMC article.
-
Multimodal SHG-2PF Imaging of Microdomain Ca2+-Contraction Coupling in Live Cardiac Myocytes.Circ Res. 2016 Jan 22;118(2):e19-28. doi: 10.1161/CIRCRESAHA.115.307919. Epub 2015 Dec 7. Circ Res. 2016. PMID: 26643875 Free PMC article. Review.
-
Conformational Dynamics in FKBP Domains: Relevance to Molecular Signaling and Drug Design.Curr Mol Pharmacol. 2015;9(1):5-26. doi: 10.2174/1874467208666150519113146. Curr Mol Pharmacol. 2015. PMID: 25986571 Free PMC article. Review.
Cited by
-
Excitatory postsynaptic calcium transients at Aplysia sensory-motor neuron synapses allow for quantal examination of synaptic strength over multiple days in culture.Learn Mem. 2021 Aug 16;28(9):277-290. doi: 10.1101/lm.052639.120. Print 2021 Sep. Learn Mem. 2021. PMID: 34400529 Free PMC article.
-
Loss-of-function W4645R mutation in the RyR2-caffeine binding site: implications for synchrony and arrhythmogenesis.Cell Calcium. 2024 Nov;123:102925. doi: 10.1016/j.ceca.2024.102925. Epub 2024 Jun 17. Cell Calcium. 2024. PMID: 38908063
-
Cardiac optogenetics: shining light on signaling pathways.Pflugers Arch. 2023 Dec;475(12):1421-1437. doi: 10.1007/s00424-023-02892-y. Epub 2023 Dec 14. Pflugers Arch. 2023. PMID: 38097805 Free PMC article. Review.
-
Investigating the effect of Shenmai injection on cardiac electrophysiology and calcium signaling using human-induced pluripotent stem cell-derived cardiomyocytes.Biochem Biophys Rep. 2022 Dec 26;33:101407. doi: 10.1016/j.bbrep.2022.101407. eCollection 2023 Mar. Biochem Biophys Rep. 2022. PMID: 36593870 Free PMC article.
-
Mutation in RyR2-FKBP Binding site alters Ca2+ signaling modestly but increases "arrhythmogenesis" in human stem cells derived cardiomyocytes.Cell Calcium. 2022 Jan;101:102500. doi: 10.1016/j.ceca.2021.102500. Epub 2021 Nov 8. Cell Calcium. 2022. PMID: 34813985 Free PMC article.
References
-
- Cheng H, Lederer WJ, Cannell MB. Calcium sparks: elementary events underlying excitation-contraction coupling in heart muscle. Science. 1993;262:740–744. - PubMed
-
- Protasi F, Sun XH, Franzini-Armstrong C. Formation and maturation of the calcium release apparatus in developing and adult avian myocardium. Developmental biology. 1996;173:265–278. - PubMed
Publication types
MeSH terms
Substances
Grants and funding
LinkOut - more resources
Full Text Sources
Other Literature Sources
Miscellaneous

