. 2017 Nov 1;25(11):2452-2465.
doi: 10.1016/j.ymthe.2017.07.013. Epub 2017 Jul 27.

Function of Novel Anti-CD19 Chimeric Antigen Receptors with Human Variable Regions Is Affected by Hinge and Transmembrane Domains

Affiliations

Function of Novel Anti-CD19 Chimeric Antigen Receptors with Human Variable Regions Is Affected by Hinge and Transmembrane Domains

Leah Alabanza et al. Mol Ther. .

Abstract

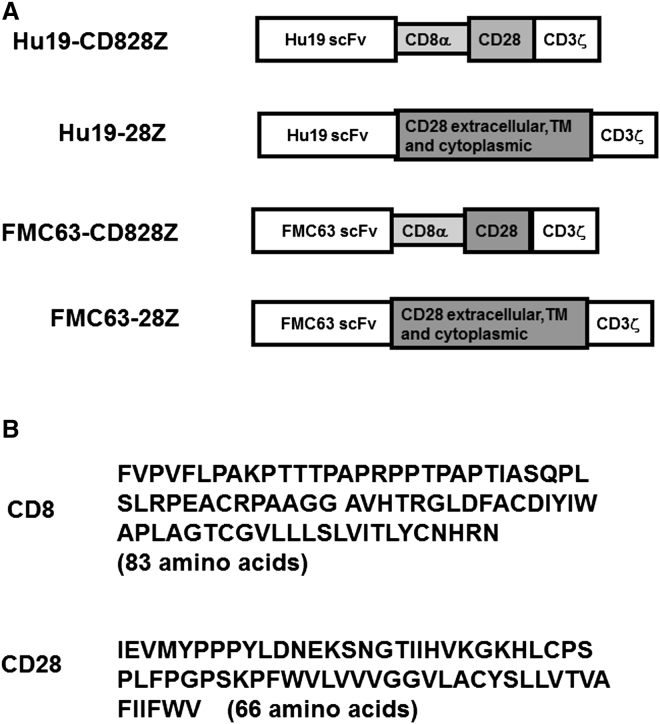
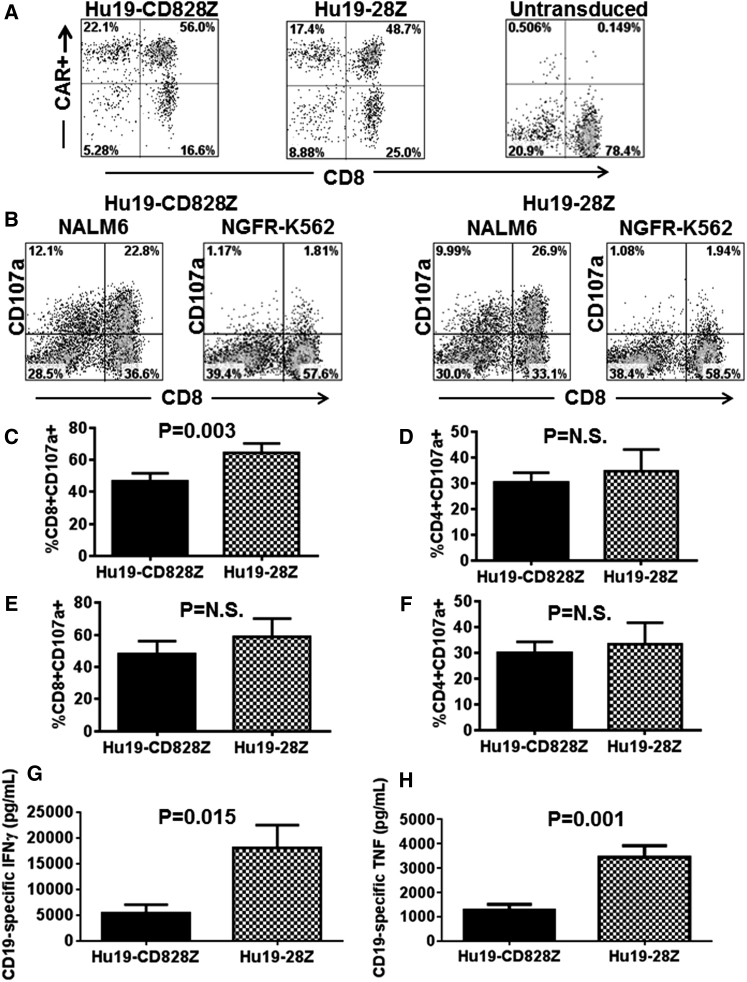
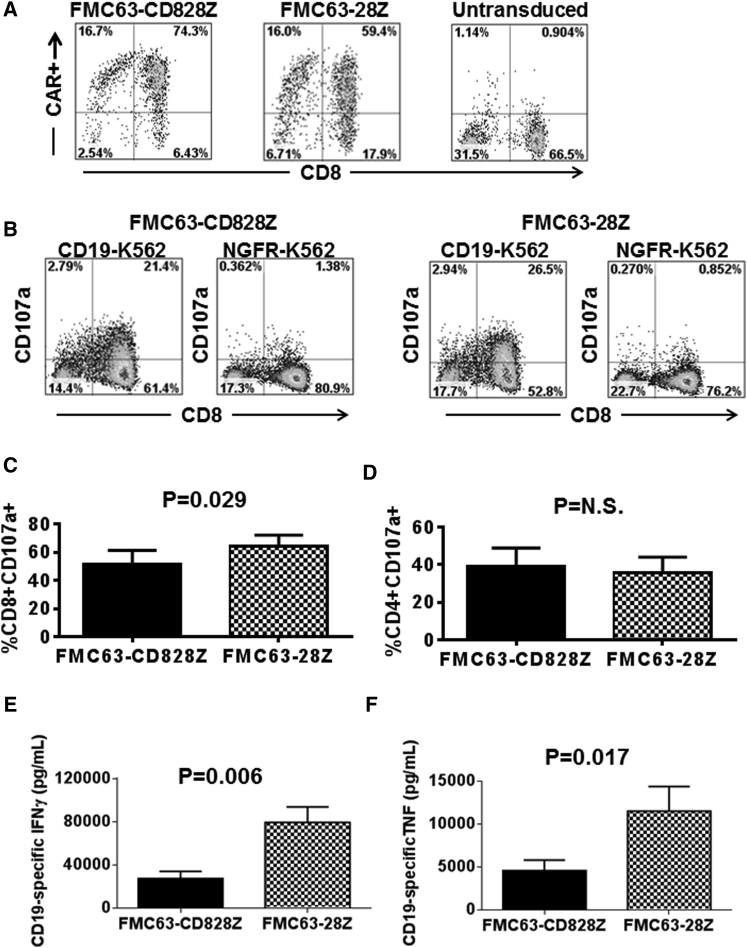
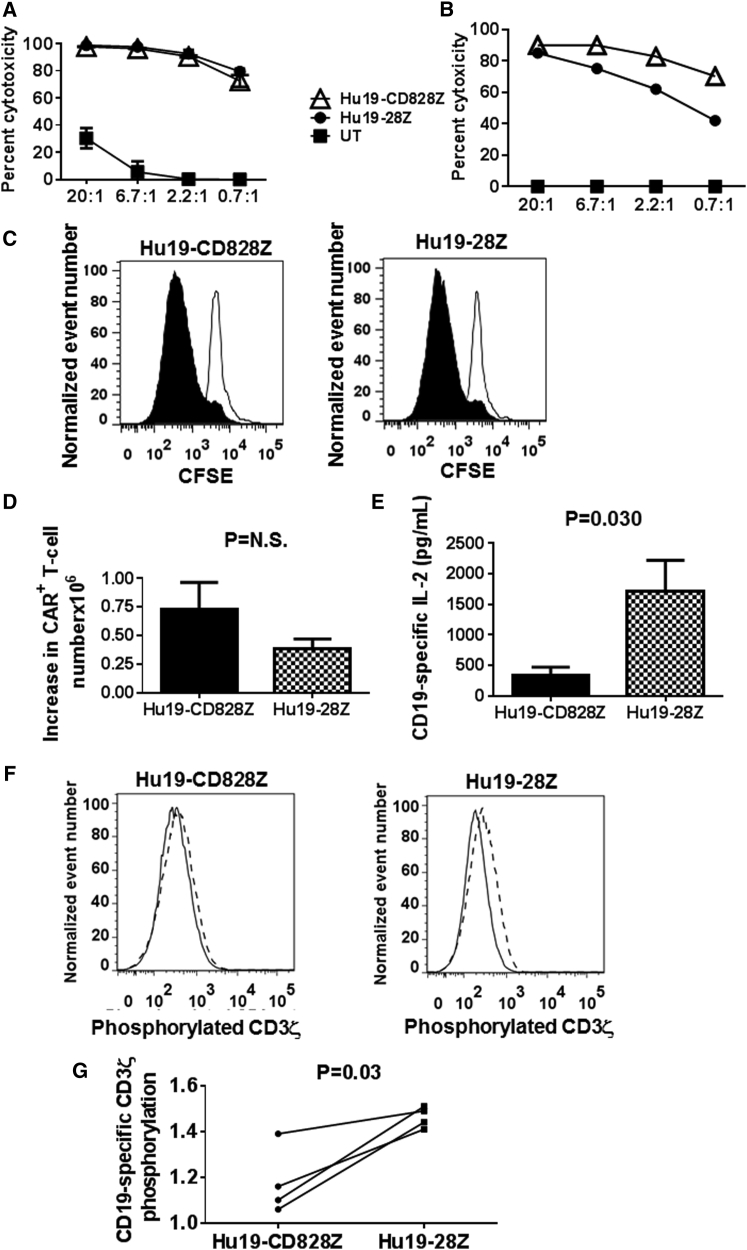
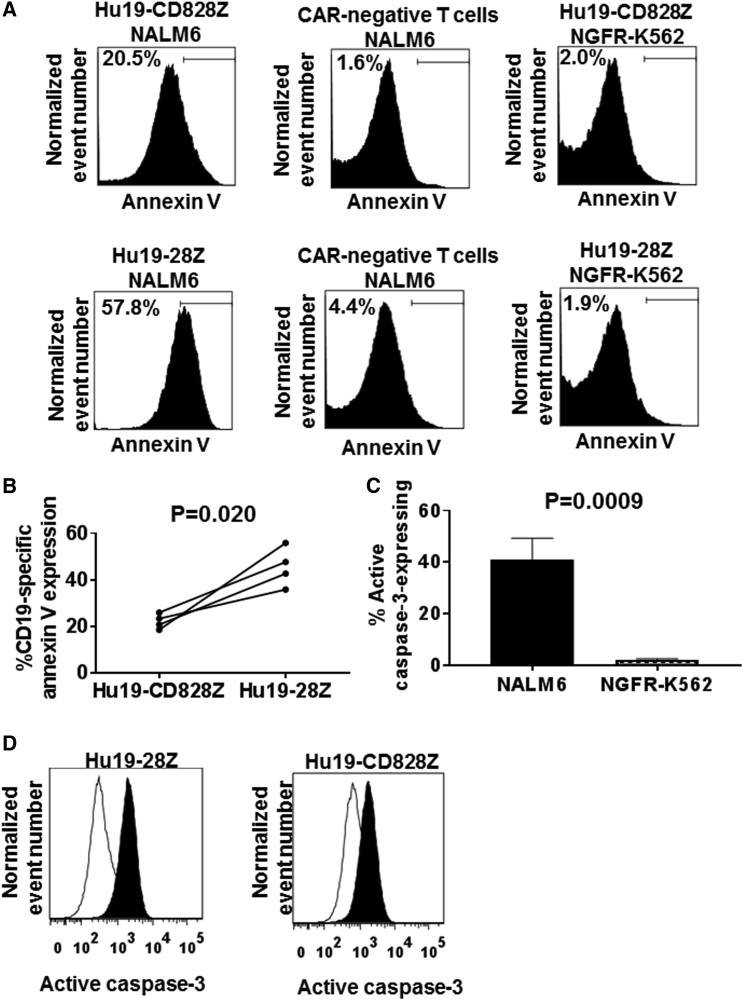
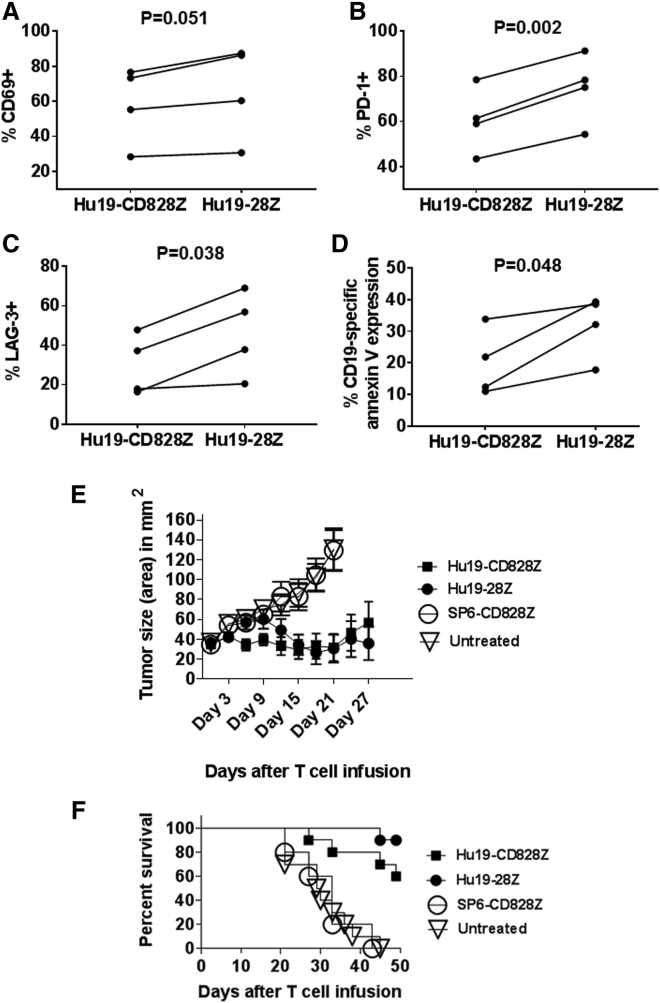
Anti-CD19 chimeric antigen receptor (CAR) T cells have caused remissions of B cell malignancies, but problems including cytokine-mediated toxicity and short persistence of CAR T cells in vivo might limit the effectiveness of anti-CD19 CAR T cells. Anti-CD19 CARs that have been tested clinically had single-chain variable fragments (scFvs) derived from murine antibodies. We have designed and constructed novel anti-CD19 CARs containing a scFv with fully human variable regions. T cells expressing these CARs specifically recognized CD19+ target cells and carried out functions including degranulation, cytokine release, and proliferation. We compared CARs with CD28 costimulatory moieties along with hinge and transmembrane domains from either the human CD28 molecule or the human CD8α molecule. Compared with T cells expressing CARs with CD28 hinge and transmembrane domains, T cells expressing CARs with CD8α hinge and transmembrane domains produced lower levels of cytokines and exhibited lower levels of activation-induced cell death (AICD). Importantly, CARs with hinge and transmembrane regions from either CD8α or CD28 had similar abilities to eliminate established tumors in mice. In anti-CD19 CARs with CD28 costimulatory moieties, lower levels of inflammatory cytokine production and AICD are potential clinical advantages of CD8α hinge and transmembrane domains over CD28 hinge and transmembrane domains.

Keywords: T cell; chimeric antigen receptor; immunotherapy.


Figures

Figure 1
Figure 1
Anti-CD19 CARs with Either Human or Murine scFvs Were Constructed (A) Schematics of all CARs studied are shown. Two anti-CD19 CARs incorporating fully human human variable regions were constructed and designated Hu19-CD828Z and Hu19-28Z. Hu19-CD828Z contained the Hu19 scFv, the extracellular hinge region of the human CD8α molecule, the transmembrane (TM) region of CD8α, the entire intracellular region of human CD28, and the CD3ζ T cell activation domain. Hu19-28Z included the Hu19 scFv, the extracellular hinge portion of human CD28, the transmembrane region of CD28, the entire intracellular region of CD28, and the CD3ζ T cell activation domain. The FMC63-CD828Z CAR had the same structure as Hu19-CD828Z except for substitution of the murine FMC63 scFv for the human Hu19 scFv. The FMC63-28Z CAR had the same structure as Hu19-28Z except for substitution of the murine FMC63 scFv for the human Hu19 scFv. (B) The amino acid sequence of the human CD8α extracellular and transmembrane regions had 83 amino acids. The amino acid sequence of the human CD28 extracellular and transmembrane regions included 66 amino acids.
Figure 2
Figure 2
Hu19-CD828Z and Hu19-28Z Were Compared Functionally (A) T cells from the same donor were transduced with either Hu19-CD828Z or Hu19-28Z. Hu19-CD828Z and Hu19-28Z had similar expression levels on the surface of T cells as measured by protein L staining. Protein L staining of untransduced T cells is also shown. Similar results were obtained in ten different experiments. (B) T cells expressing Hu19-CD828Z or Hu19-28Z were stimulated with either CD19+ NALM6 cells or CD19-negative NGFR-K562 cells, and the CD19-specific increase in CD107a was assessed as a measure of degranulation. Plots are gated on live CD3+ lymphocytes. T cells from five different donors were transduced with either Hu19-CD828Z or Hu19-28Z. (C and D) CD19-specific degranulation of (C) CD8+ T cells or (D) CD4+ T cells expressing the different CARs was compared by measuring CD107a expression in response to NALM6 or NGFR-K562 cells as described in (B). The results shown are the percentages of the T cells expressing CD8+ or CD4+ that degranulated. (E and F) T cells from five different donors were transduced with either Hu19-CD828Z or Hu19-28Z, and CD19-specific degranulation of (E) CD8+ T cells or (F) CD4+ T cells was compared and analyzed as in C except that primary CLL cells were used as the CD19+ target cells. For (C), (D), (E), and (F), CD19-specific degranulation was defined as the fraction of CD107a+ T cells after CD19+ target cell stimulation minus the fraction of CD107a+ T cells after NGFR-K562 stimulation, and CD107a expression was normalized for differences in CAR expression between Hu19-CD828Z and Hu19-28Z. For (C), (D), (E), and (F), CD19-specific degranulation with the different CARs was compared using two-tailed paired t tests, and the mean and SEM of all groups are shown. (G) T cells from five different donors were transduced with either Hu19-CD828Z or Hu19-28Z. The transduced T cells were cultured with either CD19+ NALM6 cells or CD19-negative NGFR-K562 cells overnight, and an ELISA was performed. CD19-specific IFN-γ production was calculated as the IFN-γ production with NALM6 stimulation minus IFN-γ production with NGFR-K562 stimulation. (H) T cells from five different donors were transduced with either Hu19-CD828Z or Hu19-28Z. The transduced T cells were cultured with either CD19+ NALM6 cells or CD19-negative NGFR-K562 cells overnight, and CD19-specific TNF-α production was calculated as the TNF-α production with NALM6 stimulation minus TNF-α production with NGFR-K562 stimulation. For both (G) and (H), the mean and SEM of each group are shown, and cytokine values were normalized to correct for differences in expression of the different CARs on the T cells of each donor. The groups were compared using two-tailed paired t tests.
Figure 3
Figure 3
Compared with T Cells Expressing FMC63-CD828Z, T Cells Expressing FMC63-28Z Produced Higher Levels of Inflammatory Cytokines (A) T cells from the same donor were transduced with either FMC63-CD828Z or FMC63-28Z. The FMC63-CD828Z and FMC63-28Z CARs had similar expression levels on the surface of T cells as measured by anti-fab staining. Anti-fab staining of untransduced T cells is also shown. (B) T cells expressing either FMC63-CD828Z or FMC63-28Z were stimulated with either CD19+ CD19-K562 cells or CD19-negative NGFR-K562 cells. The CD19-specific increase in CD107a was assessed as a measure of degranulation. Plots are gated on live CD3+ lymphocytes. (C) T cells from five different donors were transduced with either FMC63-CD828Z or FMC63-28Z, and CD19-specific degranulation of CD8+ T cells was compared in CD107a degranulation assays that were performed as described in (B). CD19-specific degranulation was calculated as the fraction of CD8+CD107a+ T cells after CD19-K562 stimulation minus the fraction of CD8+CD107a+ T cells after NGFR-K562 stimulation. CD107a expression was normalized for differences in CAR expression between FMC63-CD828Z and FMC63-28Z. For (C) and (D), different groups were compared using a two-tailed paired t test, and the mean and SEM of each group are shown. (D) T cells from five different donors were transduced with either FMC63-CD828Z or FMC63-28Z, and CD19-specific degranulation of CD4+ T cells was compared in CD107a degranulation assays that were performed and analyzed as in (C). (E) T cells from five different donors transduced with either FMC63-CD828Z or FMC63-28Z were cultured together with either CD19+ CD19-K562 cells or CD19-negative NGFR-K562 cells overnight. An ELISA was performed, and CD19-specific IFN-γ production was calculated as the IFN-γ production with CD19-K562 stimulation minus IFN-γ production with NGFR-K562 stimulation. (F) T cells from five different donors were transduced with either FMC63-CD828Z or FMC63-28Z. The transduced T cells were cultured together with either CD19-K562 cells or NGFR-K562 cells overnight, and CD19-specific TNF-α production was calculated as the TNF-α production with CD19-K562 stimulation minus TNF-α production with NGFR-K562 stimulation. For both (E) and (F), the mean and SEM of each group is shown, and cytokine values were normalized to correct for differences in expression of the different CARs on the T cells of each donor. Also for (E) and (F), the groups were compared using two-tailed paired t tests.
Figure 4
Figure 4
CD3ζ Phosphorylation, T Cell Proliferation, and IL-2 Release with Hu19-CD828Z versus Hu19-28Z (A) T cells from the same donor were transduced with either Hu19-CD828Z or Hu19-28Z or left untransduced, and a 4 hr cytotoxicity assay was performed with Toledo CD19+ lymphoma cell line cells as target cells. Error bars represent SEM. (B) Primary chronic lymphocytic leukemia cells were used as target cells in a 4 hr cytotoxicity assay comparing Hu19-CD828Z and Hu19-28Z. The numbers on the x-axes in both (A) and (B) are the effector to target ratios. (C) CFSE-labeled T cells from the same donor expressing either Hu19-CD828Z or Hu19-28Z were cultured for 4 days with irradiated CD19-K562 (filled histograms) or NGFR-K562 (open histograms). The degree of proliferation was similar for T cells expressing the different CARs; this was a representative example of six different donors. The plots are gated on live CD3+CAR+ lymphocytes. (D) T cells from six different donors were transduced with either Hu19-CD828Z or Hu19-28Z. The T cells were cultured, transduced, and labeled with CFSE as in (C). The mean increases in the numbers of CAR+ T cells during the 4-day culture are shown for T cells expressing each CAR. The increases in CAR T cell numbers were calculated as the number of CAR+ T cells on day 4 of culture minus the number of CAR+ T cells at the start of the cultures. Error bars represent SEM. (E) T cells from six different donors expressing either Hu19-CD828Z or Hu19-28Z were cultured together with either CD19+ NALM6 cells or CD19-negative NGFR-K562 cells overnight, and an ELISA for IL-2 was performed. CD19-specific IL-2 production was calculated as the IL-2 production with NALM6 stimulation minus IL-2 production with NGFR-K562 stimulation. The mean and SEM of each group are shown. IL-2 values were normalized to correct for differences in expression of the different CARs on the T cells of each donor. The groups were compared using a two-tailed paired t test. (F) T cells from four patients were transduced with either Hu19-CD828Z or Hu19-28Z. The cells were sorted to obtain pure populations of CAR+ T cells expressing either Hu19-CD828Z or Hu19-28Z. The T cells were stimulated with either CD19+ NALM6 cells or CD19-negative NGFR-K562 cells. The level of phosphorylation of tyrosine-142 in an immune receptor tyrosine-based activation motif (ITAM) of the CD3ζ molecules of the T cells (CD19-specific CD3ζ phosphorylation) was then assessed by intracellular flow cytometry. Representative examples of the flow cytometry staining for Hu19-CD828Z and Hu19-28Z are shown. The solid-line histograms show the level of phosphorylated CD3ζ on T cells stimulated with NGFR-K562. The histograms with dashed borders show the level of phosphorylated CD3ζ on T cells stimulated with NALM6. (G) CD19-specific CD3ζ phosphorylation of T cells from four patients was calculated by dividing the median fluorescence intensity of phosphorylated CD3ζ tyrosine-142 staining after NALM6 stimulation by the median fluorescence intensity of phosphorylated CD3ζ tyrosine-142 staining after NGFR-K562 stimulation. The level of CD19-specific CD3ζ phosphorylation was lower in T cells expressing Hu19-CD828Z than in T cells expressing Hu19-28Z. Groups were compared with a two-tailed paired t test.
Figure 5
Figure 5
Levels of Activation-Induced Cell Death Were Lower in Hu19-CD828Z-Expressing T Cells Than in Hu19-28Z-Expressing T Cells (A) T cells from the same donor were transduced with either Hu19-CD828Z or Hu19-28Z and cultured overnight with either CD19+ NALM6 cells or CD19-negative NGFR-K562 cells. The cells were then stained with annexin V to detect apoptotic T cells. The top row of plots shows T cells transduced with Hu19-CD828Z. The bottom row of plots shows T cells transduced with Hu19-28Z. These T cell cultures contained both CAR-expressing T cells and CAR-negative T cells. The top label above each plot gives the status of CAR expression of the T cells shown on the plot. The lower label above each plot gives the target cell that the T cells were cultured with. After culture with CD19+ NALM6 cells, a smaller fraction of Hu19-CD828Z-expressing T cells than Hu19-28Z-expressing T cells expressed annexin V. (B) T cells from 4 donors were transduced with either Hu19-CD828Z or Hu19-28Z and cultured overnight with either NALM6 cells or NGFR-K562 cells. Annexin V staining assays were performed as described in (A). Compared with T cells expressing Hu19-28Z, T cells expressing Hu19-CD828Z had a lower percentage CD19-specific annexin V expression. The percentage CD19-specific annexin V expression was calculated as the percentage CD3+ CAR+ annexin V+ cells with NALM6 stimulation minus the percentage CD3+ CAR+ annexin V+ cells with NGFR-K562 cell stimulation. Paired results of T cells from each patient transduced with either Hu19-CD828Z or Hu19-28Z are connected by a line. Experiments were conducted with cells from four different patients. Comparison was made using a two-tailed paired t test. (C) CAR T cells were stimulated with either CD19+ NALM6 cells or CD19-negative NGFR-K562 cells overnight, and the CAR T cells were assessed for active caspase-3 expression by intracellular flow cytometry. Results for cells from six different donors are included. For each donor, T cells transduced with Hu19-CD828Z and T cells expressing Hu19-28Z were included on this graph, so a total of 12 different cell T cell populations were included. For all 12 T cell populations, active caspase-3 levels increased with CD19-K562 stimulation compared with NGFR-K562 stimulation. The paired two-tailed t test was used. Error bars represent SEM. (D) Active caspase-3 expression was higher in CAR T cells cultured overnight with CD19+ NALM6 cells (filled histograms) than in T cells cultured with NGFR-K562 cells (open histograms). For both (C) and (D), live CD3+CAR+ T cells were assessed.
Figure 6
Figure 6
After In Vitro Stimulation with CD19+ Target Cells, T Cells Expressing Hu19-CD828Z Undergo Less AICD Than T Cells Expressing Hu19-28Z, and T Cells Expressing Either Hu19-CD828Z or Hu19-28Z Can Eliminate Established Tumors in Mice (A–C) T cells from four different donors were transduced with either Hu19-CD828Z or Hu19-28Z. The T cells were stimulated with irradiated CD19+ CD19-K562 cells on day 7 and day 10 after initiation of the cultures. On day 12 after culture initiation, flow cytometry was performed to measure CD69 (A), PD-1 (B), and LAG-3 (C) expression on CD3+CAR+ T cells. (D) T cells from 4 different donors were transduced with either Hu19-CD828Z or Hu19-28Z. The T cells were stimulated with irradiated CD19-K562 cells on day 7 and day 10 after initiation of the cultures. On day 12 after culture initiation, the T cells were cultured overnight with either NALM6 or NGFR-K562 target cells and annexin V staining was conducted. The percentage CD19-specific annexin V expression was calculated as the percentage CD3+ CAR+ annexin V+ cells with NALM6 stimulation minus the percentage CD3+ CAR+ annexin V+ cells with NGFR-K562 stimulation. For (A)–(D), paired results of T cells from each of four patients are connected by a line. Comparison was made using a two-tailed paired t test. (E) NALM6 tumors were established in immunocompromised NSG mice. The mice then received infusions of 8 million T cells transduced with Hu19-CD828Z or Hu19-28Z or the negative-control CAR SP6-CD8Z. A fourth group of mice was left untreated. Tumors were measured every 3 days in a blinded manner. Combined results of two separate experiments that used cells from two different human donors are shown. There was a total of ten mice in each group except the SP6-CD828Z group, which had five mice. The graphs show the mean tumor size ± SEM for each time point. (F) Survival of the same mice as in Figure 5E is shown. By the log rank test, there was a statistically significant difference in survival between mice receiving T cells that expressed Hu19-CD828Z versus SP6-CD828Z (p = 0.003). There was also a statistically significant difference in survival between mice receiving T cells that expressed Hu19-28Z versus SP6-CD828Z (p < 0.0001). There were statistically significant differences in survival between mice receiving T cells expressing either Hu19-CD828Z (p = 0.0005) or Hu19-28Z (p < 0.0001) versus untreated mice. There was not a statistically significant difference in survival by the log rank test when mice receiving T cells expressing Hu19-CD828Z or Hu19-28Z were compared (p = 0.12).
Figure 7
Figure 7
Hypothesized Models of the CD28 and CD8a Hinge Regions (A) The immunoglobulin domains of the CD28 homodimeric structure are shown in blue and gray. The C-terminal tail was modeled to add additional residues on the basis of high sequence identity and structural homology with CTLA-4. The residues interacting at the dimer interface within the CAR hinge are shown as orange sticks and spheres. (B) The immunoglobulin domains of the CD8α homodimer are shown in yellow and cyan. The residues included in the hinge domain are shown in black with spheres (FVPVFLPA). The region of the CD8α hinge domain is not hypothesized to strongly contribute to dimerization.

Similar articles

Cited by

References

    1. Dotti G., Gottschalk S., Savoldo B., Brenner M.K. Design and development of therapies using chimeric antigen receptor-expressing T cells. Immunol. Rev. 2014;257:107–126. - PMC - PubMed
    1. Jensen M.C., Riddell S.R. Designing chimeric antigen receptors to effectively and safely target tumors. Curr. Opin. Immunol. 2015;33:9–15. - PMC - PubMed
    1. Kochenderfer J.N., Rosenberg S.A. Treating B-cell cancer with T cells expressing anti-CD19 chimeric antigen receptors. Nat. Rev. Clin. Oncol. 2013;10:267–276. - PMC - PubMed
    1. Sadelain M. CAR therapy: the CD19 paradigm. J. Clin. Invest. 2015;125:3392–3400. - PMC - PubMed
    1. Eshhar Z., Waks T., Gross G., Schindler D.G. Specific activation and targeting of cytotoxic lymphocytes through chimeric single chains consisting of antibody-binding domains and the gamma or zeta subunits of the immunoglobulin and T-cell receptors. Proc. Natl. Acad. Sci. U S A. 1993;90:720–724. - PMC - PubMed

Publication types

MeSH terms