. 2017 Nov;187(11):2473-2485.
doi: 10.1016/j.ajpath.2017.07.005. Epub 2017 Aug 12.

Thyroid Hormone Receptor-β Agonist GC-1 Inhibits Met-β-Catenin-Driven Hepatocellular Cancer

Affiliations

Thyroid Hormone Receptor-β Agonist GC-1 Inhibits Met-β-Catenin-Driven Hepatocellular Cancer

Elisabetta Puliga et al. Am J Pathol. 2017 Nov.

Abstract

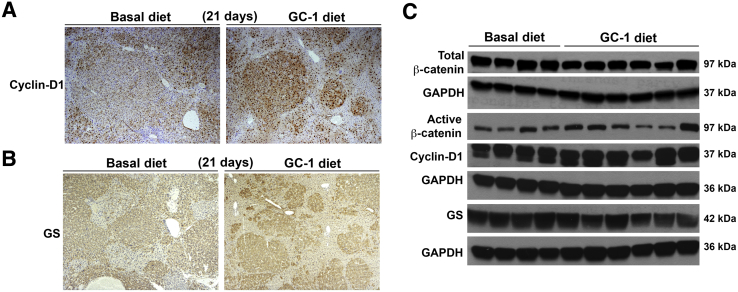
The thyromimetic agent GC-1 induces hepatocyte proliferation via Wnt/β-catenin signaling and may promote regeneration in both acute and chronic liver insufficiencies. However, β-catenin activation due to mutations in CTNNB1 is seen in a subset of hepatocellular carcinomas (HCC). Thus, it is critical to address any effect of GC-1 on HCC growth and development before its use can be advocated to stimulate regeneration in chronic liver diseases. In this study, we first examined the effect of GC-1 on β-catenin-T cell factor 4 activity in HCC cell lines harboring wild-type or mutated-CTNNB1. Next, we assessed the effect of GC-1 on HCC in FVB mice generated by hydrodynamic tail vein injection of hMet-S45Y-β-catenin, using the sleeping beauty transposon-transposase. Four weeks following injection, mice were fed 5 mg/kg GC-1 or basal diet for 10 or 21 days. GC-1 treatment showed no effect on β-catenin-T cell factor 4 activity in HCC cells, irrespective of CTNNB1 mutations. Treatment with GC-1 for 10 or 21 days led to a significant reduction in tumor burden, associated with decreased tumor cell proliferation and dramatic decreases in phospho-(p-)Met (Y1234/1235), p-extracellular signal-related kinase, and p-STAT3 without affecting β-catenin and its downstream targets. GC-1 exerts a notable antitumoral effect on hMet-S45Y-β-catenin HCC by inactivating Met signaling. GC-1 does not promote β-catenin activation in HCC. Thus, GC-1 may be safe for use in inducing regeneration during chronic hepatic insufficiency.


Figures

Figure 1
Figure 1
GC-1 does not influence β-catenin–T cell factor 4 activity as evident by TopFlash reporter assay in liver tumor cell lines. Bar graph shows insignificant differences in TopFlash luciferase reporter activity in Hep3B cells (with wild-type CTNNB1 gene) (A), Snu-389 cells (have exon-3 point-mutant CTNNB1 gene) (C), and HepG2 cells (have exon-3 deletion–mutant CTNNB1 gene) (E) treated with dimethyl sulfoxide (DMSO) or 7 μmol/L GC-1. Each well for the treatment groups is indicated by a closed circle (DMSO) or closed square (GC-1). Lack of TopFlash reporter response to GC-1 in Hep3B (B), Snu-398 (D), and HepG2 (F) cells is depicted as fold-change to DMSO treatment.
Figure 2
Figure 2
hMet-mutant-β-catenin–injected mice fed a GC-1 diet for 3 weeks, develop lesser hepatocellular carcinomas than controls. A: Schematic showing the timing of GC-1 or basal diet administration and animal sacrifice in reference to the hydrodynamic tail vein injection of sleeping beauty transposon/transposase plasmids. B: RT-PCR using RNA isolated from livers shows around 40-fold increase in gene expression of deiodinase (DIOI) after 21 days of the GC-1 diet as compared to the basal diet. C: An almost significant (P = 0.0506) difference in liver weight/body weight (LW/BW × 100) is observed after 21 days of the GC-1 diet as compared to the basal diet, suggesting a decrease in tumor burden. Individual animals in each group are indicated by a closed circle or closed square. D: Representative gross liver images from 21 days of GC-1 diet–fed versus basal diet–fed animals show lesser nodularity and tumor burden in the GC-1 group. n = 7 (C, GC-1 diet); n = 8 (C, basal diet). ***P < 0.001 versus the basal diet.
Figure 3
Figure 3
Decreased tumor size in hMet-mutant-β-catenin model following 21 days of GC-1 reflected by histology and reduced Myc-tag, without any change in cell death. A: Representative hematoxylin and eosin (H&E)-stained sections show relatively fewer and smaller microscopic hepatic tumor nodules in GC-1–treated group at 21 days. B: Representative immunohistochemically stained image for Myc-tag shows smaller hepatic tumor nodules at 21 days of GC-1 treatment versus controls. C: Representative Western blot shows a modest decrease in overall levels of Myc-tag, which supports an overall lower tumor burden after 21 days of GC-1 treatment. Glyceraldehyde-3-phosphate dehydrogenase (GAPDH) shows comparable loading. D: A modestly higher number of terminal deoxynucleotidyl transferase-mediated dUTP nick-end labeling (TUNEL)–positive nuclei within the tumor foci were evident in the control diet–fed group versus GC-1 diet–fed mice, likely due to larger size of tumor nodules. Original magnification: ×50 (A, B, and D).
Figure 4
Figure 4
Continued proliferation in smaller tumor nodules following 21 days of GC-1 treatment as shown by numbers of cells in S-phase. A: Scattered Ki-67–positive cells in large tumor nodules in liver sections of basal diet–fed mice. Although tumor nodules are smaller in the GC-1–treated group, several cells continue to be Ki-67 positive within tumor foci. B: Quantification of Ki-67 staining shows a comparable percentage of Ki-67–positive tumor cells within foci in the control diet and GC-1 diet–fed mice. Nontumor tissues in both groups also show insignificant differences in Ki-67 positivity. Each color represents counts from one animal. Original magnification, ×50 (A).
Figure 5
Figure 5
β-Catenin signaling in tumor-bearing livers remains unaffected after 21 days of GC-1 treatment. A: A representative section from the liver of hMet-β-catenin mice fed 21 days with GC-1 or basal diet and stained for cyclin-D1 shows comparably positive staining although the tumor foci are smaller after GC-1 treatment. B: A representative immunohisctochemically stained image for glutamine synthetase (GS) shows GS-positive tumor nodules in both the GC-1 and the basal diet groups, although, the foci are notably smaller in GC-1 group. C: No change in levels of total β-catenin, active-β-catenin, or cyclin-D1, and a marginal decrease in total GS levels by representative Western blot, following 21 days of GC-1 treatment, suggests no change in Wnt/β-catenin signaling. Glyceraldehyde-3-phosphate dehydrogenase (GAPDH) shows comparable loading. Original magnification: ×50 (A and B).
Figure 6
Figure 6
GC-1 treatment of hMet-mutant-β-catenin mice for 21 days leads to marked inhibition of Met signaling. A: A profound decrease in p-Met (Y1234/Y1235) is observed by Western blot (WB) analysis using whole-liver lysates from GC-1–treated mice versus basal diet controls. A marginal, but variable, decrease in total Met is also evident in this group. Glyceraldehyde-3-phosphate dehydrogenase (GAPDH) shows comparable loading. B: Another representative WB shows lack of p-Met (Y1234/1235) along with a dramatic decrease in downstream p-ERK1 (T202) and p-ERK2 (Y204) in GC-1–treated liver lysates. Total ERK1/2 levels are modestly decreased as well. GAPDH shows comparable loading. C: A representative WB shows no change in p-AKT levels, whereas total AKT levels are marginally increased after GC-1 treatment. However, although total STAT3 levels are relatively unaltered, a notable decrease in p-STAT3 (Y705) is clearly noticeable after 21 days of GC-1 treatment. GAPDH verified comparable protein loading.
Figure 7
Figure 7
hMet-mutant-β-catenin–injected mice fed a GC-1 diet for 10 days show significantly fewer tumors than controls. A: Schematic showing the timing of GC-1 or basal diet administration and animal sacrifice in reference to the hydrodynamic tail vein injection of sleeping beauty transposon/transposase plasmids. B: RT-PCR using RNA isolated from livers shows around 10-fold increase in gene expression of deiodinase (DIOI) after 10 days of the GC-1 diet as compared to the basal diet. C: A significant difference in liver weight/body weight (LW/BW × 100) is observed after 10 days of the GC-1 diet as compared to the basal diet suggesting a decrease in tumor burden. Individual animals in each group are indicated by a closed circle or closed square. D: Representative gross liver images from 10 days of GC-1– versus basal diet–fed animals show unremarkable differences in the two groups. n = 4 (C, GC-1 diet and basal diet). **P < 0.01, ***P < 0.001 versus the basal diet.
Figure 8
Figure 8
Decreased tumor volume in hMet-mutant-β-catenin model following 10 days of the GC-1 diet is not due to altered cell survival or inflammation. A: Representative hematoxylin and eosin (H&E)-stained sections show relatively fewer and smaller microscopic tumor foci evident as nodules composed of cells with basophilia, pyknotic nuclei, and greater nuclear to cytoplasmic ratio, in the 10-day GC-1 diet–fed group versus the basal diet group. Immunohistochemically stained image for Myc-Tag for the 10-day GC-1–treated group versus controls also shows smaller and fewer tumor foci. B: Comparable terminal deoxynucleotidyl transferase-mediated dUTP nick-end labeling (TUNEL)–positive nuclei within the tumor foci are evident in the 10-day control diet–fed group versus the GC-1 diet–fed mice. C: Comparable numbers of CD45-positive inflammatory cells are seen in both the basal diet and the GC-1 diet groups. Original magnification: ×50 (A and B); ×100 (C).
Figure 9
Figure 9
Decreased tumor volume in hMet-mutant-β-catenin model following 10 days of GC-1 diet is due to lower tumor cell proliferation. A: Immunohistochemically stained image for BrdU shows a dramatic decrease in the numbers of BrdU-positive cells after 10 days of GC-1 feeding as compared to controls. B: A notable decrease in the numbers of Ki-67–positive cells within tumor nodules is evident in the GC1-treated group versus controls. C: Quantification of Ki-67 staining shows a highly significant decrease in percentage of Ki-67–positive tumor cells in tumor foci in the 10-day GC-1 diet–fed mice as compared to the basal diet group. Nontumor tissues in both groups show insignificant differences in Ki-67 positivity. Each color represents counts from one animal. **P < 0.01, versus the basal diet. Original magnification: ×50 (A and B).
Figure 10
Figure 10
Ten days of GC-1 treatment does not impact Wnt signaling despite lowering tumor burden. A: Representative sections from the livers of hMet-β-catenin mice fed 10 days with a GC-1 or basal diet and stained for cyclin-D1 show comparably positive staining within tumor foci although the tumor foci are smaller in the GC-1 group. B: Representative immunohistochemically stained image for glutamine synthetase (GS) also shows GS-positive tumor nodules in both the GC-1 and basal diet groups, although the foci are notably smaller in the GC-1 group. C: Representative Western blot analysis shows a marginal decrease in overall levels of total β-catenin, cyclin-D1, and GS, but not active β-catenin, all supporting an overall lower tumor burden after 10 days of GC-1 treatment, but not a direct impact on Wnt/β-catenin signaling. Glyceraldehyde-3-phosphate dehydrogenase (GAPDH) shows comparable loading. Original magnification: ×50 (A and B).
Figure 11
Figure 11
Remarkable decrease in Met-ERK and Met-STAT3 signaling following 10 days of GC-1 treatment in hMet-mutant-β-catenin mice. A: A pronounced decrease in p-Met (Y1234/Y1235) is observed and validated by two independent antibodies by Western blot (WB) analysis using whole-liver lysates from 10-day GC-1–treated versus basal diet–fed hMet-mutant-β-catenin mice. A marginal decrease in total Met levels is evident in this group as well. Glyceraldehyde-3-phosphate dehydrogenase (GAPDH) shows comparable loading. B: A representative WB using total liver lysates shows a dramatic decrease in p-ERK1 (T202) and p-ERK2 (Y204), but not total ERK after 10 days of GC-1. GAPDH shows comparable loading. C: A representative WB shows no change in total AKT or p-AKT levels after 10 days of GC-1 treatment. Total STAT3 levels are overall reduced, whereas p-STAT3 (Y705) levels are drastically lower after 10 days of GC-1 treatment. GAPDH verified comparable protein loading.
Figure 12
Figure 12
Schematic of the disparate effect of GC-1 on β-catenin signaling in normal hepatocyte versus a liver tumor cell. Thyroid hormone receptor β agonist GC-1 induces β-catenin signaling in the normal hepatocyte by activating PKA-dependent ser675-phosphorylation (arrow) of β-catenin as well as by Wnt-dependent mechanisms (arrow). This leads to enhanced cyclin-D1 expression and hepatocyte proliferation, and may be applicable for regenerative therapies. However, in a tumor cell, GC-1 is unable to increase β-catenin activation (small diamond) irrespective of the CTNNB1 mutational status. In addition, it dramatically inhibits Met-ERK and Met-Stat3 phosphorylation to have a profound effect on tumor burden in hMet-mutant-β-catenin mice, which represents around 10% of all human HCC. Mut, mutated; p-, phospho-; WT, wild type.

References

    1. Huang Y.H., Tsai M.M., Lin K.H. Thyroid hormone dependent regulation of target genes and their physiological significance. Chang Gung Med J. 2008;31:325–334. - PubMed
    1. Alvarado T.F., Puliga E., Preziosi M., Poddar M., Singh S., Columbano A., Nejak-Bowen K., Monga S.P. Thyroid hormone receptor beta agonist induces beta-catenin-dependent hepatocyte proliferation in mice: implications in hepatic regeneration. Gene Expr. 2016;17:19–34. - PMC - PubMed
    1. Baxi E.G., Schott J.T., Fairchild A.N., Kirby L.A., Karani R., Uapinyoying P., Pardo-Villamizar C., Rothstein J.R., Bergles D.E., Calabresi P.A. A selective thyroid hormone beta receptor agonist enhances human and rodent oligodendrocyte differentiation. Glia. 2014;62:1513–1529. - PMC - PubMed
    1. Baxter J.D., Webb P. Thyroid hormone mimetics: potential applications in atherosclerosis, obesity and type 2 diabetes. Nat Rev Drug Discov. 2009;8:308–320. - PubMed
    1. Chi H.C., Chen C.Y., Tsai M.M., Tsai C.Y., Lin K.H. Molecular functions of thyroid hormones and their clinical significance in liver-related diseases. Biomed Res Int. 2013;2013:601361. - PMC - PubMed

MeSH terms