. 2017 Nov 1:161:67-79.
doi: 10.1016/j.neuroimage.2017.08.028. Epub 2017 Aug 12.

Cortical representation of persistent visual stimuli

Affiliations

Cortical representation of persistent visual stimuli

Edden M Gerber et al. Neuroimage. .

Abstract

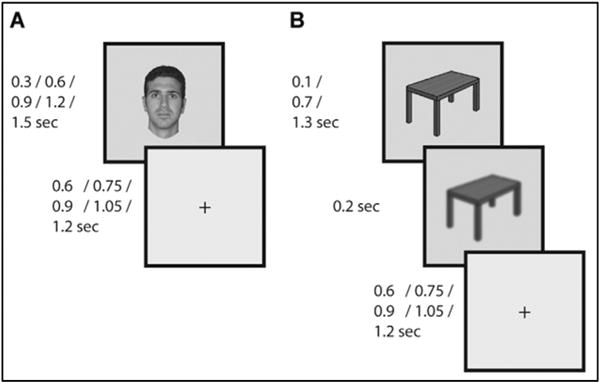
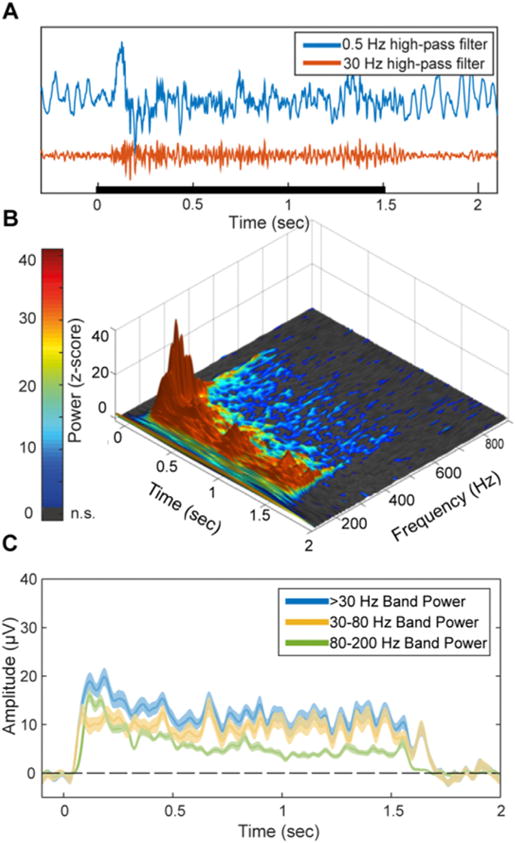
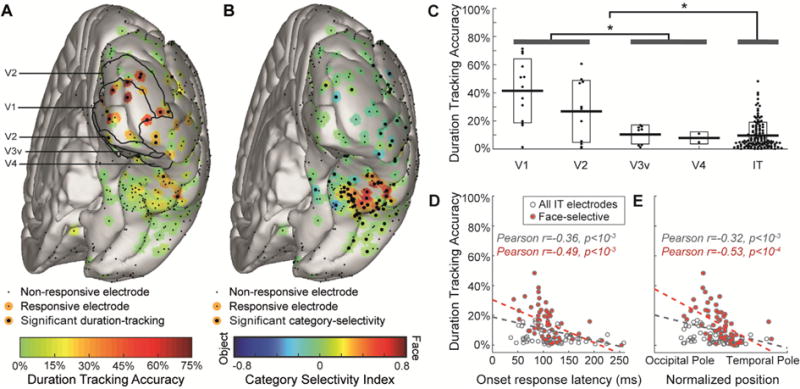
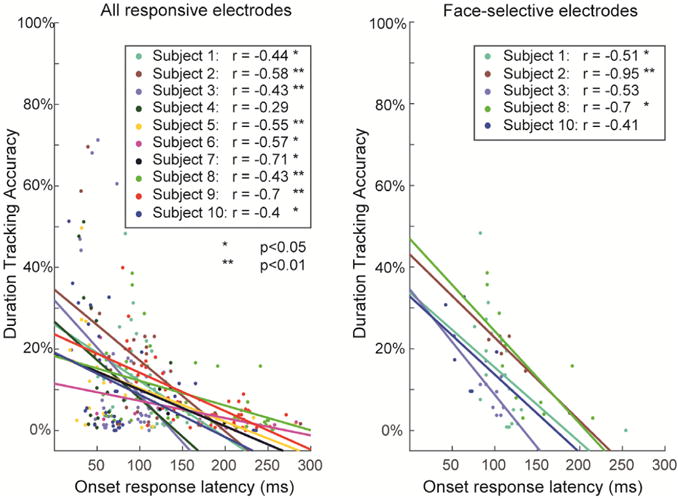
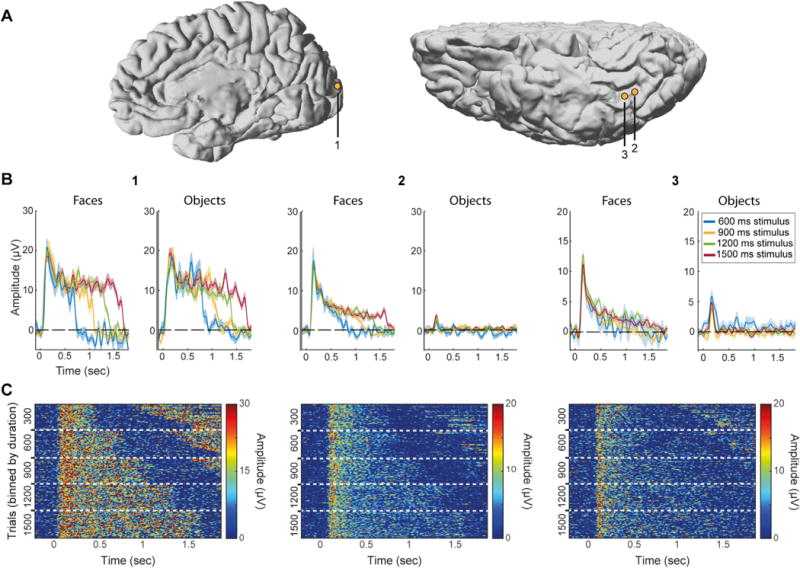
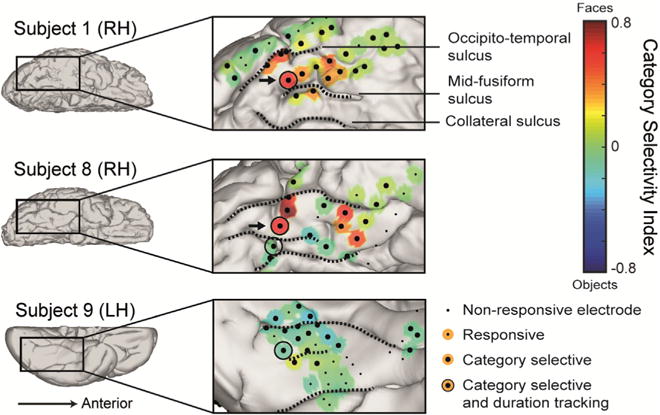
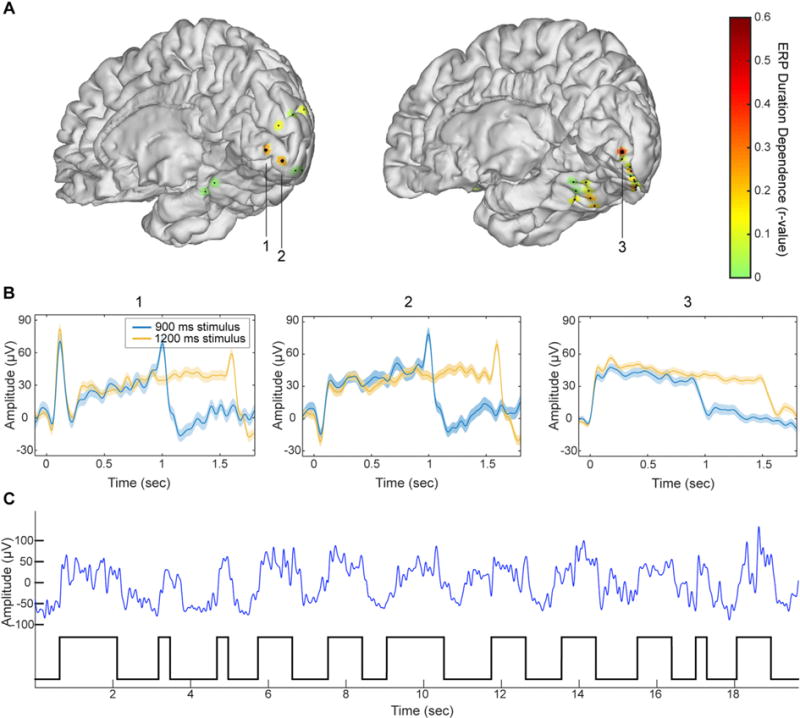
Research into visual neural activity has focused almost exclusively on onset- or change-driven responses and little is known about how information is encoded in the brain during sustained periods of visual perception. We used intracranial recordings in humans to determine the degree to which the presence of a visual stimulus is persistently encoded by neural activity. The correspondence between stimulus duration and neural response duration was strongest in early visual cortex and gradually diminished along the visual hierarchy, such that is was weakest in inferior-temporal category-selective regions. A similar posterior-anterior gradient was found within inferior temporal face-selective regions, with posterior but not anterior sites showing persistent face-selective activity. The results suggest that regions that appear uniform in terms of their category selectivity are dissociated by how they temporally represent a stimulus in support of ongoing visual perception, and delineate a large-scale organizing principle of the ventral visual stream.

Keywords: Early visual cortex; Electrocorticography; Fusiform face area; High-frequency activity; Inferior temporal cortex; Sustained perception; Visual cortex.


Conflict of interest statement

The authors declare no competing financial interests.

Figures

Fig. 1
Fig. 1. Experimental paradigm
(A) Images were presented for 300, 900, or 1500 ms (for 3 subjects also 600 or 1200 ms) with variable inter-stimulus interval (ISI) during which a fixation cross was presented. Subjects responded with a button press to presentation of targets (clothing images; 10% of trials). (B) Dual-task control. This task was identical to the first except that subjects also had to respond to rare blurring of the image in the last 200 ms of its presentation.
Fig. 2
Fig. 2. Representative spectral response profile
(A) The high-frequency response is evident in raw single trials. Blue and Red traces correspond to 0.5 Hz and 30 Hz high-pass filtered traces respectively of a single trial from an early visual cortex (V1/V2) electrode. Black bar indicates the stimulus duration. (B) Time-frequency response to 1500 ms visual stimuli averaged across both categories, in the same electrode. Z-axis and color scale represent z-score of the power at each time-frequency data point as normalized by the baseline for the same frequency band. Since both the baseline and response spectra are dominated by a 1/f power law in terms of mean power and variance, this normalization makes it possible to observe relative modulations in high-frequency bands which are otherwise too small in comparison to lower frequencies. Gray pixels represent non-significant z-score values (p < 0.05, uncorrected). Note that while the early response components contain higher power at high frequencies, the upper bound of significantly above-baseline activity is roughly fixed at 400–500 Hz throughout the activity time course, implying a general attenuation of the response over time rather than a narrowing of the response bandwidth. (C) Amplitude of band-limited activity in three frequency bands for the same electrode. Shading corresponds to standard error. While including lower frequencies increases the response SNR, all subsets of the high-frequency range produce a qualitatively similar response pattern, suggesting that the underlying activity is indeed broadband.
Fig. 3
Fig. 3. Duration-tracking accuracy decreases gradually along the ventral visual stream
(A) Duration-tracking accuracy for all subjects’ electrodes projected onto a common brain template. Visually responsive electrodes are surrounded by a color patch representing duration-tracking accuracy. Significant duration-tracking (FDR corrected, q = 0.05) is denoted by a thicker black dot. Anatomical regions marked with black contour lines within EVC are based on surface registration to a probabilistic atlas (Wang et al., 2014). (B) Same as (A), but for category selectivity index. Negative values (blue) correspond to object-preference. (C) Relation between duration-tracking and hierarchical position along the ventral stream (EVC areas defined based on the probabilistic atlas). Each dot corresponds to a single electrode, with horizontal dispersion based on data point density. Boxes correspond to standard deviation. Asterisks mark significant difference (p < 0.05) between EVC areas and IT and between V1/V2 and V3v/V4. Note that V3v/V4 sites are not necessarily earlier than all IT sites in terms of response latency. (D) duration-tracking within IT plotted against onset response latency, as a proxy for hierarchical position along the ventral stream. Face selective electrodes are marked red. (E) Same as (D), with hierarchical position measured as the electrode’s coordinate along the occipital-temporal axis.
Fig. 4
Fig. 4. Single subject correlations
To verify that the negative gradient of duration-tracking accuracy is not driven by differences between subjects (i.e. to verify that tracking accuracy and position along the ventral stream are correlated within subjects, rather than that subjects with more posterior coverage have generally higher duration-tracking), we fitted a mixed-effect linear regression model to the single-trial duration-tracking data. The binomial result of each trial in each electrode (accurate/inaccurate response duration) was used as the dependent variable, and either the electrodes’ onset response latency, or its posterior-anterior position was used as an independent variable, with random intercepts and slopes for each subject and random intercepts for individual trials. The continuous measures of latency and anatomical position were used as the independent variables for the analysis of electrodes across all visual areas rather than region labels, because there were not sufficient data for the model to converge with an ordinal independent variable. The results indicated a significant fixed effect for both latency and position for all responsive electrodes, all right-hemisphere IT electrodes, all right-hemisphere face-selective electrodes, and all right-hemisphere object selective electrodes. Left panel: data points for all responsive electrodes divided by subject, and subject-specific regression lines. Right panel: same for right-hemisphere IT face-selective electrodes. Mixed-effects analysis was performed using R (www.r-project.org) with the lme4 software package.
Fig. 5
Fig. 5. Three representative electrodes
Electrode 1 – Early visual cortex electrode (dorsal V2/V3 according to fMRI retinotopy performed on this subject for another study, see Parvizi et al., 2012), duration-tracking but not category-selective (trials pooled from both categories). Electrode 2 – Lateral fusiform gyrus electrode with sustained activity that is both duration-tracking and category-selective. Electrode 3 – Slightly anterior to electrode 2 on the lateral fusiform gyrus, category-selective but not duration-tracking. MNI coordinates for the three electrode are (9.4, 94.8, 12.7), (37.6, 29.5, 11.1), (39.1, 25, 11.2). (A) Electrode locations on native brains (electrodes 2, 3 are from the same subject). (B) Mean response for each stimulus duration and category. For clarity only trials lasting at least 1800 ms (onset to onset) are shown, thereby eliminating 300 ms stimulus duration trials. Shading corresponds to standard error across trials. Note different y-axis scales. (C) Single-trial images (stacks) binned by stimulus duration (300, 600, 900, 1200, 1500 ms from top to bottom). Each row in the images represents a single face trial. Increased activation at the end of short-duration trials (top right corner of each image) corresponds to the subsequent trial when the ISI is short.
Fig. 6
Fig. 6. Electrodes on the posterior fusiform gyrus encode stimulus persistent presence and its category
Four significantly duration-tracking electrodes in three subjects were found within category-selective IT cortex, all located adjacently to the mid-fusiform sulcus on the posterior fusiform gyrus, as opposed to more anterior category-selective sites which do not track ongoing stimulus presence. Of these, the two face-selective electrodes (from two subjects) marked by arrows also maintained category-selectivity persistently throughout the duration of the response (marked with arrows) whereas the two others did not. The electrodes are presented on the subjects’ native brains.
Fig. 7
Fig. 7. No differences between single task and dual-task attention control
Panels A, B show time-frequency plots from two representative electrodes in two subjects who performed well for both the clothing items and the blurring events detection task (attention-control). Left column: electrode location on individual subject’s brain. Right column: time-frequency plots for a single electrode corresponding to three stimulus durations (top to bottom) and the two experimental conditions. Power is shown as z-score compared to baseline. (A) Face-selective, non-duration-tracking IT electrode. (B) Object-selective, non-duration-tracking IT electrode. (C) Left: each visually-responsive electrode is plotted as one data point comparing the mean number of above-baseline data points (across trials) between the two tasks (r = 0.92). The results are clustered around the diagonal demonstrating similar mean response durations across conditions. Orange points are from the three subjects who could perform the control task well. Right: the same relation is shown specifically for category-selective inferior temporal electrodes (r = 0.88). There was no significant difference between the two experiments either on the single electrode basis (across trials) or in the mean across electrodes.
Fig. 8
Fig. 8. No effect of saccades on sustained visual activity
Saccadic events were identified in a single subject based on detection of saccadic spike potentials in two electrodes near the temporal pole. (A) Anatomical location of electrodes used to detect saccadic spikes (blue filled circles), and an electrode in the same subject exhibiting face-selective duration-tracking (red). (B) Representative un-averaged traces (>30 Hz high-pass-filtered) of spike events in the two temporal-pole electrodes. Inset: the averaged saccadic spike model from the 3 EEG control subjects which served as a model and in which saccade onsets were detected by eye tracking. (C) Peri-stimulus saccade rate. The ECoG-based saccades follow a typical post-stimulus suppression and rebound (blue), comparable to saccades detected using eye-tracking for the same task in control subjects (black dotted). (D) Average time-frequency plots of the responses to 1500 ms face stimuli in the posterior IT electrode showing face-selective duration-tracking, for trials with no saccades during stimulus presentation (left), vs. trials with many saccades (right). Shown below each time frequency plot is a raster plot of saccade events during each trial included in the group. Each row represents a single trial and each tick mark represents a detected saccade. (E) Direct comparison of high-frequency band-limited power for the two groups of trials. Cluster-based permutation testing did not detect differences in power at any time point. Dotted line marks mean baseline power. (F) Mean error for stimulus duration estimation from simulated HFB power constructed based on individual saccades, as function of the simulated duration of the saccade evoked activity. Each line represents simulation based on saccades from one of three EEG subjects. The lowest mean error achieved in the simulation was 485 ms, which is larger than that of 15 of the most strongly duration-dependent intracranial electrodes in the early visual cortex. The black error bar indicates 95% confidence interval across trials for the best-performing (lowest error) simulation (the three lowest errors from intracranial electrodes are shown as horizontal broken lines). We conclude that it is unlikely that the robust duration-tracking responses in early visual cortex were the result of summed transient responses driven by eye movements, regardless of the duration of these saccade-related bursts.
Fig. 9
Fig. 9. Duration dependent sustained potentials
(A) Duration-dependence of evoked responses in two individual subject brains (subjects 5 and 10). Colored patches indicate degree of duration-dependence according to the color scale on the right. Large dots indicate statistically significant duration-dependence. (B) Mean evoked responses for the three electrodes identified in panel (A). (C) High-SNR segment of the raw data trace (blue line, low-pass filtered at 10 Hz) taken from electrode 3 and on-off visual stimulation epochs (black trace on bottom). The robust DDSP evidenced without averaging, indicates that DDSP corresponds to sustained single trials deflections rather than to a summation of stimulus-contingent transient deflections in single trials.

Similar articles

Cited by

References

    1. Allison T, Puce A, Spencer DD, McCarthy G, Belger A. Electrophysiological studies of human face perception. I: potential generated in occiptotemporal cortex by face and non-face stimuli. Cereb Cortex. 1999;9:415–430. - PubMed
    1. Argall BD, Saad ZS, Beauchamp MS. Simplified intersubject averaging on the cortical surface using SUMA. Hum Brain Mapp. 2006;27:14–27. http://dx.doi.org/10.1002/hbm.20158. - DOI - PMC - PubMed
    1. Avidan G, Harel M, Hendler T, Benbashat D, Zohary E, Papanikolaou A, Keliris Ga, Papageorgiou TD, Shao Y, Krapp E, Papageorgiou E, Stingl K, Bruckmann A, Schiefer U, Logothetis NK, Smirnakis SM. Contrast sensitivity in human visual areas and its relationship to object recognition. J Neurophysiol. 2002;87:3102–3116. - PubMed
    1. Benjamini Y, Yosef H. Controlling the false discovery rate: a practical and powerful approach to multiple testing. J R Stat Soc. 1995;57:289–300.
    1. Bentin S, Allison T, Puce A, Perez E, McCarthy G. Electrophysiological studies of face perception in humans. J Cogn Neurosci. 1996;8:551–565. http://dx.doi.org/10.1162/jocn.1996.8.6.551. - DOI - PMC - PubMed

Publication types

LinkOut - more resources