. 2017 Sep 1;144(17):3066-3079.
doi: 10.1242/dev.152942. Epub 2017 Aug 14.

Cytoplasmic poly (A)-binding protein critically regulates epidermal maintenance and turnover in the planarian Schmidtea mediterranea

Affiliations

Cytoplasmic poly (A)-binding protein critically regulates epidermal maintenance and turnover in the planarian Schmidtea mediterranea

Dhiru Bansal et al. Development. .

Abstract

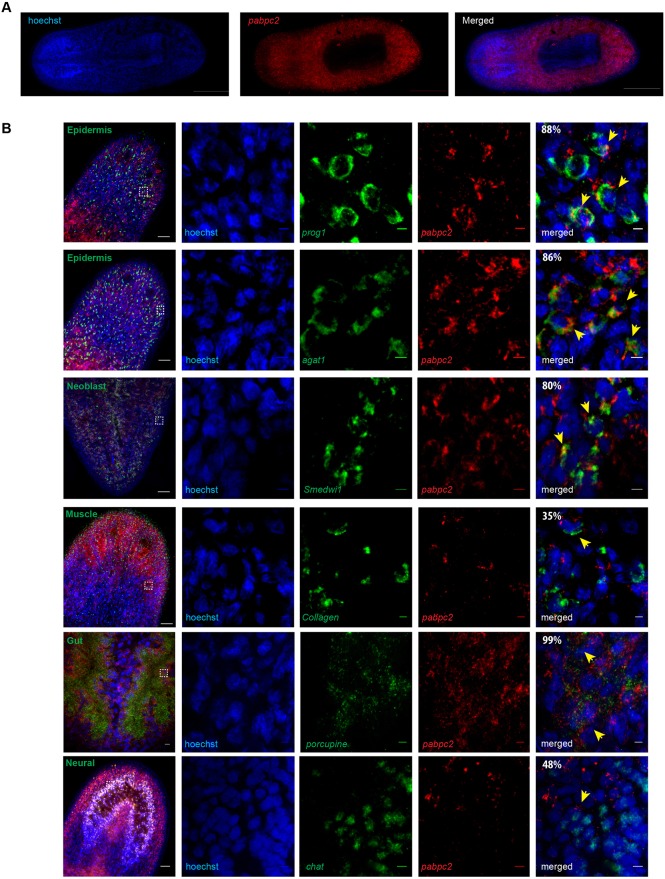
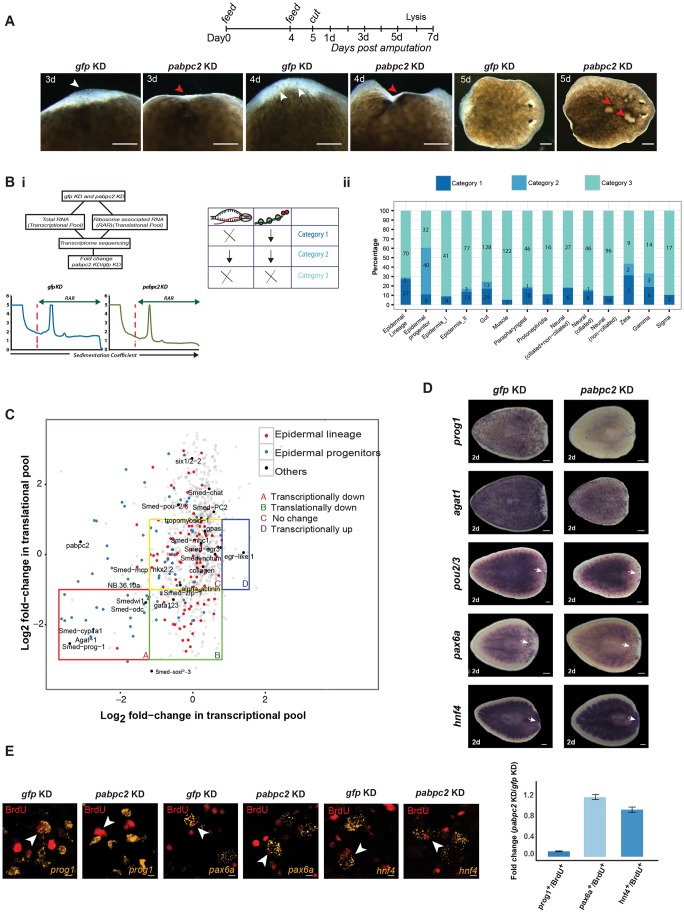
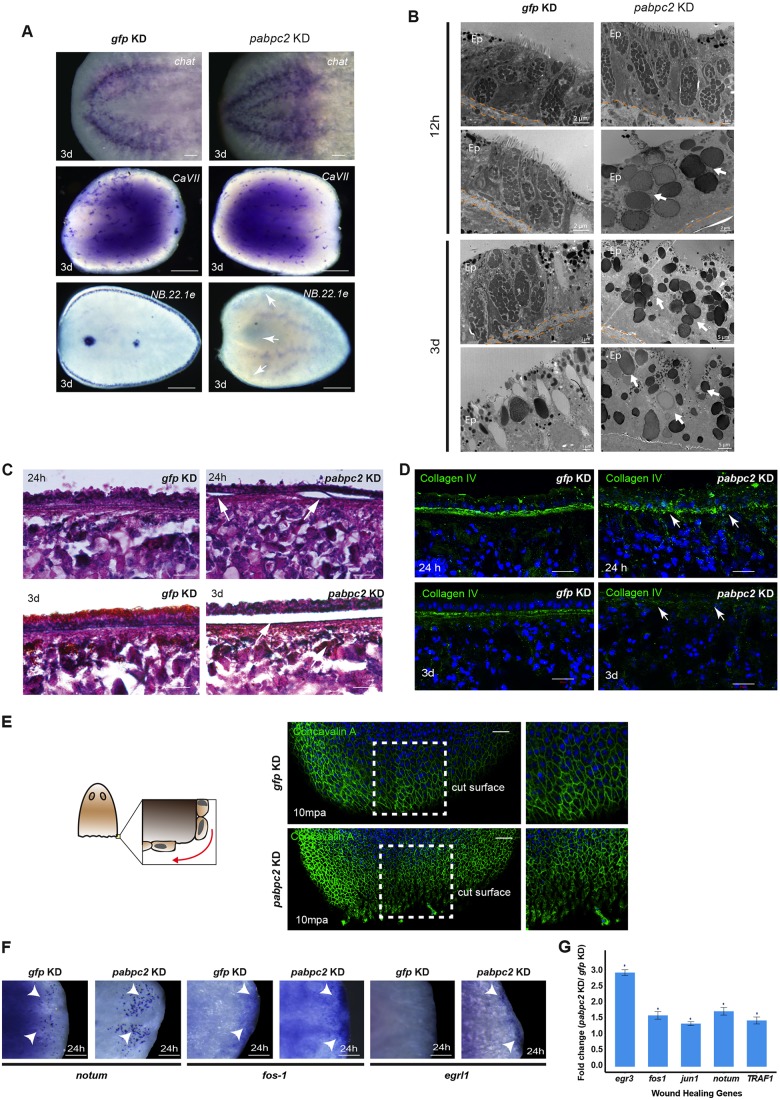
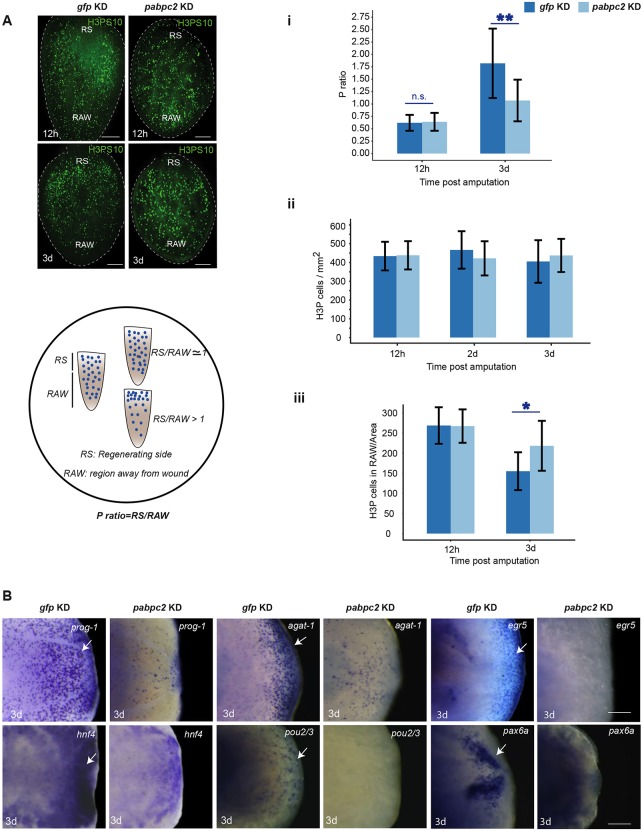
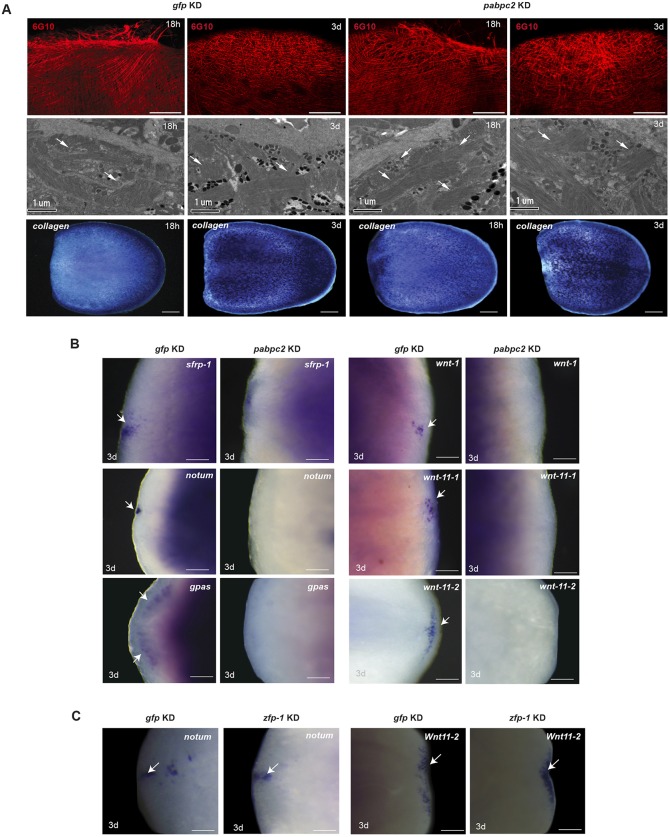
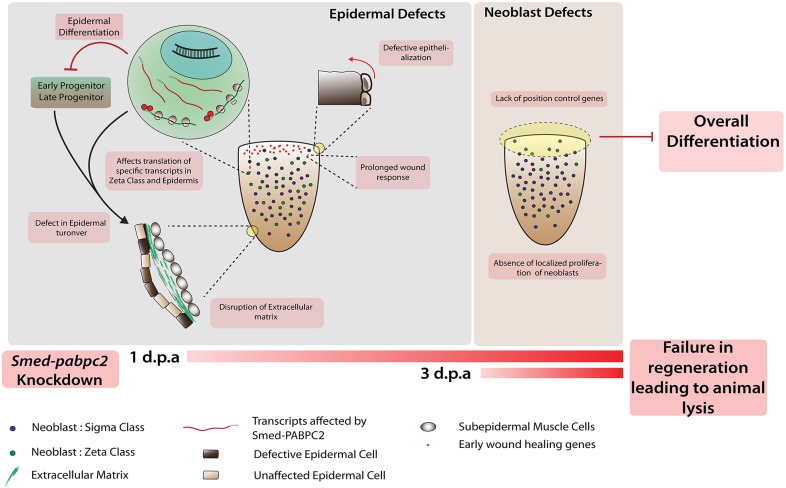
Identifying key cellular events that facilitate stem cell function and tissue organization is crucial for understanding the process of regeneration. Planarians are powerful model system to study regeneration and stem cell (neoblast) function. Here, using planaria, we show that the initial events of regeneration, such as epithelialization and epidermal organization are critically regulated by a novel cytoplasmic poly A-binding protein, SMED-PABPC2. Knockdown of smed-pabpc2 leads to defects in epidermal lineage specification, disorganization of epidermis and ECM, and deregulated wound healing, resulting in the selective failure of neoblast proliferation near the wound region. Polysome profiling suggests that epidermal lineage transcripts, including zfp-1, are translationally regulated by SMED-PABPC2. Together, our results uncover a novel role for SMED-PABPC2 in the maintenance of epidermal and ECM integrity, critical for wound healing and subsequent processes for regeneration.

Keywords: Epidermis; Neoblast; Planaria; Poly (A)-binding proteins; Regeneration.


Conflict of interest statement

Competing interestsThe authors declare no competing or financial interests.

Figures

Fig. 1.
Fig. 1.
Identification and characterization of SMED-PABPC2. (A) Fluorescent in situ hybridization to study the expression pattern of smed-pabpc2. Scale bars: 500 μm. (B) Double fluorescent in situ hybridization showing co-expression of pabpc2 with prog1, agat1, smedwi1, collagen, porcupine and chat. The images in the first column were taken at 20× magnification. Scale bars: 50 μm. The white boxes indicate the area magnified in the columns to the right. The percentage of colocalization is shown in the last panel. Probes are indicated; yellow arrows indicate co-labeled cells. Scale bars: 5 μm. n=6. See also Fig. S1.
Fig. 2.
Fig. 2.
PABPC2 regulates epidermal lineage transcripts. (A) Timeline showing RNAi feed schedule. Images were taken at 3, 4 and 5 dpa after dsRNA treatment. White arrowheads show normal blastema in control animals. Red arrowheads highlight the defective blastema and the lesions in knockdown animals (100/100). Scale bars: 200 μm. (Bi) The method used to identify the transcripts associated with the ribosome and cellular transcripts in the gfp and pabpc2 knockdown animals. ×, no change; ↓, decrease. (Bii) Stack bar depicting number and percentage of transcripts that belong to different categories across various cell types. Fold change was calculated by taking the ratio of the normalized number of transcripts between pabpc2 and gfp knockdown animals. (C) Scatter plot of fold-change values (PABPC/GFP) showing the distribution of transcripts between the transcriptional and translational pool. Transcripts from different categories are marked as four quadrants A, B, C and D. Transcripts that belong to epidermal lineage and epidermal progenitors are highlighted in red and blue, respectively. Some well-known markers belonging to different cell types and wound-healing genes are labeled in the scatter plot. (D) Whole-mount in situ hybridization using different progenitor markers such as prog1, agat1, pou2/3, hnf4 and pax6a at 2 dpa in gfp and pabpc2 knockdown animals. Epidermal progenitors (prog1 and agat1) showed a significant reduction in the expression upon pabpc2 knockdown, unlike other progenitors (hnf4, pax6a and pou2/3). White arrows indicate staining in the blastema. Scale bars: 200 μm (n=10). (E) Confocal images showing BrdU and progenitor (prog1, hnf4 and pax6a)-positive cells in gfp and pabpc2 knockdown animals. BrdU was injected post-2nd feed and animals were fixed 2 days post-BrdU injections. Equal numbers of BrdU cells were counted in gfp and pabpc2 knockdown animals and the numbers of colocalized cells were counted for each progenitor. The histogram depicts the fold change in colocalized cells in gfp and pabpc2 knockdown animals. Error bars were calculated from biological replicates. Yellow arrows indicate co-labeled cells. Scale bars: 5 μm. n=6. See also Fig. S2.
Fig. 3.
Fig. 3.
SMED-PABPC2 is essential for maintaining epidermal and ECM integrity and epithelialization. (A) Whole-mount in situ hybridization showing expression of the differentiated tissue markers chat, cavII and NB.22.1e in gfp and pabpc2 knockdown animals. Scale bars: 500 μm. White arrows indicate loss of NB.22.1e expression in pabpc2 knockdown animals. n=10. (B) EM images showing organization of the epidermal tissue on the non-regenerating side at 12 hpa and 3 dpa in gfp and pabpc2 knockdown animals. Arrows show rhabdite-like cells in knockdown animals. Ep, epidermis. n=5. (C) Histological sections showing the organization of epidermis after pabpc2 knockdown in regenerating animals. Sagittal sections made from the regenerating animals at 24 h and 3 days post-amputation were stained with Hematoxylin and Eosin. Arrows show peeling of the epidermis in pabpc2 knockdown animals in regions away from amputation. Scale bars: 20 µm. n=9. (D) Maximum intensity projections of z-stacks of gfp and pabpc2 knockdown sagittal sections stained with collagen IV antibody at 24 h and 3 days post amputation. Arrows showing disorganization of ECM in pabpc2 knockdown animals. Scale bars: 20 µm. n=10. (E) Schematic showing stretching of epithelial cells near the wound region. Confocal images of gfp and pabpc2 knockdown animals stained with concavalin A-FITC showing the organization of dorsal epidermal tissue near the amputated region at 10 min post-amputation (mpa). The image is tiled. Scale bars: 100 µm. n=5. (F) Whole-mount in situ hybridization showing upregulation of early wound-healing genes such as notum, fos-1 and egr like 1 (egrl1) near the blastema at 24 hpa in pabpc2 knockdown animals. Scale bars: 50 µm. n=10. Arrowheads show the expression of transcripts in the blastema region. (G) Quantification of level of expression of wound-healing genes by qRT-PCR. Fold-change of wound-healing gene levels in pabpc2 knockdown animals at 24 hpa. The error bars are drawn from biological triplicates and indicate s.e.m. *P<0.05. See also Fig. S3.
Fig. 4.
Fig. 4.
Effect of smed-pabpc2 knockdown on neoblast proliferation and blastema formation. (A) Max intensity projections of confocal images showing H3PS10+ cells in regenerating animals in gfp and pabpc2 knockdown animals. Scale bars: 100 µm. n=21. Schematic showing the procedure of calculating the P-ratio. Animals were divided in the ratio of 1:2 from the cut side and considered as regenerating side (RS) and region away from wound (RAW), respectively. Mitotic cells were calculated in both the regions and normalized to per unit animal area. P ratio=RS/RAW. (i) The P ratio at 12 hpa and 3 dpa in gfp and pabpc2 knockdown animals. pabpc2 knockdown animals showed a P ratio close to 1 even at 3 dpa, unlike control animals. The difference between the P ratios in control and knockdown animals at 3 dpa was significant (**P<0.0001). n.s., non-significant. (ii) The total number of mitotic cells in gfp and smed-pabpc2 knockdown animals at 12 hpa, 2 dpa and 3 dpa. (iii) Cell numbers in the region away from the wound at 12 hpa and 3 dpa. A significant increase was observed in cell number in RAW in pabpc2 knockdown animals at 3 dpa (*P<0.05) (n=21). (B) Whole-mount in situ hybridization showing expression of progenitor markers, prog-1, agat-1, egr5, hnf4, pax6A and pou2/3 in pabpc2 knockdown and gfp knockdown animals at 3 dpa. White arrows indicate the staining observed in the blastema. Scale bars: 50 μm. n=10. See also Fig. S4.
Fig. 5.
Fig. 5.
smed-pabpc2 does not affect sub-epidermal muscle cells but affects PCGs expression. (A) Confocal images showing the organization of muscle cells stained with anti-6G10 antibody near the blastema after 18 h and 3 dpa in gfp and pabpc2 knockdown animals. Images were taken using LSM700 confocal microscope. Scale bars: 100 µm. n=6. EM images and whole-mount in situ hybridization with collagen showing muscle organization in gfp and pabpc2 knockdown animals at 18 hpa and 3 dpa. Arrows indicate sub-epidermal muscle cells. Scale bars: 200 µm. n=5. (B) Whole-mount in situ hybridization showing expression of anterior (sfrp-1, notum and gpas) and posterior (wnt-1, wnt11-1 and wnt11-2) PCGs in control and pabpc2 knockdown animals in the blastema at 3 dpa. Arrows mark the expression of PCGs in the blastema. Scale bars: 50 µm. (C) Whole-mount in situ hybridization showing expression of notum and wnt11-2 in zfp-1 knockdown animals at 3 dpa in the blastema region. Unlike pabpc2 knockdown animals, zfp-1 knockdown animals expressed PCGs in the blastema. Scale bars: 50 µm. n=8. Arrows indicate PCG expression in the blastema.
Fig. 6.
Fig. 6.
Model showing the crucial role of smed-pabpc2 in epidermal integrity and neoblast function. smed-pabpc2 knockdown animals show failure of epidermal organization due to failure of epidermal turnover. The epidermal defects leads to several other defects, such as loss of ECM integrity, defective wound closure and prolonged wound response. These potentially lead to a neoblast proliferation defect near the wound region and absence of PCGs, which subsequently affects overall differentiation and planarian regeneration.

Similar articles

Cited by

References

    1. Aboobaker A. A. (2011). Planarian stem cells: a simple paradigm for regeneration. Trends Cell Biol. 21, 304-311. 10.1016/j.tcb.2011.01.005 - DOI - PubMed
    1. Arwert E. N., Hoste E. and Watt F. M. (2012). Epithelial stem cells, wound healing and cancer. Nature reviews. Cancer 12, 170-180. 10.1038/nrc3217 - DOI - PubMed
    1. Babic I., Sharma S. and Black D. L. (2009). A role for polypyrimidine tract binding protein in the establishment of focal adhesions. Mol. Cell. Biol. 29, 5564-5577. 10.1128/MCB.00590-09 - DOI - PMC - PubMed
    1. Baguñà J. (2012). The planarian neoblast: the rambling history of its origin and some current black boxes. Int. J. Dev. Biol. 56, 19-37. 10.1387/ijdb.113463jb - DOI - PubMed
    1. Boudreau N., Myers C. and Bissell M. J. (1995). From laminin to lamin: regulation of tissue-specific gene expression by the ECM. Trends Cell Biol. 5, 1-4. 10.1016/S0962-8924(00)88924-2 - DOI - PubMed

Publication types

LinkOut - more resources