. 2017 Sep 22;61(10):e00383-17.
doi: 10.1128/AAC.00383-17. Print 2017 Oct.

Original Chemical Series of Pyrimidine Biosynthesis Inhibitors That Boost the Antiviral Interferon Response

Affiliations

Original Chemical Series of Pyrimidine Biosynthesis Inhibitors That Boost the Antiviral Interferon Response

Marianne Lucas-Hourani et al. Antimicrob Agents Chemother. .

Abstract

De novo pyrimidine biosynthesis is a key metabolic pathway involved in multiple biosynthetic processes. Here, we identified an original series of 3-(1H-indol-3-yl)-2,3-dihydro-4H-furo[3,2-c]chromen-4-one derivatives as a new class of pyrimidine biosynthesis inhibitors formed by two edge-fused polycyclic moieties. We show that identified compounds exhibit broad-spectrum antiviral activity and immunostimulatory properties, in line with recent reports linking de novo pyrimidine biosynthesis with innate defense mechanisms against viruses. Most importantly, we establish that pyrimidine deprivation can amplify the production of both type I and type III interferons by cells stimulated with retinoic acid-inducible gene 1 (RIG-I) ligands. Altogether, our results further expand the current panel of pyrimidine biosynthesis inhibitors and illustrate how the production of antiviral interferons is tightly coupled to this metabolic pathway. Functional and structural similarities between this new chemical series and dicoumarol, which was reported before to inhibit pyrimidine biosynthesis at the dihydroorotate dehydrogenase (DHODH) step, are discussed.

Keywords: antiviral agents; innate immunity; interferons; pyrimidine metabolism.


Figures

FIG 1
FIG 1
DD363 activates the ISRE-luciferase reporter gene. (A) Chemical structures of DD363 and DD264 from Lucas-Hourani et al. (8). (B) HEK-293 cells stably transfected with the ISRE-luciferase reporter gene (STING-37 cells) were incubated with increasing doses of DD363, DD264, or recombinant IFN-β. After 24 h, luciferase expression was determined and the results expressed as a fold change relative to that with DMSO. Data correspond to means ± SD of the results from 8, 5, and 7 independent experiments, respectively. **, P < 0.01 as calculated by one-way analysis of variance (ANOVA) with Bonferroni's post hoc test.
FIG 2
FIG 2
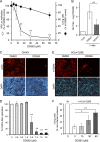
DD363 is an antiviral compound. (A) HEK-293T cells were infected with MV-Luc at a multiplicity of infection (MOI) of 0.1 and incubated with increasing concentrations of DD363 or DMSO alone. After 24 h, luciferase activity was measured to quantify viral growth (open circles). Results are expressed as a percentage of luminescence signals relative to a DMSO control (means ± SD of the results from 10 independent experiments). **, P < 0.01, as calculated by one-way ANOVA with Bonferroni's post hoc test. As a control, HEK-293T cells were treated with increasing concentrations of DD363 or DMSO alone. After 24 h, cellular viability was determined using CellTiter-Glo reagent (Promega), which evaluates by ATP quantification the number of metabolically active cells (closed circles). Results are expressed as a percentage relative to a DMSO control (means ± SD of the results from 4 independent experiments). (B) HEK-293T cells were infected with MV (MOI = 0.1) and incubated with DD363 (30 μM) or DMSO alone. At the time of infection (T = 0) and 2 days later (T = 48), cultures were harvested and virus titers determined by the TCID50 method (means ± SD of the results from 5 independent experiments). **, P < 0.01, as calculated by paired two-tailed t test. (C) HEK-293T cells were infected with CHIKV (MOI = 0.1) and incubated with DMSO alone or DD363 (30 μM). After 24 h, cells were fixed, and CHIKV E2 glycoprotein was detected by immunostaining. Cell nuclei were stained with DAPI. Scale bar = 200 μm. (D) HEK-293T cells were infected with a recombinant strain of CHIKV expressing Renilla luciferase (MOI = 0.2) and incubated with DD363 or DMSO alone. After 24 h, Renilla luciferase expression was determined. Results are expressed as a percentage relative to a DMSO control (means ± SD of the results from 3 independent experiments). **, P < 0.01, as calculated by one-way ANOVA with Bonferroni's post hoc test. (E) MRC5 cells were infected with HCoV-229E (MOI = 0.1) and incubated with DMSO alone or DD363 (60 μM). After 48 h, cells were fixed, and HCoV-229E spike glycoprotein was detected by immunostaining. Cell nuclei were stained with DAPI. Scale bar = 200 μm. (F) MRC5 cells were infected with HCoV-229E (MOI = 0.1) or not (noninfected [NI]) and incubated with DMSO alone or increasing concentrations of DD363. After 48 h, the number of viable cells in culture wells was determined using the CellTiter-Glo reagent (Promega) and normalized to the number of viable cells in noninfected DD363-treated cultures to take into account cytostatic effects of the molecule. Results correspond to means ± SD of 5 independent experiments. *, P < 0.05; and **, P < 0.01, as calculated by one-way ANOVA with Bonferroni's post hoc test.
FIG 3
FIG 3
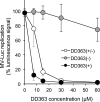
Antiviral activity of DD363 isolated enantiomers. Enantiomers of DD363 were separated by chiral chromatography and then tested for the inhibition of MV-Luc in HEK-293T cells as in Fig. 2A. The (±) symbol indicates a mixture of enantiomers, whereas (+) and (−) symbols correspond to purified enantiomers. Data correspond to means ± SD of the results from 5 independent experiments.
FIG 4
FIG 4
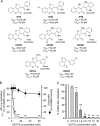
Antiviral activity of DD363 analogs, including DD778. (A) Increasing concentrations of DD363 analogs were tested for their capacity to inhibit MV-Luc in HEK-293T cells, and IC50s were calculated from dose-response curves. In parallel, the half-maximal cytotoxic concentration (CC50) was determined using CellTiter-Glo (Promega). Data correspond to means ± SD of the results from ≥3 independent experiments. (B) Dose-response curve showing the inhibition of MV-Luc (MOI = 0.1) by DD778 in HEK-293T cells after 24 h of culture (open circles). Results are expressed as a percentage of luminescence signals relative to DMSO control (means ± SD of the results from 3 independent experiments). **, P < 0.01, as calculated by one-way ANOVA with Bonferroni's post hoc test. In parallel, cellular viability in noninfected cultures treated with DD778 was determined with the CellTiter-Glo reagent (closed circles; means ± SD of the results from 4 independent experiments). (C) HEK-293T cells were infected with a recombinant strain of CHIKV expressing Renilla luciferase (MOI = 0.2) and incubated with increasing doses of DD778 or DMSO alone. After 24 h, Renilla luciferase expression was determined. Results are expressed as a percentage relative to DMSO control (means ± SD of the results from 3 independent experiments). **, P < 0.01, as calculated by one-way ANOVA with Bonferroni's post hoc test.
FIG 5
FIG 5
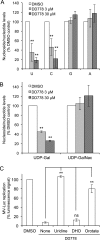
DD778 is an inhibitor of pyrimidine biosynthesis. (A) HEK-293T cells were treated for 24 h with DD778 or DMSO alone. Cells were harvested and washed in PBS, and intracellular levels of each nucleoside/nucleotide (U, C, G, or A) were determined by HPLC and spectrophotometry. Concentrations are expressed as a percentage relative to DMSO-treated cells (means ± SD of the results from 4 independent experiments). (B) Same as in panel A, but intracellular levels of UDP galactose (UDP-Gal) and UDP N-acetylgalactosamine (UDP-GalNac) are presented. Data represent means ± SD of the results from 3 independent experiments. (C) HEK-293T cells were infected with MV-Luc (MOI = 0.1), incubated with DMSO or DD778 (10 μM), and cotreated with uridine (130 μM), dihydroorotate (DHO; 3 mM) or orotate (3 mM). After 24 h, luciferase expression that reflects viral growth was determined. Data represent means ± SD of the results from 3 independent experiments. **, P < 0.01, as calculated by one-way ANOVA with Bonferroni's post hoc test. ns, nonsignificant.
FIG 6
FIG 6
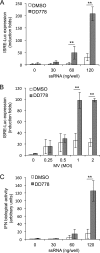
Cellular response to ssRNA transfection is amplified by DD778. (A) A total of 2 × 10⁵ STING-37 cells were transfected with indicated doses of ssRNA and immediately treated with DMSO alone or DD778 (30 μM). After 24 h, luciferase activity was determined. Data represent means ± SD of the results from 5 independent experiments. **, P < 0.01, as calculated by two-way ANOVA with Bonferroni's post hoc test. (B) STING-37 cells were infected with MV at the indicated MOI and cultured for 9 h. Then, medium was supplemented with DD778 (30 μM) or DMSO alone, and luciferase expression was determined 16 h later. Data represent means ± SD of the results from 6 independent experiments. **, P < 0.01, as calculated by two-way ANOVA with Bonferroni's post hoc test. (C) Same as in panel A, but culture supernatants were harvested at T = 48 h, and IFN biological activity was determined on fresh STING-37 reporter cells. Data represent means ± SD of the results from 5 independent experiments. **, P < 0.01, as calculated by two-way ANOVA with Bonferroni's post hoc test.
FIG 7
FIG 7
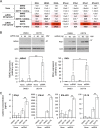
The expression of ISGs and IFNs in ssRNA-stimulated cells is enhanced by DD778. (A) HEK-293 cells with the ISRE-luciferase reporter gene (STING-37) were transfected with indicated doses of ssRNA and immediately treated with DMSO alone or DD778 (30 μM). Total RNAs were extracted from cellular pellets collected at T = 24 h, and the expression levels of specified genes were determined by RT-qPCR. Data represent means ± SD of the results from 3 independent experiments. Bold figures correspond to statistically significant differences comparing DD778 to DMSO-treated samples or DD778 + uridine to DD778 alone (P < 0.05, calculated by two-way ANOVA with Bonferroni's post hoc test). (B) Same as above, but MDA5 and RIG-I expression levels were determined by Western blotting on total protein extracts from STING-37 cells at T = 48 h. Upper images correspond to representative experiments. Graphs below correspond to the quantification of Western blotting results, where values were normalized to actin (means ± SD of the results from 3 independent experiments; cells were transfected with 120 ng of ssRNA). *, P < 0.05; and **, P < 0.01, as calculated by one-way ANOVA with Bonferroni's post hoc test. (C) Same experiment as above, but total concentrations of indicated cytokines in culture supernatants at T = 48 h were determined using the LEGENDplex analysis kit (cells were transfected with 120 ng of ssRNA). Data represent means ± SD of the results from 4 independent experiments. *, P < 0.05; and **, P < 0.01, as calculated by two-tailed standard t test.
FIG 8
FIG 8
DD778 modulates the innate immune response in MV-infected cells. (A) STING-37 cells were infected with MV (MOI = 2) and cultured for 9 h. Then, medium was supplemented with DD778 (30 μM) or DMSO alone. Culture supernatants and cells were harvested 39 h later. Total concentrations of indicated cytokines in culture supernatants were determined using the LEGENDplex analysis kit. Data represent means ± SD of the results from 3 independent experiments. *, P < 0.05, as calculated by two-tailed standard t test. (B) Same experiment as above, but MDA5 and RIG-I expression levels were determined by Western blotting on cell protein extracts. Left images correspond to one representative experiment. Right graphs correspond to the quantification of Western blotting results, where values were normalized to actin (means ± SD of the results from 4 independent experiments). *, P < 0.05; and **, P < 0.01, as calculated by one-way ANOVA with Bonferroni's post hoc test.
FIG 9
FIG 9
Chemical structures of known DHODH inhibitors compared to DD778. (A to D) Chemical structures of teriflunomide (A), DD778 (B), dicoumarol (C), and brequinar (D). (D) Interactions with Arg136 from human DHODH (based on 1D3G [35]). Indicated IC50s correspond to the inhibition of MV-Luc in HEK-293T cells, as determined in this paper for DD778 and dicoumarol, or as previously reported by Munier-Lehmann et al. (9) for teriflunomide and brequinar.

Similar articles

Cited by

References

    1. Pastor-Anglada M, Perez-Torras S. 2015. Nucleoside transporter proteins as biomarkers of drug responsiveness and drug targets. Front Pharmacol 6:13. doi:10.3389/fphar.2015.00013. - DOI - PMC - PubMed
    1. Evans DR, Guy HI. 2004. Mammalian pyrimidine biosynthesis: fresh insights into an ancient pathway. J Biol Chem 279:33035–33038. doi:10.1074/jbc.R400007200. - DOI - PubMed
    1. Munier-Lehmann H, Vidalain PO, Tangy F, Janin YL. 2013. On dihydroorotate dehydrogenases and their inhibitors and uses. J Med Chem 56:3148–3167. doi:10.1021/jm301848w. - DOI - PubMed
    1. Bonavia A, Franti M, Pusateri Keaney E, Kuhen K, Seepersaud M, Radetich B, Shao J, Honda A, Dewhurst J, Balabanis K, Monroe J, Wolff K, Osborne C, Lanieri L, Hoffmaster K, Amin J, Markovits J, Broome M, Skuba E, Cornella-Taracido I, Joberty G, Bouwmeester T, Hamann L, Tallarico JA, Tommasi R, Compton T, Bushell SM. 2011. Identification of broad-spectrum antiviral compounds and assessment of the druggability of their target for efficacy against respiratory syncytial virus (RSV). Proc Natl Acad Sci U S A 108:6739–6744. doi:10.1073/pnas.1017142108. - DOI - PMC - PubMed
    1. Wang QY, Bushell S, Qing M, Xu HY, Bonavia A, Nunes S, Zhou J, Poh MK, Florez de Sessions P, Niyomrattanakit P, Dong H, Hoffmaster K, Goh A, Nilar S, Schul W, Jones S, Kramer L, Compton T, Shi PY. 2011. Inhibition of dengue virus through suppression of host pyrimidine biosynthesis. J Virol 85:6548–6556. doi:10.1128/JVI.02510-10. - DOI - PMC - PubMed

MeSH terms