. 2017 Oct 1;77(19):5360-5373.
doi: 10.1158/0008-5472.CAN-17-1294. Epub 2017 Aug 14.

S100A4 Is a Biomarker and Regulator of Glioma Stem Cells That Is Critical for Mesenchymal Transition in Glioblastoma

Affiliations

S100A4 Is a Biomarker and Regulator of Glioma Stem Cells That Is Critical for Mesenchymal Transition in Glioblastoma

Kin-Hoe Chow et al. Cancer Res. .

Abstract

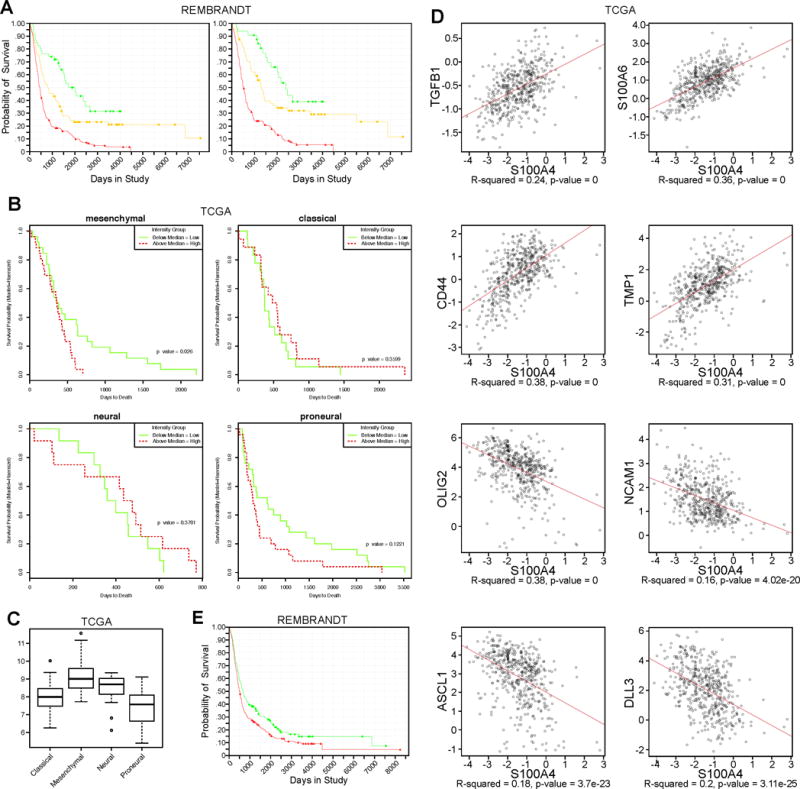
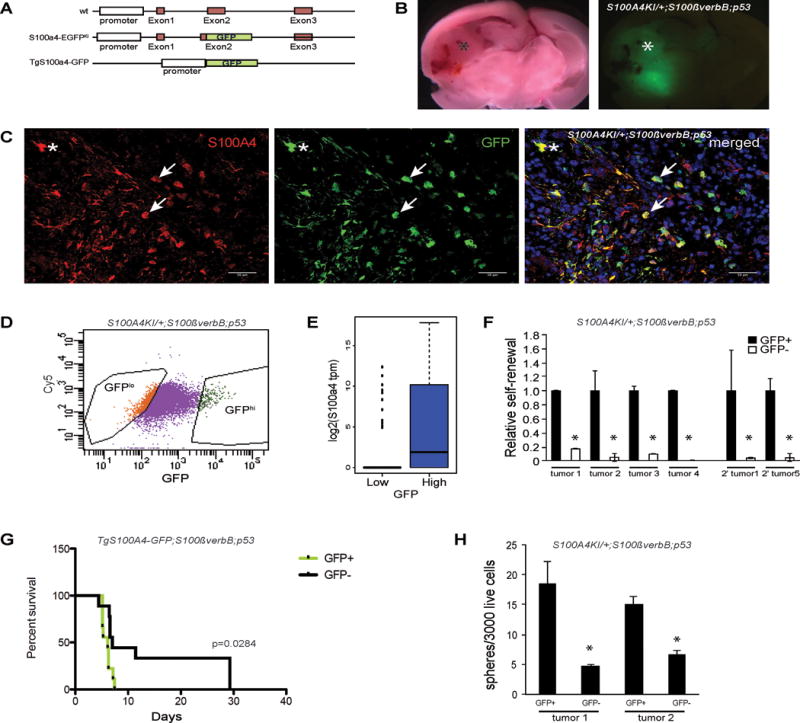
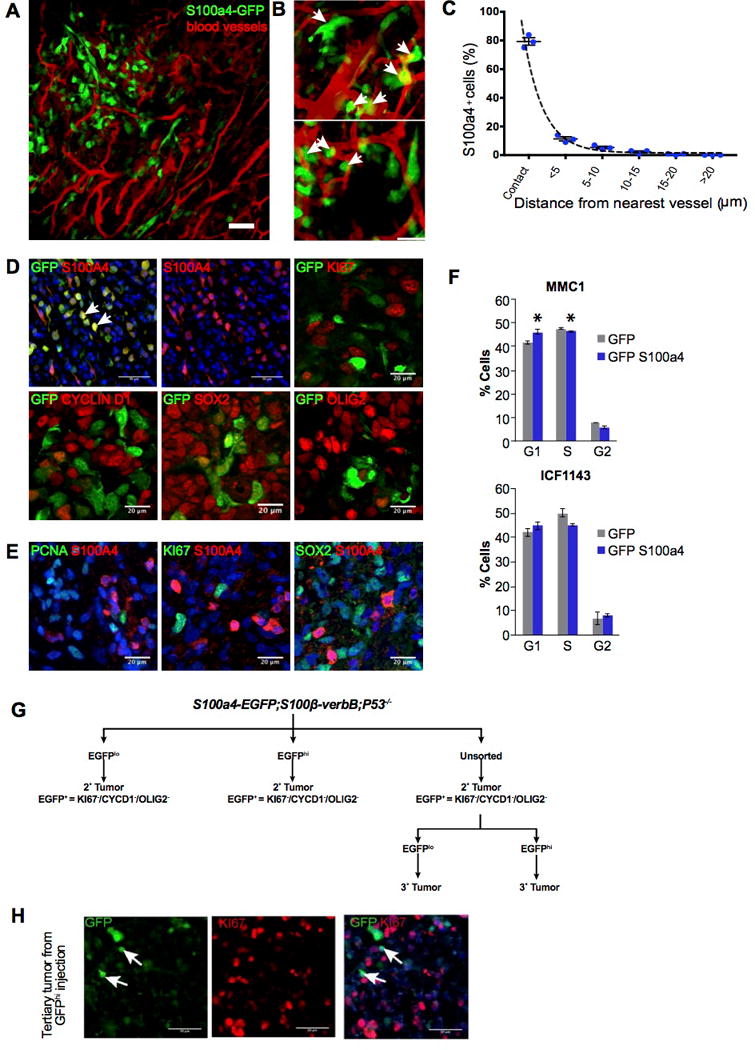
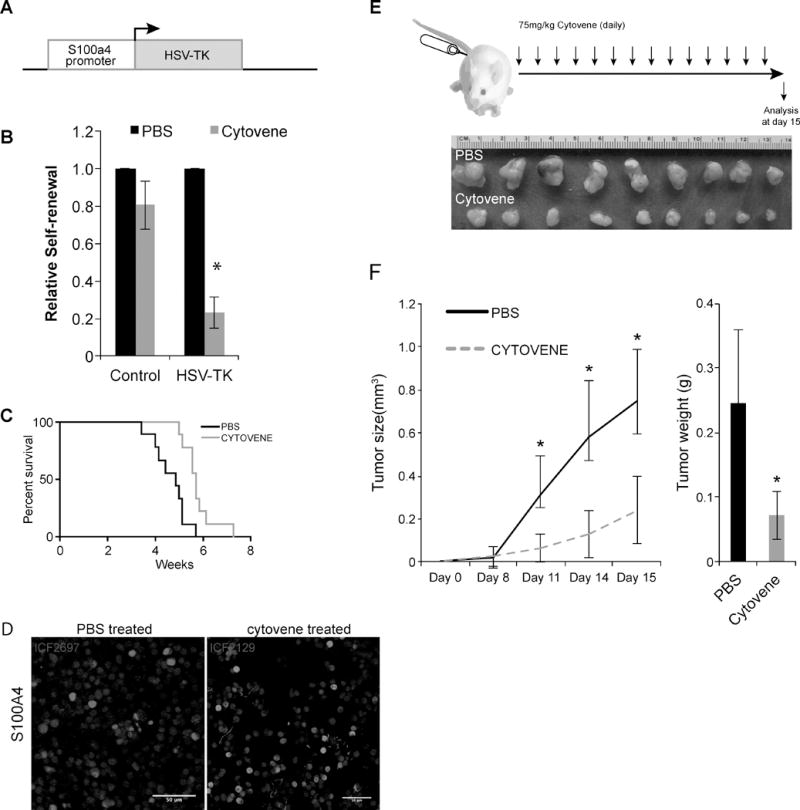
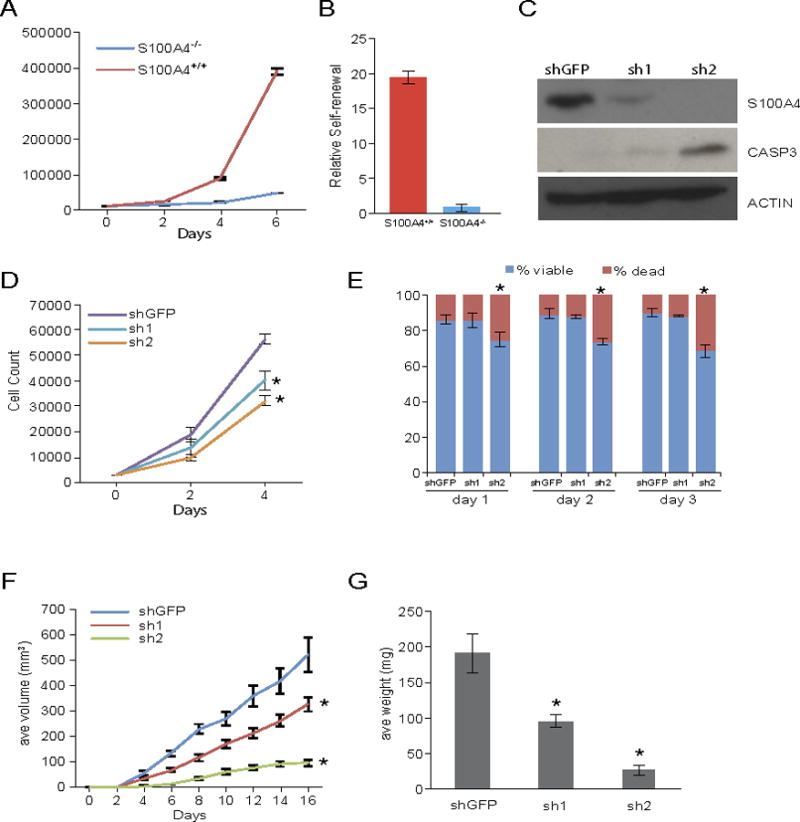
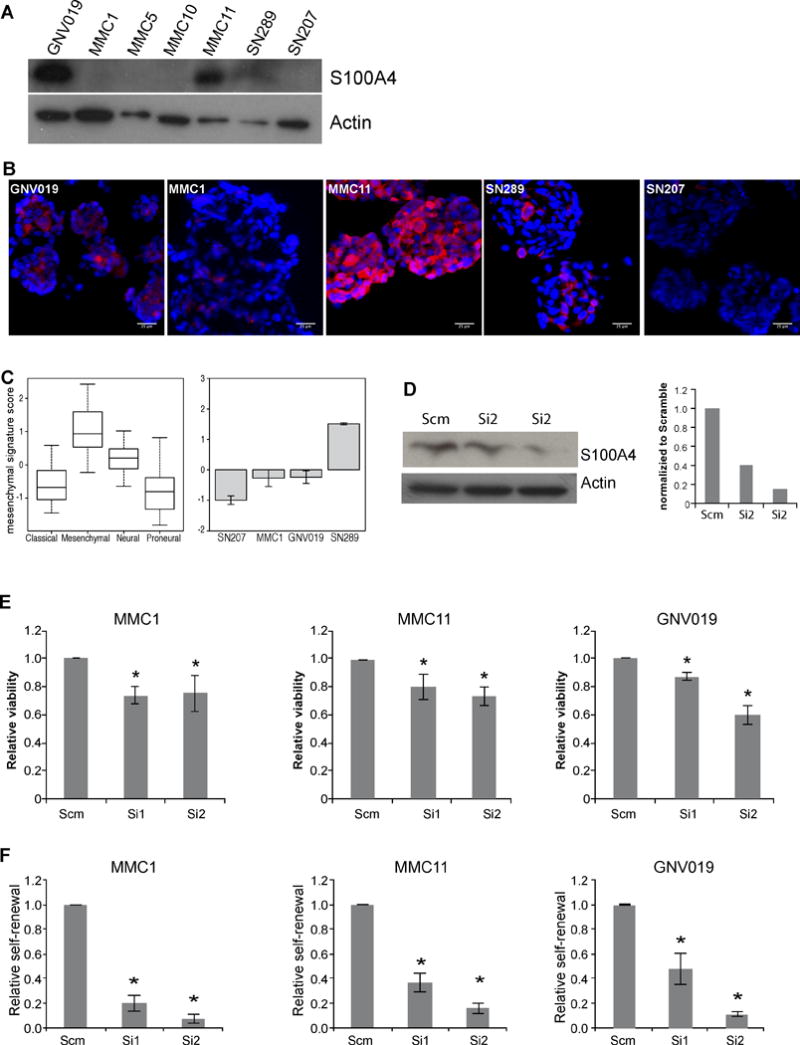
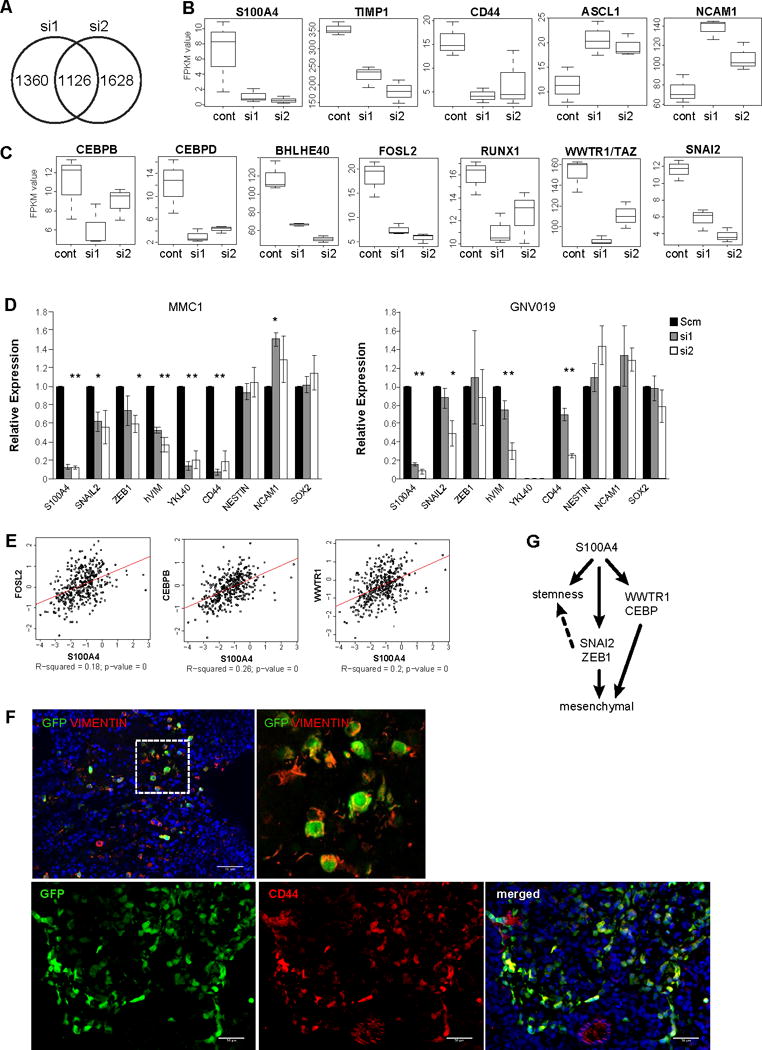
Glioma stem cells (GSC) and epithelial-mesenchymal transition (EMT) are strongly associated with therapy resistance and tumor recurrence, but the underlying mechanisms are incompletely understood. Here, we show that S100A4 is a novel biomarker of GSCs. S100A4+ cells in gliomas are enriched with cancer cells that have tumor-initiating and sphere-forming abilities, with the majority located in perivascular niches where GSCs are found. Selective ablation of S100A4-expressing cells was sufficient to block tumor growth in vitro and in vivo We also identified S100A4 as a critical regulator of GSC self-renewal in mouse and patient-derived glioma tumorspheres. In contrast with previous reports of S100A4 as a reporter of EMT, we discovered that S100A4 is an upstream regulator of the master EMT regulators SNAIL2 and ZEB along with other mesenchymal transition regulators in glioblastoma. Overall, our results establish S100A4 as a central node in a molecular network that controls stemness and EMT in glioblastoma, suggesting S100A4 as a candidate therapeutic target. Cancer Res; 77(19); 5360-73. ©2017 AACR.


Conflict of interest statement

Authors declare no potential conflicts of interest.

Figures

Figure 1
Figure 1. High-S100A4 expression is associated with mesenchymal GBMs and predict poor GBM patient survival
A) Kaplan-Meier survival curve of all glioma patients (LEFT) using S100A4 expression levels (red: upregulated, yellow: intermediate, green: downregulated). REMBRANDT data analysis: p=8.6E-6 for up vs. intermediate, p=5.7E-9 for up vs. down, and p=0.009 for down vs. intermediate. Right: Kaplan-Meier survival curve of astrocytoma patients only, using S100A4 expression levels in REMBRANDT database. P=0.04 for up vs. intermediate, p=0.006 for up vs. down, and p=0.211 for down vs. intermediate (red: upregulated, yellow: intermediate, green: downregulated). B) Kaplan-Meier survival curve of patients in TCGA GBM database using S100A4 expression levels, separated by molecular subgroups. C) Average expression levels of S100A4 in the four molecular subgroups of GBM in TCGA. D) Expression correlation between S100A4 and mesenchymal or proneural signature gene expression, using all samples in the TCGA GBM database. E) Kaplan-Meier survival curve of all glioma patients in the REMBRANDT data by S100A4 copy number. P=0.019 for amplified vs. deleted. (red: amplified, green: deleted).
Figure 2
Figure 2. S100a4+ cells are enriched with glioma stem cells
A) Schematic representation of the S100a4-EGFPKI knock-in and TgS100a4-GFP transgenic mice. B) Spontaneous S100a4-EGFPKI/+;S100ß-verbB;p53−/− glioma showing GFP+ tumors cells in the tumor region. C) Immunofluorescence analysis of a spontaneous S100a4-EGFPKI/+;S100ß-verbB;p53−/− tumor showing overlapping expression of GFP and S100A4. Arrows point to S100A4+/EGFP+ glioma cells. * indicates normal astrocytes. Scale bar indicates 50 μm. D) FACS sorting of acutely dissociated S100a4-EGFPKI/+;S100ß-verbB;p53−/− tumor cell. E) S100a4 RNA levels in individual GFP-low and GFP-high cells from S100a4-EGFPKI/+;S100ß-verbB;p53−/− tumorspheres, measured by single cell RNA-seq analysis. F) Sphere formation assays of freshly dissociated tumor cells from 4 independent spontaneous S100a4-EGFPKI/+;S100ß-verbB;p53−/− gliomas and 2 independent secondary tumors, comparing high GFP (GFP+) or low GFP (GFP−) expressing cells. * marks observations with p<0.05. G) Freshly sorted GFP+ and GFP− cells from a spontaneous TgS100a4-GFP tumor were orthotopically injected, and survival was analyzed by a Kaplan-Meier curve (n=9 each group, p=0.0284, median for GFP+=6.143, GFP−= 7.0] H) Self-renewal analyses performed on unsorted tumor cells from tertiary S100a4-EGFPKI/+;S100ß-verbB;p53−/− tumors arising from injection of FACS sorted GFP+ or GFP− secondary tumor cells. All sphere formation assays were performed in triplicates.
Figure 3
Figure 3. S100A4hi cells in human and mouse tumors are quiescent but enter cell cycle to initiate tumors
A) Intravital imaging of S100a4-EGFPKI/+;S100β-VerbB;p53−/− tumor in vivo. B) Representative zoomed in 2D images showing close association of S100A4hi cells (green) with tumor vasculature (red). Scale bar, 20 μm. C) Frequency of S100A4hi cells (n = 156, from 3 mice) plotted against proximity to nearest tumor vasculature. D) Immunofluorescence analyses with indicated markers of secondary tumors derived from injecting unsorted S100a4-EGFPKI/+;S100ß-verbB;p53−/− tumor cells. Quantitation: (GFP+ KI67+)/(Ki67+) = 0.466% (tumor1) and 0.264% (tumor 2); (GFP+ Ki67+)/(GFP+) = 1.6% (tumor1) and 0.866%(tumor 2). Scale bars show 50 μm (upper left and middle panels showing GFP+S100A4 and S100A4 alone), 20 μm on other panels. E) Double immunofluorescence analyses of human GBM tissues stained with indicated markers. Quantitation: (S100A4+ KI67+)/(Ki67+) = 0% (tumor1), 0.264% (tumor 2); (S100A4+ Ki67+)/(S100A4+) = 0% (tumor1), 0%(tumor 2). Scale bars = 20 μm. F) Two independent human GSC cell lines over-expressing GFP (control) or S100A4 were stained with Propidium iodide and FACS scanned to analyze cell cycle profiles. S100A4 over-expression resulted in statistically significant accumulation of cells in G0/G1 and reduced percentages of cells in the S- and G2- phases in MMC1 cells. Similar trend was observed in ICF1143 cells but the effect did not reach statistical significance. * indicates p value < 0.05. G) A schematic representation of passage of tumor cells to generate secondary and tertiary tumors, all of which displaying quiescent nature of GFP+ cells with indicated markers H) Immunofluorescence analysis of GFP+/GFP− injected tertiary tumors with GFP and KI67. Arrows point to S100A4+/GFP+ cells. Scale bar = 50 μm.
Figure 4
Figure 4. Selective ablation of S100a4+ cells is sufficient to block glioma growth in vivo
A) A schematic representation of S100a4-HSVtk transgenic mice. B) Self-renewal analyses on Control (TgS100a4-EGFP;S100ß-verbB;p53−/− derived tumor cells) and HSV-TK (S100a4-HSVtk;S100ß-verbB;p53+/−) tumor cells treated with either PBS or 10uM of Cytovene. Cytovene is the brand name for ganciclovir sodium for injections. * indicates p values <0.05, error bars=SEM. Two independent S100a4-HSVtk;S100ß-verbB;p53+/− tumor lines were tested and each line was tested on 3 separate passages. C) S100a4-HSVtk;S100ß-verbB;p53+/− cells were in vitro treated with either PBS or Cytovene and then intracranially injected (n=9, med survival Cytovene treated = 5.71 and PBS treated= 4.87) p=0.0034. D) S100A4 antibody staining on tumors arising from (C). n=2 each. Scale bar indicates 50 μm. E) S100a4-HSVtk;S100ß-verbB;p53+/− cells were first injected into flank of NSG mice and then treated with PBS or Cytovene daily (75mg/kg, a non-toxic dose we determined). F) Average tumor volume in PBS or Cytovene treated mice, and average tumors weights at harvest. * indicates p values <0.05, error bars=SEM.
Figure 5
Figure 5. S100a4 function is required for self-renewal and survival of mouse GSCs
A, B) Growth curve and self-renewal analyses of tumor cells derived from S100a4-EGFPKI/KI;S100ß-verbB;p53−/− tumor (S100a4−/−) and TgS100a4-EGFP;S100ß-verbB;p53−/− tumor (S100a4+/+ control). Panel A: p-values on day 2 = 0.02, day 4=0.0034, and day 6=0.0009. Panel B: p-value = 0.0004. C) Immunoblot showing stable knockdown of S100a4 in TgS100a4-EGFP; S100ß-verbB;p53−/− tumor cells using two different shRNAs and increased apoptosis in knockdown cells (cleaved caspase 3). Control shRNA: shGFP. D,E) Growth curve analysis of stable knockdown cells and relative percentages of live and dead cells. * indicates p value <0.05. F, G) Control and two different shRNA S100a4 knockdown cells were injected into C57BL/6J host mice and tumor volume/weight were measured. * indicates p values <0.05.
Figure 6
Figure 6. S100A4 is required for self-renewal of human GSCs
A) Western blot analyses of S100A4 expression levels in seven independent human GSC lines. GNV019, MMC1, MMC5, MMC10, and MMC11 were derived from patient tumors. SN289 and SN207 were derived from GBM PDX models. B) S100A4 antibody staining on various GSCs. Scale bar indicates 25 μm. C) Analysis of S100A4 expression in TCGA GBM dataset and assignment of molecular subgroup classification to human GSC lines based on RNA analysis from each GSC line. D) Western blot analysis and quantification of S100A4 expression levels in human GSCs treated with two different siRNAs against S100A4. E) 3 × 10⁴ viable cells from three independent GSC lines were transfected with scramble, siRNA1 or SiRNA2 and plated in 96-well plates in triplicates. Viability was measured 48 hours later. * indicates p values <0.05, error bars=SEM. F) Self-renewal analyses of three independent GSC lines were determined by transfecting scramble or two different siRNA against S100A4 and plating them at 1cell/μl density to measure sphere formation. * indicates p values <0.05, error bars=SEM.
Figure 7
Figure 7. S100A4 is upstream of master regulators of EMT and the mesenchymal GBM signature genes
A) A Venn diagram indicating the number of genes with significantly altered expression levels by two different S100A4 siRNAs in MMC1 cells. B) Boxplots showing expression levels of mesenchymal and proneural GSC marker genes in control and S100A4 knockdown cells, measured by RNA-seq. C) Boxplots showing expression levels of the master transcriptional regulators of GBM mesenchymal signature genes (CEBPB/D, BHLHE40, FOSL2, RUNX1, and TAZ) and EMT (SNAIL2) in control and S100A4 knockdown cells, measured by RNA-seq. D) Realtime RT-PCR validation of reduced EMT and mesenchymal signature gene expression by S100A4 knockdown in two independent GSC lines (MMC1 and GNV019). * indicates p values <0.05, error bars=SEM. E) Expression correlation analysis of S100A4 vs. FOSL2, CEBP, and WWTR1/TAZ using the TCGA GBM dataset. F) Gliomas derived from injection of spontaneous S100a4-EGFPKI/+;S100ß-verbB;p53−/− glioma cells. Immunofluorescence analyses with markers of MES subtype GBM, CD44 and VIM, showing co-expression in GFP+/S100A4+ glioma cells. G) A working model of S100A4 function in regulating GSC self-renewal, EMT, and the mesenchymal phenotype.

References

    1. Stupp R, Taillibert S, Kanner AA, Kesari S, Steinberg DM, Toms SA, et al. Maintenance Therapy With Tumor-Treating Fields Plus Temozolomide vs Temozolomide Alone for Glioblastoma: A Randomized Clinical Trial. JAMA. 2015;314(23):2535–43. - PubMed
    1. Verhaak RGW, Hoadley KA, Purdom E, Wang V, Qi Y, Wilkerson MD, et al. Integrated genomic analysis identifies clinically relevant subtypes of glioblastoma characterized by abnormalities in PDGFRA, IDH1, EGFR, and NF1. Cancer Cell. 2010;17(1):98–110. - PMC - PubMed
    1. Phillips HS, Kharbanda S, Chen R, Forrest WF, Soriano RH, Wu TD, et al. Molecular subclasses of high-grade glioma predict prognosis, delineate a pattern of disease progression, and resemble stages in neurogenesis. Cancer Cell. 2006;9(3):157–73. - PubMed
    1. Bhat KP, Balasubramaniyan V, Vaillant B, Ezhilarasan R, Hummelink K, Hollingsworth F, et al. Mesenchymal differentiation mediated by NF-kappaB promotes radiation resistance in glioblastoma. Cancer Cell. 2013;24(3):331–46. - PMC - PubMed
    1. Mani SA, Guo W, Liao MJ, Eaton EN, Ayyanan A, Zhou AY, et al. The epithelial-mesenchymal transition generates cells with properties of stem cells. Cell. 2008;133(4):704–15. - PMC - PubMed

Publication types

MeSH terms