. 2017 Aug 29;114(35):E7262-E7271.
doi: 10.1073/pnas.1705622114. Epub 2017 Aug 14.

Two transmembrane dimers of the bovine papillomavirus E5 oncoprotein clamp the PDGF β receptor in an active dimeric conformation

Affiliations

Two transmembrane dimers of the bovine papillomavirus E5 oncoprotein clamp the PDGF β receptor in an active dimeric conformation

Alexander G Karabadzhak et al. Proc Natl Acad Sci U S A. .

Abstract

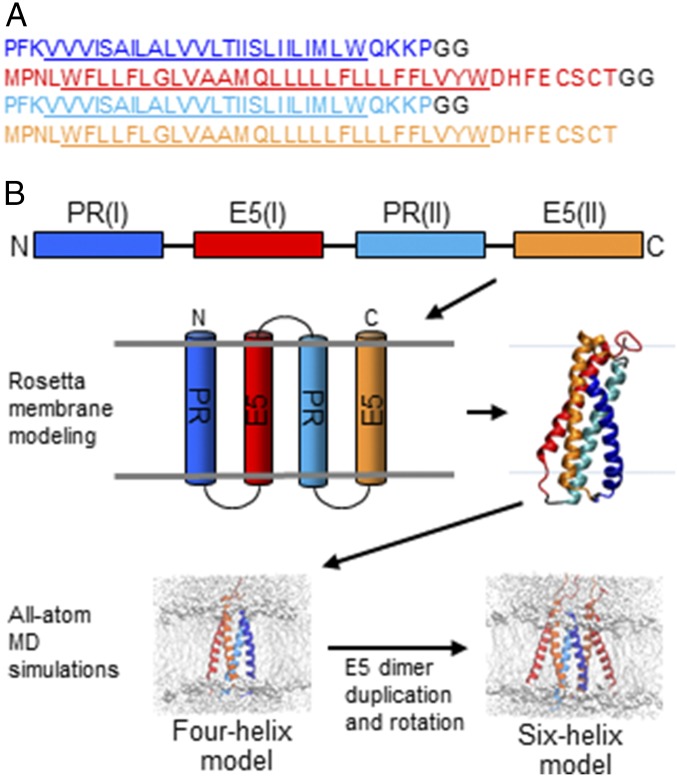
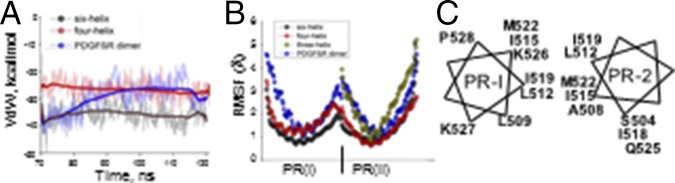
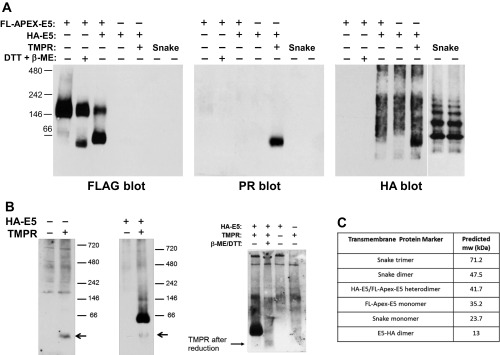
The dimeric 44-residue E5 protein of bovine papillomavirus is the smallest known naturally occurring oncoprotein. This transmembrane protein binds to the transmembrane domain (TMD) of the platelet-derived growth factor β receptor (PDGFβR), causing dimerization and activation of the receptor. Here, we use Rosetta membrane modeling and all-atom molecular dynamics simulations in a membrane environment to develop a chemically detailed model of the E5 protein/PDGFβR complex. In this model, an active dimer of the PDGFβR TMD is sandwiched between two dimers of the E5 protein. Biochemical experiments showed that the major PDGFβR TMD complex in mouse cells contains two E5 dimers and that binding the PDGFβR TMD to the E5 protein is necessary and sufficient to recruit both E5 dimers into the complex. These results demonstrate how E5 binding induces receptor dimerization and define a molecular mechanism of receptor activation based on specific interactions between TMDs.

Keywords: BPV; blue native gel electrophoresis; oncogene; transmembrane protein complex; traptamer.


Conflict of interest statement

The authors declare no conflict of interest.

Figures

Fig. 1.
Fig. 1.
Modeling strategy. (A) Amino acid sequence of the virtual snake consisting of two TMDs of the PDGFβR and two TMDs of the BPV E5 protein. E5 sequences are orange [E5(I)] and red [E5(II)], PDGFβR TMD sequences are dark [PR(I)] and light [PR(II)] blue, and glycine linkers are black, with the predicted TMDs underlined. All sequences are written N-to-C. (B) Schematic overview of the multistep modeling strategy. Color scheme is as in A.
Fig. S1.
Fig. S1.
Selection of the preferred Rosetta model. (A) The structure of a fragment of the acetylcholine receptor consisting of three consecutive TMDs was used to evaluate the impact of the sequence of the linkers connecting the TMDs. Rosetta membrane ab initio models were obtained for the wild-type (WT) sequence (PDB ID code 2BG9) and repeated when three residues of the two interhelical linkers were replaced by two glycine or proline residues. These two residue types were selected for the mock linkers since they destabilize helix formation and maximize structural flexibility. Shown are the energy and rmsd values to the experimentally determined structure for the 200 best clusters obtained in each of the three Rosetta simulations. Similar results were obtained in the three cases. Two well-defined groups of clusters were observed: Those with rmsd 4–6 Å were considered reasonably good representations of the original structure, while those with rmsd 8–10 Å adopted, in most cases, a different helical arrangement than the original structure. The similarity between the wild-type structure and the structures obtained with linkers demonstrates the flexibility of the Rosetta membrane in achieving a similar structural fold, with little influence of the linkers connecting the TMDs. We chose glycine as the linker residue of choice since clusters of lower energy were obtained than when using proline residues. (B) Cartoon demonstrating dihedral angles analyzed between the E5 protein and PDGFβR in the Rosetta modeling. The E5 and PDGFβR TM helices are colored as in Fig. 1. Plane 1 is colored white; the other planes are clear. The residues in E5 or PDGFβR TMD used to demarcate the planes are labeled. (C, Upper) Sequences of the E5 protein from fibropapillomaviruses infecting different ungulate species. Red, hydrophobic amino acids; green, polar amino acids; blue, acidic amino acids. (C, Lower) Dihedral angle analysis of the top 50 clusters for the four E5 proteins. The two regions where most of the clusters concentrated are circled. (D) The clusters of structures for the Rosetta membrane model of PDGFβR and BPV E5 protein satisfying criterion 1 are shown in red. Visual inspection of the helices for proper membrane insertion and absence of gross helical kinks eliminated all but four clusters, marked 6, 8, 33, and 46. The two regions where the 16 clusters concentrate, as shown in E, are boxed. Similar clusters are found for the deer, ovine, and WRD E5 proteins. (E) Selection criterion 3: Comparison with E5 proteins of fibropapillomaviruses infecting different ungulate species. Rosetta clusters of the other E5 protein/PDGFβR complex were compared with the BPV E5/PDGFβR clusters, and rmsd compared with the BPV E5 cluster is shown in logarithm scale. Clusters are ranked by energy, with the lower cluster numbers having the more favorable energies. The dashed lines are drawn marking the lowest rmsd that included a structure from all three species. The names of the clusters are underlined when clusters with rmsd < 5 Å compared with BPV E5 are found. Clusters 8, 33, and 46 satisfy the criterion of rmsd < 5 Å, and cluster 6 is ruled out. (F) Selection criterion 4: Comparison with E5 variants containing mutations selected in a genetic screen. We compared two active E5 mutants, LRM4 and LRM19, which contain several amino acid replacements, as shown in F, Upper, as is the antiparallel sequence of the PDGFβR TMD (22). The residues boxed in green are thought to interact directly. The graphs show the clusters of mutant E5 protein/PDGFβR compared with the wild-type BPV E5/PDGFβR clusters as described in E, with LRM4 and LRM19 clusters shown in orange Xs and blue asterisks, respectively. The dashed lines are drawn marking the lowest rmsd that included a cluster from both E5 mutants. Clusters 8 and 33 satisfy the criterion of rmsd < 5 Å, and cluster 46 is ruled out. For reference, the data in E are overlaid. (G) Selection criterion 5: Comparison with E5 mutants with substitutions at the key residue Gln-17 and evaluation of permuted snake. The clusters of two active E5 mutants, glutamine-17 to tryptophan and glutamine-17 to serine, were compared with the wild-type BPV E5/PDGFβR clusters as described in E. Similarly, red triangles depict data obtained when a virtual polypeptide snake with a permuted order of the E5 and the PDGFβR TMDs was compared with the clusters derived from the original E5/PDGFβR snake. The dashed lines are drawn marking the lowest rmsd that included a structure from both E5 mutants and the permuted snake. Only cluster 33 showed rmsd < 5 Å.
Fig. S2.
Fig. S2.
The rmsd of models and biochemical validation of cell lines. (A) The rmsd was calculated for Cα atoms in the TM region of the four-helix model (Left) and six-helix model [PDGFβR: K499–Q525; E5(I)/E5(m):N3–H34; E5(II)/E5(IV): N3–Y31; Right]. (B) Schematic diagram of E5 proteins and PDGFβR constructs used in coimmunoprecipitation experiments. The horizontal lines represent the membrane, with the extracellular/luminal space on the top. The red lines represent the E5 protein, and the blue lines represent the wild-type (WT) and threonine-513 to leucine-513 (T513L) mutant of the full-length PDGFβR or the doubly truncated receptor (TMPR). The T513L mutation is indicated by the ×. The green line is the Put3 segment in FLAG-Put3–E5. The dotted lines represent the disulfide bond in the E5 dimers. H and F represent the HA and FLAG tag, respectively, on the E5 protein. (C) Mobility of differentially tagged E5 proteins. HA-E5 and FLAG-Put3–E5 were separately expressed in BaF3 cells. (C, Right) Detergent extracts of cells expressing HA-E5 were directly electrophoresed in the presence (+) or absence (−) of the reducing agent DTT and immunoblotted with anti-HA antibody. (C, Left) Extracts of cells expressing FLAG-Put3–E5 were immunoprecipitated with anti-FLAG antibody before DTT or mock treatment, electrophoresed, and immunoblotted with anti-FLAG antibody. d and m indicate dimeric and monomeric forms of the tagged E5 proteins, respectively. Mobility of protein standards and size (in kilodaltons) is shown on the left. (D) HA-E5 and FLAG-Put3–E5 proteins form heterodimers. Extracts of BaF3 cells expressing HA-E5, FLAG- Put3–E5, or both tagged E5 proteins were immunoprecipitated with anti-FLAG antibody. Cell extracts (input) and immunoprecipitates were subjected SDS/PAGE under reducing conditions and immunoblotted with anti-HA (D, Upper) or anti-FLAG (D, Lower) antibody. Numbers on the right indicate the size in kilodaltons of molecular mass standards.
Fig. 2.
Fig. 2.
Interaction cartoon and overall structure of the four- and six-helix models of E5-PDGFβR complexes obtained by MD simulations. (A) Structures of the two models obtained by MD simulations. Alpha-helices are represented as cylinders. To construct the six-helix model (A, Right), the E5 dimer [E5(I) and E5(II)] in the four-helix model (A, Left) was rotated by 180° around the axis indicated by the vertical dashed line (A, Upper) or the point (A, Lower), thereby generating E5(III) and E5(IV). The entire complex was then subjected to MD simulation. E5(I) and E5(III) domains are in orange, E5(II) and E5(IV) domains are in red, PR(I) domain is in dark blue, and PR(II) domain is in light blue. (B and C) Cartoon representation of the four-helix (B) and six-helix (C) models where each cylinder represents a separate TMD, color coded as in A. Salt bridges are represented by the solid lines, hydrogen bonds are indicated by the dashed lines, and packing interactions are indicated by the dotted lines. For clarity, disulfide bonds between the E5 monomers are not shown, nor are all other interactions. B and C, Left, lateral view. B and C, Right, axial view from extracellular position.
Fig. 3.
Fig. 3.
E5 dimers restrict the dynamics of the PDGFβR TMD dimer and increase its stability. (A) vdW interaction energies between the PDGFβR TMDs calculated for the last 50 ns of MD trajectory for the six-helix (gray), four-helix (red), and PDGFβR dimer (blue) models. Lower energies correspond to better vdW packing. (B) RMSF scan along the last 50 ns of MD trajectory for the PDGFβR TMDs for the six-helix (gray), four-helix (red), three-helix (one E5 dimer and one molecule of the PDGFβR TMD) (yellow), and PDGFβR dimer (blue) models. Each symbol represents an individual backbone N, O, or Cα carbon. The most flexible elements are at the ends of the TMDs at membrane interfaces. The least flexible elements are in the center of the membrane. (C) Helical wheel diagram of the PDGFβR TMD dimer in the six-helix model, with the residues interacting in the interface labeled.
Fig. 4.
Fig. 4.
All-atom structure of six-helix complex obtained by MD simulations. (A) Ribbon diagram overview of the six-helix model viewed from the side. The horizontal lines represent the approximate boundaries of the membrane. The PDGFβR is shown in blue, with the extracellular ligand binding and intracellular kinase domains represented by the ovals attached to the TMDs. E5 proteins are shown in red and orange. (B) Axial view of the complex. Salt bridges between Asp-33 and Lys-499 for E5(II) and PR(II) and for E5(IV) and PR(I) are circled. (C) Enlargement of a side view of the complex showing side chains of residues participating in hydrogen bonds involving E5(I), E5(II), and PR(II) in the middle of the TMDs. E5(II) and E5(IV) are colored red.
Fig. 5.
Fig. 5.
Identification of PDGFβR TMD residues required for E5 action. (A) Chart showing the set of seven PRFM mutants. Top row shows the position of amino acids in the murine PDGFβR TMD sequence. Second row shows the sequence of the wild-type murine PDGFβR, with residues previously implicated in E5 binding highlighted light blue. Other rows show the substitutions in each of the seven PRFM mutants. The two faces shown to be important for activity (B) are colored green (face 3) and yellow (face 7). Face 4 is colored purple. An empty cell indicates that the mutant contains the wild-type amino acid at that position. (B) BaF3 cells expressing the wild-type PDGFβR or the indicated PRFM mutant were infected with MSCVp or with MSCVp expressing the wild-type BPV E5 protein or v-sis. After selection for puromycin resistance, cells were incubated in medium lacking IL-3. The average number of viable cells 6 or 7 d after IL-3 removal is shown for E5 (black bars) and v-sis (gray bars). The background number of IL-3–independent cells after transduction of MSCVp was subtracted in each experiment. Each receptor mutant was tested with E5 and v-sis in at least five independent experiments. Statistical significance of the results was determined by using a Welch’s two-tailed t test with unequal variances. (C) Detergent extracts were prepared from BaF3 cells expressing the wild-type PDGFβR (W) or the indicated PRFM mutant in the presence (+) or absence (−) of the E5 protein. Extracts were immunoprecipitated with anti-PDGF receptor antibody, subjected to gel electrophoresis, and immunoblotted with anti-PDGF receptor antibody (C, Lower) to detect total PDGFβR and with anti-phosphotyrosine antibody (C, Upper) to detect PDGFβR tyrosine phosphorylation. Similar results were obtained in three independent replicate experiments.
Fig. 6.
Fig. 6.
PDGFβR recruits more than one E5 dimer into the receptor/E5 protein complex. Detergent extracts were prepared from BaF3 cells expressing the wild-type (W) or T513L (M) human PDGFβR (PR) or no PDGFβR (−); the HA-tagged E5 protein; or the FLAG-tagged Put3–E5 protein, as indicated. Extracts were immunoprecipitated (IP) with anti-FLAG (F) or anti-HA (H) antibody as indicated and electrophoresed on a nonreducing denaturing gel to disrupt noncovalent complexes while maintaining disulfide-linked E5 dimers. After transfer, the filter was probed with anti-HA antibody (Left) and then stripped and reprobed with anti-FLAG antibody (Right). The size of mobility markers (in kilodaltons) is shown in the center. Bands representing the monomeric and dimeric forms of the tagged E5 proteins are shown with arrows. The band marked with * in the HA blot appears to be a heterodimer between HA- and FLAG-tagged E5. Similar results were obtained in three independent replicate experiments.
Fig. S3.
Fig. S3.
Expression of and complex formation of E5 and PDGFβR constructs. (A) Detergent extracts were prepared from BaF3 cells expressing the full-length wild-type (W) or the T513L mutant (M) PDGFβR, or no PDGFβR (−); the HA-tagged E5 protein; or the FLAG-tagged Put3–E5 protein, as indicated. Extracts were subjected to SDS/PAGE under nonreducing conditions, and blotted with anti-HA antibody (A, Left) and then stripped and reprobed with anti-FLAG (A, Right) antibody, followed by anti-actin antibody. The size of markers (in kilodaltons) is shown in the center. (B) Detergent extracts were prepared from BaF3 cells expressing the full-length wild-type human PDGFβR (HPR), the doubly truncated TMPR (TMPR) PDGFβR, or TMPR containing the T513L transmembrane mutation, as indicated. Extracts were subjected to SDS/PAGE under nonreducing conditions, blotted with anti-HA antibody (B, Left) and then stripped and reprobed with anti-FLAG antibody (B, Right). The size of markers (in kilodaltons) is shown. (C) Detergent extracts were prepared from BaF3 cells expressing the full-length wild-type (W) or T513L mutant (M) PDGFβR or no PDGFβR (−); or the FLAG-tagged Put3–E5 protein, as indicated. All cells expressed the HA-tagged E5 protein. Extracts were immunoprecipitated with anti-PDGF receptor (PR IP) or anti-FLAG (FLAG IP) antibody as indicated, subjected to SDS/PAGE, and blotted with anti-PR. The size of markers (in kilodaltons) is shown at the left. The slower migrating band represents the PDGFβR containing mature carbohydrates; the faster migrating band represents a precursor form of the PDGFβR containing immature carbohydrates. (D) Detergent extracts were prepared from BaF3 cells expressing the FLAG-tagged E5 protein and empty MSVCneo vector (MSCVn), the doubly truncated PDGFβR (TMPR), or TMPR containing a transmembrane mutation (T513L), as indicated. Extracts were immunoprecipitated with anti-PDGF receptor (PR IP) or anti-FLAG (FLAG IP) antibody as indicated, subjected to SDS/PAGE, and blotted with anti-PR. The size of markers (in kilodaltons) is shown.
Fig. 7.
Fig. 7.
PDGFβR TMD is sufficient to recruit more than one E5 dimer into the complex. Samples were prepared and processed as described in the legend to Fig. 6, except that the receptors tested were full-length human PDGFβR (HPR), the doubly truncated TMPR PDGFβR, or TMPR containing a Thr to Leu mutation at position 513 in the middle of the receptor TMD. The size of mobility markers (in kilodaltons) is shown in the center. Bands representing the monomeric and dimeric forms of the tagged E5 proteins are shown with arrows. The band marked with * in the HA blot appears to be a heterodimer between HA- and FLAG-tagged E5. Similar results were obtained in three independent replicate experiments.
Fig. 8.
Fig. 8.
Analysis of the E5/PDGFβR complex by blue native gel electrophoresis. (A) Detergent extracts were prepared from BaF3 cells expressing no PDGFβR (−) or TMPR with a wild-type (W) or T513L mutant (M) TMD. In addition, cells expressed HA-E5, as indicated. A, Left and Center show proteins electrophoresed on the same blue native gel and probed sequentially with anti-HA and anti-PDGF receptor antibodies. A, Right shows similar samples incubated in 0.1% SDS in the presence (+) or absence (−) of reducing agents β-mercaptoethanol and DTT (β-ME/DTT), electrophoresed on a blue native gel, and probed with anti-PDGF receptor antibody. The thin and thick arrows indicate the positions of the HA-E5 dimer and the complex between HA-E5 and TMPR, respectively. Size (in kilodaltons) of soluble molecular mass standards is shown. Similar results were obtained in three independent replicate experiments. A darker exposure of lanes 13–16 is shown in Fig. S4B, Right. (B) Extracts of cells expressing the indicated proteins were electrophoresed on the same blue native gel and blotted sequentially with anti-HA and -FLAG antibodies to detect the TMD molecular mass standards and with anti-PDGF receptor antibody to detect the HA-E5/TMPR complex (shown in red box). Individual lanes were cropped from the same gel and aligned. The original images are shown in Fig. S4A. The labeled arrows show the predicted molecular mass of the TMD standards listed in Fig. S4C. The graph plots the mobility (Rf; distance migrated/length of the gel) of these standards vs. their predicted molecular mass in a representative experiment. The mobility and estimated molecular mass of the HA-E5/TMPR complex electrophoresed on the same gel as these standards is shown by red lines. Similar results were obtained in three independent replicate experiments.
Fig. S4.
Fig. S4.
Molecular-mass determination of the E5/TMPR complex by BN-PAGE. (A) Original images used to construct Fig. 8B. (B) Detection of the doubly truncated PDGFβR (TMPR) by BN-PAGE. Extracts of BaF3 cells expressing TMPR with or without HA-E5 were subjected to BN-PAGE followed by anti-PDGF receptor immunoblotting. (B, Left and Center) The dark band in the cells coexpressing TMPR and HA-E5 is the hexameric complex containing two HA-E5 dimers and a dimer of TMPR. TMPR not bound by E5 is indicated by arrows. Numbers on the right of each panel indicate the size in kilodaltons of soluble molecular mass standards. (B, Right) Darker exposure of gel shown in Fig. 8A, Right. (C) Table showing predicted molecular masses of TM protein markers.
Fig. 9.
Fig. 9.
Helical wheel diagrams of the E5 dimer. Upper shows the amino acids lining the symmetric E5 homodimer interfaces inferred from analysis of active chimeric E5 proteins (11). Lower shows the two E5 dimers in the six-helix model, with amino acids that make interhelical contacts across each E5 dimer interface shown. Amino acids that form contacts in both the six-helix model and in either of the two experimentally determined interfaces are shown in red. Note that Ala-14, Met-16, and Phe-23 stabilize the E5(I)/E5(II) dimer only and Leu-20 and Phe-28 stabilize the E5(III)/E5(IV) dimer only. In all diagrams, amino acids only between positions 10 and 30 are shown.

Similar articles

Cited by

References

    1. DiMaio D, Petti LM. The E5 proteins. Virology. 2013;445:99–114. - PMC - PubMed
    1. Burkhardt A, Willingham M, Gay C, Jeang K-T, Schlegel R. The E5 oncoprotein of bovine papillomavirus is oriented asymmetrically in Golgi and plasma membranes. Virology. 1989;170:334–339. - PubMed
    1. Schlegel R, Wade-Glass M, Rabson MS, Yang Y-C. The E5 transforming gene of bovine papillomavirus encodes a small, hydrophobic polypeptide. Science. 1986;233:464–467. - PubMed
    1. Windisch D, et al. Hydrophobic mismatch drives the interaction of E5 with the transmembrane segment of PDGF receptor. Biophys J. 2015;109:737–749. - PMC - PubMed
    1. Windisch D, et al. Structural role of the conserved cysteines in the dimerization of the viral transmembrane oncoprotein E5. Biophys J. 2010;99:1764–1772. - PMC - PubMed

Publication types

Substances