Comparative Study
. 2017 Sep 29;292(39):16032-16043.
doi: 10.1074/jbc.M117.807461. Epub 2017 Aug 14.

Navigating the conformational landscape of G protein-coupled receptor kinases during allosteric activation

Affiliations
Comparative Study

Navigating the conformational landscape of G protein-coupled receptor kinases during allosteric activation

Xin-Qiu Yao et al. J Biol Chem. .

Abstract

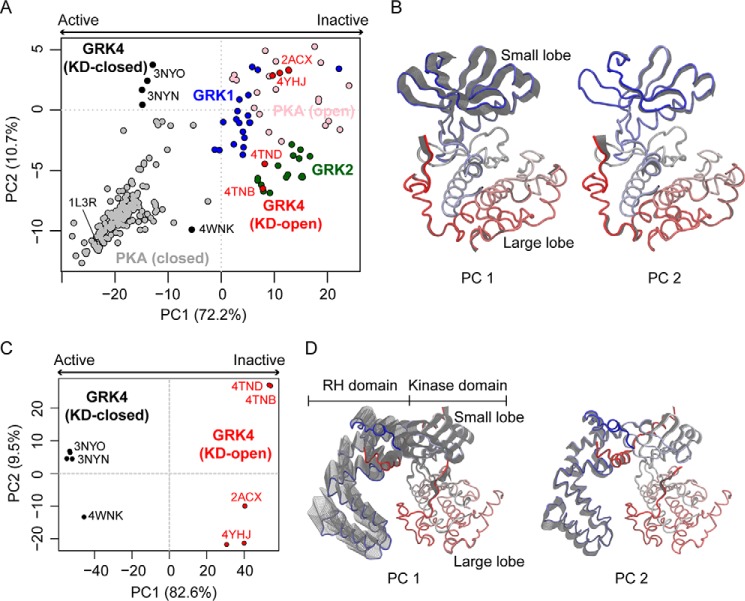
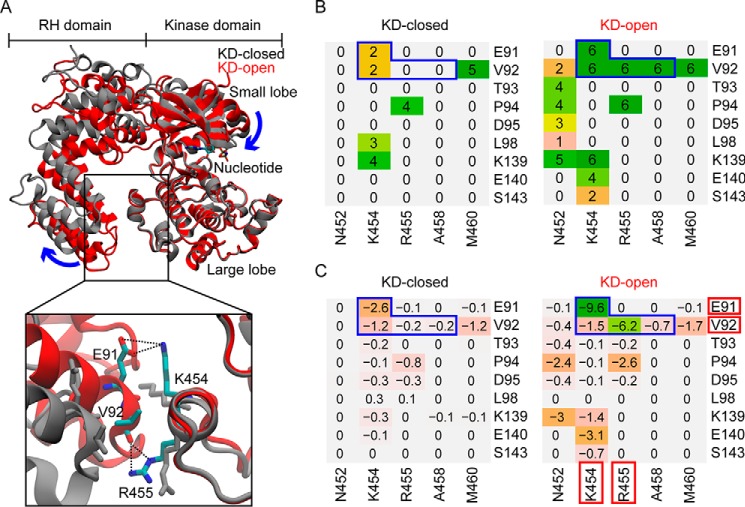
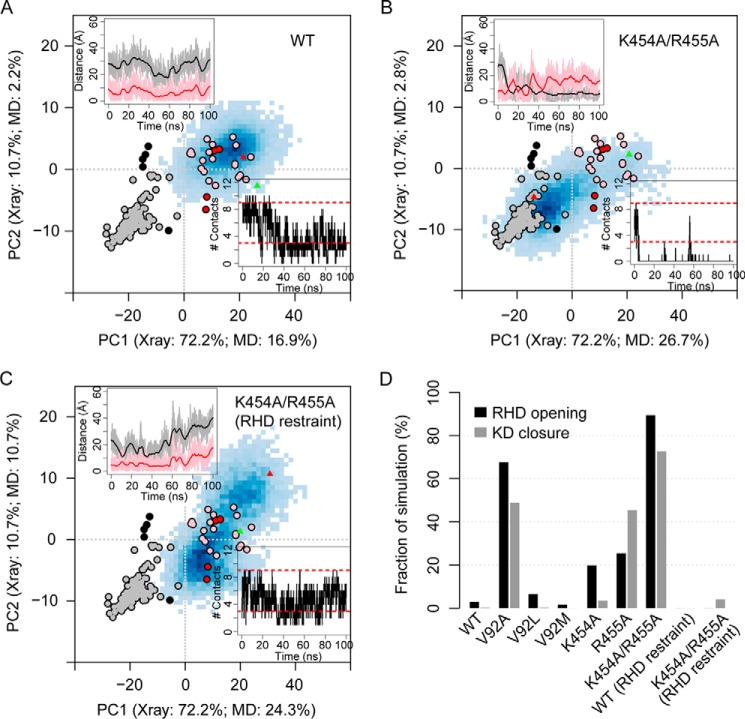
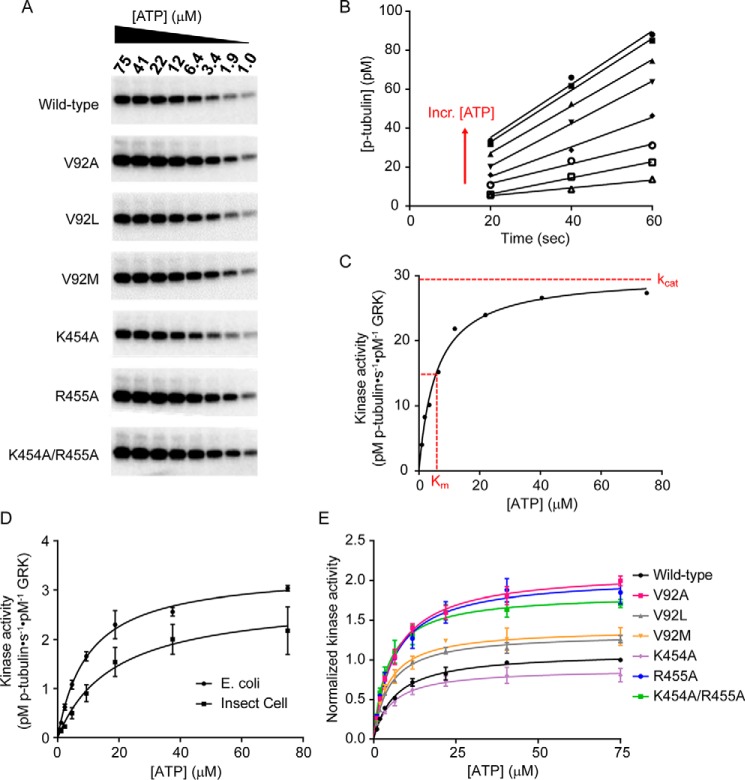
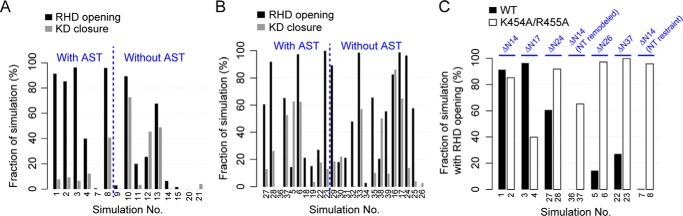
G protein-coupled receptors (GPCRs) are essential for transferring extracellular signals into carefully choreographed intracellular responses controlling diverse aspects of cell physiology. The duration of GPCR-mediated signaling is primarily regulated via GPCR kinase (GRK)-mediated phosphorylation of activated receptors. Although many GRK structures have been reported, the mechanisms underlying GRK activation are not well-understood, in part because it is unknown how these structures map to the conformational landscape available to this enzyme family. Unlike most other AGC kinases, GRKs rely on their interaction with GPCRs for activation and not phosphorylation. Here, we used principal component analysis of available GRK and protein kinase A crystal structures to identify their dominant domain motions and to provide a framework that helps evaluate how close each GRK structure is to being a catalytically competent state. Our results indicated that disruption of an interface formed between the large lobe of the kinase domain and the regulator of G protein signaling homology domain (RHD) is highly correlated with establishment of the active conformation. By introducing point mutations in the GRK5 RHD-kinase domain interface, we show with both in silico and in vitro experiments that perturbation of this interface leads to higher phosphorylation activity. Navigation of the conformational landscape defined by this bioinformatics-based study is likely common to all GPCR-activated GRKs.

Keywords: G protein-coupled receptor (GPCR); Michaelis-Menten; allosteric regulation; molecular dynamics; serine/threonine protein kinase; structure-function.


Conflict of interest statement

The authors declare that they have no conflicts of interest with the contents of this article

Figures

Figure 1.
Figure 1.
PCA reveals distinct crystallographic conformers and collective motions connecting conformers. A, KD-closed (black circles) and -open (red circles) GRK4, GRK1 (blue circles), GRK2 (green circles), and closed (gray circles) and open (pink circles) PKA crystal structures are projected into the PC subspace of a PCA performed on the crystal structures of GRK4 subfamily kinase domain (see supplemental Table S1). KD-closed structures represent a conformational state closer to the kinase active state, whereas KD-open structures represent the kinase inactive state. The numbers in axis labels indicate the percentage of total structural variance captured by the corresponding PC. B, the collective motions associated with PC1 and PC2. Only the kinase domain is shown and is color-coded by residue index (from blue N terminus to red C terminus). The gray shadow indicates the motion along the corresponding PC. C, projection of GRK4 subfamily structures into the PC subspace of a PCA performed on the crystal structures of full-length GRK4 subfamily members. D, the corresponding collective motions revealed by the full-length structure PCA.
Figure 2.
Figure 2.
Residue contact and energy analyses focused on the RHD-large lobe interface identify potential residues involved in GRK activation. A, superposed GRK4 subfamily KD-closed (gray) and KD-open (red) structures. Bottom, a closer view of the RHD-large lobe interface with key residues shown as sticks and their interactions shown as black dotted lines. B, residue contact analysis for each structural group. The value associated with each residue pair indicates the number of structures in the group in which the two residues are in contact. Regions outlined by blue lines contain residue pairs that form contact in all the KD-open structures but either lose the contact completely or form a contact much less frequently in the KD-closed structures. C, residue-residue interaction energy (kcal/mol) averaged over structures calculated for the same residue pairs as in B (see “Experimental procedures”). Residues that form the strongest polar and/or hydrophobic interactions are highlighted by red blocks.
Figure 3.
Figure 3.
Select mutations disrupting domain interactions promote RHD opening and KD closure as revealed by MD simulations. A–C, protein conformations are projected into the PC subspace of a PCA performed on the crystal structures of the GRK4 subfamily kinase domain. Blue shaded areas in each panel represent the conformations sampled by MD with darkness of color indicating sample density. The KD-closed (black circles) and -open (red circles) GRK crystal structures as well as the closed (gray circles) and open (pink circles) PKA crystal structures are shown as references. The start (green triangles) and end (red triangles) of simulation are indicated in the map. The numbers in axis labels indicate the percentage of total variance of the GRK crystal structures and the simulation snapshots, respectively, captured by the corresponding PC. Top left inset, time series of the minimal distance between simulation snapshots and the KD-closed (black; dc) or KD-open (red; do) GRK structures. Bottom right inset, time series of the number of contacts between the RHD and the KD large lobe that are not observed in the KD-closed (RHD-open) crystal structures (Nc). Red dashed lines indicate the lower and upper bounds of Nc in the KD-open (RHD-closed) GRK structures. D, summary of the conformational sampling by the wild-type (WT) and mutant simulations. RHD opening and KD closure are defined by Nc = 0 and dc < do, respectively. All simulations are under the NT restraint and AST removal. Some simulations also contain an additional distance restraint between the RHD and the large lobe. (see supplemental Table S2, simulation numbers 9–15, 20, and 21).
Figure 4.
Figure 4.
Disrupting the RHD-KD interface causes in vitro changes in steady-state parameters. Excess tubulin was incubated with 50 nm kinase, and the [ATP] was varied from 1 to 75 μm to determine kinase activity for wild-type GRK5 expressed in either E. coli or insect cells and for the RHD-KD interface mutants from E. coli. A, tubulin phosphorylation reactions at varying ATP concentrations were quenched at 20, 40, and 60 s; separated by SDS-PAGE; and exposed to a phosphor storage screen overnight. Band intensities were quantified using ImageQuant. A representative gel of the 40-s time points is shown. B, after converting band intensities to pm p-tubulin using an ATP standard curve, [p-tubulin] was plotted as a function of time for each ATP concentration, and lines were fit in Prism to determine initial velocities (i.e. slopes in pm·s−1). Each line represents the three time points at a single ATP concentration, and the direction of the lines corresponding to increasing (Incr.) [ATP] is indicated with a red arrow. Only the wild-type data are shown for clarity. C, the slopes calculated from B were divided by the GRK concentration to calculate kinase activity (pm p-tubulin·s−1·pm−1 GRK), plotted as a function of [ATP], and fit to the Michaelis-Menten curve in Prism to determine kcat and Km. Approximate kcat and Km values are indicated with red dotted lines. D, comparison of wild-type human GRK5 purified from either insect cells or E. coli shows no major differences in kinase activity, kcat, or Km. E, for each independent experiment, kinase activity of the RHD-KD mutants was normalized to wild type and fit to the Michaelis-Menten curve to determine Km values and kcat values relative to wild type. Each curve is the average of n = 3 experiments, and error bars represent S.E.
Figure 5.
Figure 5.
Distinct models of the AST and NT substantially affect the dynamics of RHD and KD in MD simulations. A, fraction of simulation time of observing RHD opening and KD closure under the conditions with or without the AST loop. In the simulations shown, the NT either has the same length as that present in the initial crystallographic structure (Protein Data Bank code 4TND), i.e. is truncated by 14 residues or ΔN14, or is only slightly shorter (i.e. ΔN17). B, the same as A except that in all the displayed simulations the NT is either largely truncated (ΔN24, ΔN26, and ΔN37) or remodeled as a random loop for residues 15–24. C, RHD opening observed in the simulations for the wild-type (WT) and the double mutant K454A/R455A under various NT truncation, remodeling, and restraint conditions.

References

    1. Katritch V., Cherezov V., and Stevens R. C. (2012) Diversity and modularity of G protein-coupled receptor structures. Trends Pharmacol. Sci. 33, 17–27 - PMC - PubMed
    1. Ritter S. L., and Hall R. A. (2009) Fine-tuning of GPCR activity by receptor-interacting proteins. Nat. Rev. Mol. Cell Biol. 10, 819–830 - PMC - PubMed
    1. Shukla A. K., Singh G., and Ghosh E. (2014) Emerging structural insights into biased GPCR signaling. Trends Biochem. Sci. 39, 594–602 - PubMed
    1. Rockman H. A., Koch W. J., and Lefkowitz R. J. (2002) Seven-transmembrane-spanning receptors and heart function. Nature 415, 206–212 - PubMed
    1. Ferguson S. S. (2001) Evolving concepts in G protein-coupled receptor endocytosis: the role in receptor desensitization and signaling. Pharmacol. Rev. 53, 1–24 - PubMed

Publication types

MeSH terms

Substances

LinkOut - more resources