. 2017 Sep 22;292(38):15892-15906.
doi: 10.1074/jbc.M117.798702. Epub 2017 Aug 14.

Linchpin DNA-binding residues serve as go/no-go controls in the replication factor C-catalyzed clamp-loading mechanism

Affiliations

Linchpin DNA-binding residues serve as go/no-go controls in the replication factor C-catalyzed clamp-loading mechanism

Juan Liu et al. J Biol Chem. .

Abstract

DNA polymerases depend on circular sliding clamps for processive replication. Clamps must be loaded onto primer-template DNA (ptDNA) by clamp loaders that open and close clamps around ptDNA in an ATP-fueled reaction. All clamp loaders share a core structure in which five subunits form a spiral chamber that binds the clamp at its base in a twisted open form and encloses ptDNA within, while binding and hydrolyzing ATP to topologically link the clamp and ptDNA. To understand how clamp loaders perform this complex task, here we focused on conserved arginines that might play a central coordinating role in the mechanism because they can alternately contact ptDNA or Walker B glutamate in the ATPase site and lie close to the clamp loader-clamp-binding interface. We mutated Arg-84, Arg-88, and Arg-101 in the ATPase-active B, C, and D subunits of Saccharomyces cerevisiae replication factor C (RFC) clamp loader, respectively, and assessed the impact on multiple transient events in the reaction: proliferating cell nuclear antigen (PCNA) clamp binding/opening/closure/release, ptDNA binding/release, and ATP hydrolysis/product release. The results show that these arginines relay critical information between the PCNA-binding, DNA-binding, and ATPase sites at all steps of the reaction, particularly at a checkpoint before RFC commits to ATP hydrolysis. Moreover, their actions are subunit-specific with RFC-C Arg-88 serving as an accelerator that enables rapid ATP hydrolysis upon contact with ptDNA and RFC-D Arg-101 serving as a brake that confers specificity for ptDNA as the correct substrate for loading PCNA.

Keywords: ATPase; DNA replication; clamp loader; pre-steady-state kinetics; proliferating cell nuclear antigen (PCNA); replication factor C (RFC).


Conflict of interest statement

The authors declare that they have no conflicts of interest with the contents of this article

Figures

Figure 1.
Figure 1.
Select DNA-binding residues involved in RFC-catalyzed PCNA loading on DNA. A, main stages of the clamp-loading reaction. B, front and bottom views of the RFC-ATPγS-PCNAclosed complex (Protein Data Bank code 1SXJ (12)) showing RFC subunits A (light gray), B (red), C (green), D (orange), and E (dark gray) and PCNA (blue) and highlighting DNA-binding residues as spheres in subunits B (Arg-84, Arg-90, and Lys-149), C (Arg-88, Arg-94, and Lys-152), and D (Arg-101, Arg-107, and Arg-175). C, a model of RFC-ATPγS-PCNAopen complex derived from Protein Data Bank code 1SXJ (35) showing arginines RFC-B Arg-84, RFC-C Arg-88, and RFC-D Arg-101 (mutated to alanine in this study) in contact with ATPase site Walker B glutamates RFC-B Glu-115, RFC-C Glu-118, and RFC-D Glu-141, respectively (ATPγS shown as sticks in each site; see supplemental movie). MDCC (three dyes) and AF (one of three dye pairs at subunit interfaces) denote dye locations on PCNA.
Figure 2.
Figure 2.
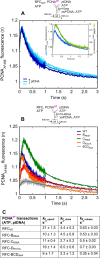
Arginine mutants exhibit RFC subunit-specific defects in ATP-induced, DNA-independent PCNA binding and opening. A, PCNA binding was measured by fluorescence increase over time on mixing PCNAMDCC with wild-type or mutant RFC in the presence of ATP (final concentrations: 0.1–0.4 μm RFC, 0.02 μm PCNAMDCC, and 0.5 mm ATP), and dissociation by signal decrease on mixing RFC, PCNAMDCC, and ATP with excess unlabeled PCNA (final concentrations: 0.2 μm RFC, 0.02 μm PCNAMDCC, 0.5 mm ATP, and 1 μm PCNA). The table lists rates from a single-exponential fit of the data (supplemental Fig. S1). B and C, PCNA opening was measured by signal increase over time on mixing PCNAAF and RFC in the presence of ADP or ATP (final concentrations: 0.2 μm RFC, 0.02 μm PCNAAF, and 0.5 mm ATP or ADP); the data were fit to a single-exponential function. Wild-type RFC opens PCNA in an ATP-dependent manner at 2.3 ± 0.02 s−1, and the mutants exhibit varying defects: RFC-BR84A and RFC-CR88A are able to partially open the clamp (at 2.8 ± 0.02 and 2 ± 0.03 s−1, respectively), whereas RFC-DR101A and the RFC-BCDAAA triple mutant appear unable to do so.
Figure 3.
Figure 3.
Arginine mutants exhibit RFC subunit-specific defects in ptDNA binding, positioning, and release. A, ptDNA binding/positioning in RFC was measured by fluorescence increase on rapidly mixing ptDNATAMRA with RFC, PCNA, and non-hydrolyzable ATPγS (final concentrations: 0.1 μm RFC, 0.4 μm PCNA, 0.02 μm ptDNATAMRA, and 100 μm ATPγS). RFC-BR84A, RFC-CR88A, RFC-DR101A, and RFC-BCDAAA exhibit progressively slower rates compared with wild-type RFC; however, all achieve the same relative change in signal amplitude over time (except RFC-BCDAAA reaches 75% in 60 s). B, a double mixing experiment, in which wild-type RFC and PCNA were first incubated with ATP with enough time for binding but not hydrolysis and then mixed with ptDNATAMRA, shows an initial signal decrease that depends on RFC concentration and yields a binding rate of 109 m−1 s−1 (inset shows a shorter time scale). A subsequent signal increase is independent of RFC concentration and yields a rate of 20 s−1; the data were fit with a two-exponential function (final concentrations: 0.08, 0.1, and 0.15 μm RFC; 0.4 μm PCNA; 0.02 μm ptDNATAMRA; and 0.5 mm ATP). C, a double mixing experiment, in which RFC, PCNA, and ATP were first incubated with ptDNATAMRA for enough time to complete binding and then mixed with excess unlabeled ptDNA, shows signal increase at varying rates and extents with RFC mutants (D). A subsequent chase-dependent signal decrease reports ptDNA release at 2.7 ± 0.06 s−1 by wild-type RFC after ATP hydrolysis (supplemental Fig. S2C); the data were fit with a two-exponential function (final concentrations: 0.15 μm RFC, 0.4 μm PCNA, 0.02 μm ptDNATAMRA, 0.5 mm ATP, and 1 μm ptDNA). D, the table lists rates obtained from experiments in B and C. RFC-DR101A binds ptDNA more slowly and appears to position only a small fraction compared with wild type, RFC-CR88A positions and releases ptDNA more slowly than wild type, and RFC-BCDAAA has very low activity overall.
Figure 4.
Figure 4.
Additional PCNA opening is induced by ptDNA binding/positioning in RFC. A, a double mixing experiment, in which wild-type RFC, PCNAAF, and ATP (RFC-ATP-PCNAopen) were first incubated with ptDNA for enough time to complete binding and then mixed with excess unlabeled PCNA, shows initial ptDNA concentration-independent fluorescence increase at 21 s−1, which reflects further PCNA opening. A subsequent signal decrease occurs in two phases: the first at 4.4 ± 0.3 s−1 is chase-independent and indicates PCNA closure (supplemental Fig. S3), and the second at 0.63 ± 0.03 s−1 is chase-dependent and indicates further PCNA closure upon release from RFC; the data were fit with a two-exponential function (final concentrations: 0.025 μm RFC; 0.02 μm PCNAAF; 0.1, 0.2, and 0.4 μm ptDNA; 0.5 mm ATP; and 1 μm PCNA). The inset overlays PCNAAF (blue) and ptDNATAMRA (green; Fig. 3C) traces, highlighting the coincidence of ptDNA positioning and secondary PCNA opening as well as ptDNA release and PCNA closure. B, in similar experiments with mutants, RFC-BR84A and RFC-CR88A exhibit slightly slower ptDNA-induced PCNA opening, whereas RFC-DR101A is comparable with wild-type RFC; RFC-CR88A also exhibits slower PCNA closure after ATP hydrolysis, resulting in complex accumulation; and RFC-BCDAAA has very low activity overall. C, the table lists rates obtained from experiments in A and B.
Figure 5.
Figure 5.
RFC-C Arg-88 enables completion of PCNA loading on binding of ptDNA, and RFC-D Arg-101 confers specificity for ptDNA. A, a double mixing experiment, in which RFC, PCNAMDCC, and ATP (RFC-ATP-PCNAopen) were first incubated with ptDNA for enough time to complete binding and then mixed with excess unlabeled PCNA, shows initial fluorescence increase at ∼8 s−1. The rate is independent of ptDNA concentration (supplemental Fig. S4A), indicating PCNA isomerization. Subsequent chase-dependent signal decrease occurs in two phases (supplemental Fig. S4B): at 0.5 ± 0.02 s−1, reflecting PCNA release from RFC, and at 0.1 ± 0.003 s−1, likely due to PCNAMDCC subunit exchange with unlabeled PCNA; the data were fit with a three-exponential function (final concentrations: 0.025 μm RFC, 0.02 μm PCNAMDCC, 0.15 μm ptDNA, 0.5 mm ATP, and 1 μm PCNA). RFC-CR88A exhibits slower PCNA isomerization and release compared with wild-type RFC, and RFC-BCDAAA exhibits no PCNA isomerization, only slow release. B, an overlay of wild-type RFC kinetics after formation of the RFC-ATP-PCNAopen-ptDNA collision complex allows visual comparison of rapid ptDNA positioning at 20 s−1 (ptDNATAMRA signal increase; Fig. 3C), a burst of ATP hydrolysis at 30 ± 5 s−1 ([32P]ADP formation reported previously (17)), PCNA isomerization (PCNAMDCC signal increase; A), Pi release after a slight lag (PBPMDCC signal increase; C), and PCNA release (PCNAMDCC signal decrease; A). C, double mixing experiments, in which RFC and PCNA were first incubated with ATP for enough time to open PCNA and then mixed with ptDNA and PBPMDCC reporter, show a burst of Pi release in the first turnover followed by a linear steady state for wild-type RFC, RFC-BR84A, and RFC-DR101A. RFC-CR88A shows almost no burst, and RFC-BCDAAA shows a lag (final concentrations: 0.5 μm RFC, 1 μm PCNA, 2.5 μm ptDNA, 0.5 mm ATP, and 10 μm PBPMDCC). ATPase activity of wild-type RFC in the absence of DNA (± PCNA) is also shown. D, in analogous experiments with ssDNA, only RFC-DR101A exhibits a burst of Pi release comparable with that of wild-type RFC with ptDNA (C).
Scheme 1.
Scheme 1.
A kinetic model of the RFC-catalyzed PCNA-loading mechanism. All experimental data for wild-type RFC were fit to this model with measured rate constants used as initial estimates for global fitting (Fig. 6). Key conformational changes reported by PCNA and ptDNA are highlighted by subscript labels. PCNAOpen1 is in a partially open state before and after initial contact with ptDNA (DNAR-On). PCNAOpen2 is in a fully open state as ptDNA is positioned in the complex (DNAR-In). PCNAOpen3 is a state after ATP hydrolysis but before clamp closure. PCNAClose1 denotes clamp closure as ptDNA is released from RFC (DNAR-Out). PCNAClose2 is a final closed state loaded on ptDNA. * indicates that PCNAOpen3 may occur with step 7 (Pi release). Rate constants obtained from global analysis of the data are noted at each step. ND, not determined.
Figure 6.
Figure 6.
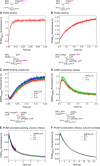
Global fitting of kinetic data to an RFC-catalyzed PCNA-loading mechanism. All kinetic data for wild-type RFC were fit simultaneously using KinTek Explorer (42) to the model shown in Scheme 1. The smooth lines overlaid on the data are fits generated by the model based on the kinetic parameters noted in Scheme 1. A, PCNA binding to RFC measured by increase in PCNAMDCC fluorescence. B, PCNA opening by RFC measured by increase in PCNAAF fluorescence. C, DNA binding and positioning measured by decrease and increase in ptDNATAMRA fluorescence, respectively. D, DNA positioning followed by release after ATP hydrolysis measured by increase and decrease in ptDNATAMRA fluorescence, respectively. E, additional PCNA opening followed by closure and release after ATP hydrolysis measured by increase and decrease in PCNAAF fluorescence, respectively. F, PCNA isomerization and release after ATP hydrolysis (followed by subunit exchange with unlabeled PCNA) measured by increase and decrease in PCNAMDCC fluorescence, respectively.

References

    1. O'Donnell M., Langston L., and Stillman B. (2013) Principles and concepts of DNA replication in bacteria, archaea, and eukarya. Cold Spring Harb. Perspect. Biol. 5, a010108. - PMC - PubMed
    1. Johnson A., and O'Donnell M. (2005) Cellular DNA replicases: components and dynamics at the replication fork. Annu. Rev. Biochem. 74, 283–315 - PubMed
    1. Kelch B. A. (2016) Review: The lord of the rings: structure and mechanism of the sliding clamp loader. Biopolymers 105, 532–546 - PubMed
    1. Kelch B. A., Makino D. L., O'Donnell M., and Kuriyan J. (2012) Clamp loader ATPases and the evolution of DNA replication machinery. BMC Biol. 10, 34. - PMC - PubMed
    1. Boehm E. M., Gildenberg M. S., and Washington M. T. (2016) The many roles of PCNA in eukaryotic DNA replication. Enzymes 39, 231–254 - PMC - PubMed

MeSH terms

Substances

Associated data

LinkOut - more resources