. 2017 Sep 26;372(1730):20160543.
doi: 10.1098/rstb.2016.0543.

Slow induction of photosynthesis on shade to sun transitions in wheat may cost at least 21% of productivity

Affiliations

Slow induction of photosynthesis on shade to sun transitions in wheat may cost at least 21% of productivity

Samuel H Taylor et al. Philos Trans R Soc Lond B Biol Sci. .

Abstract

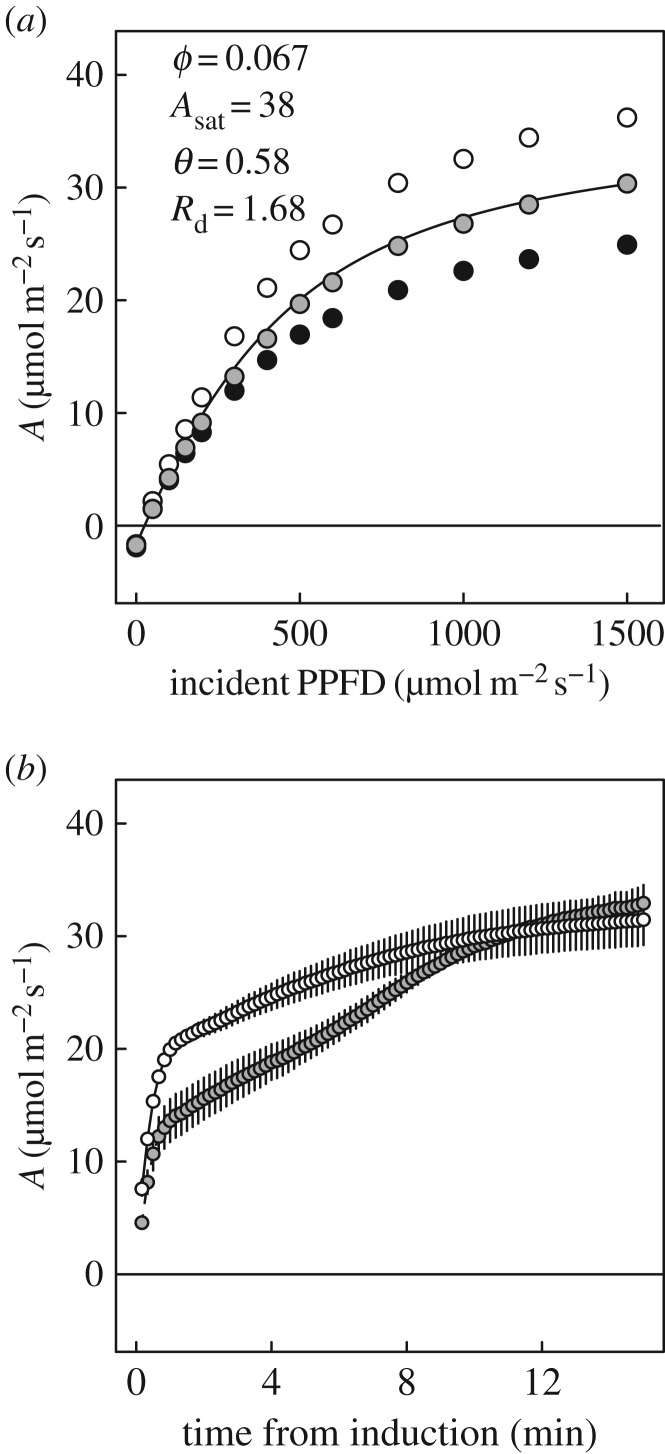
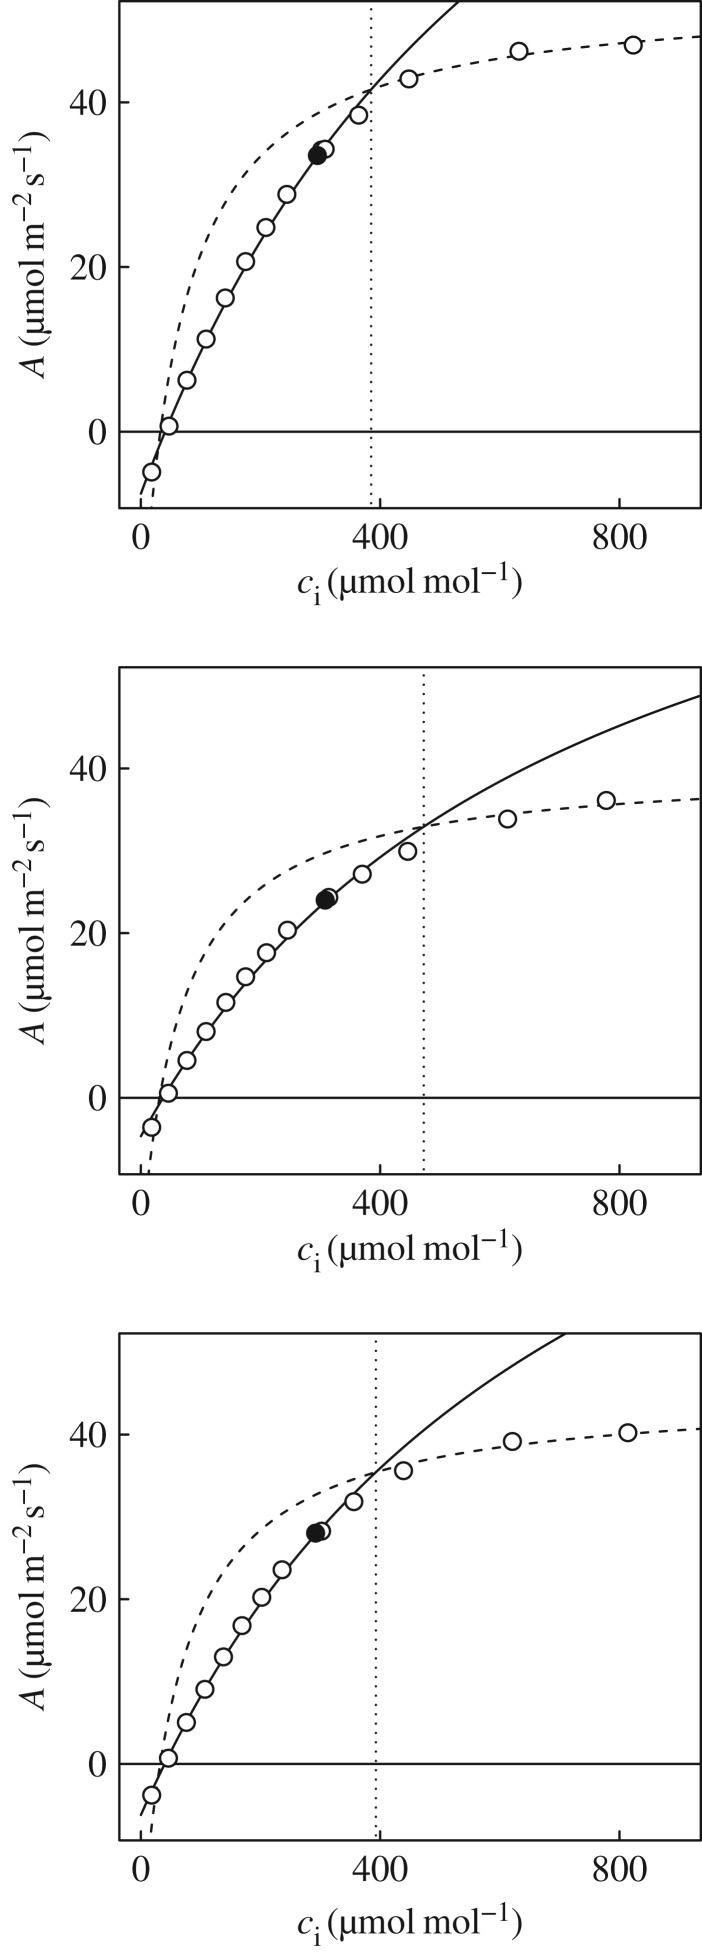
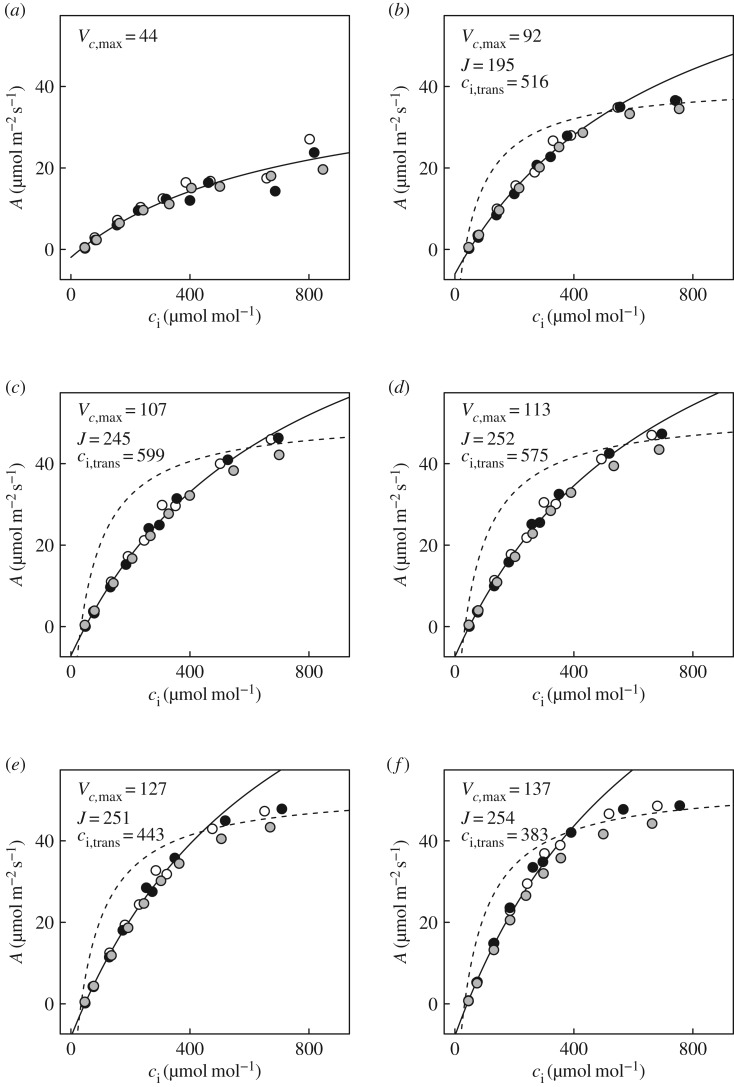
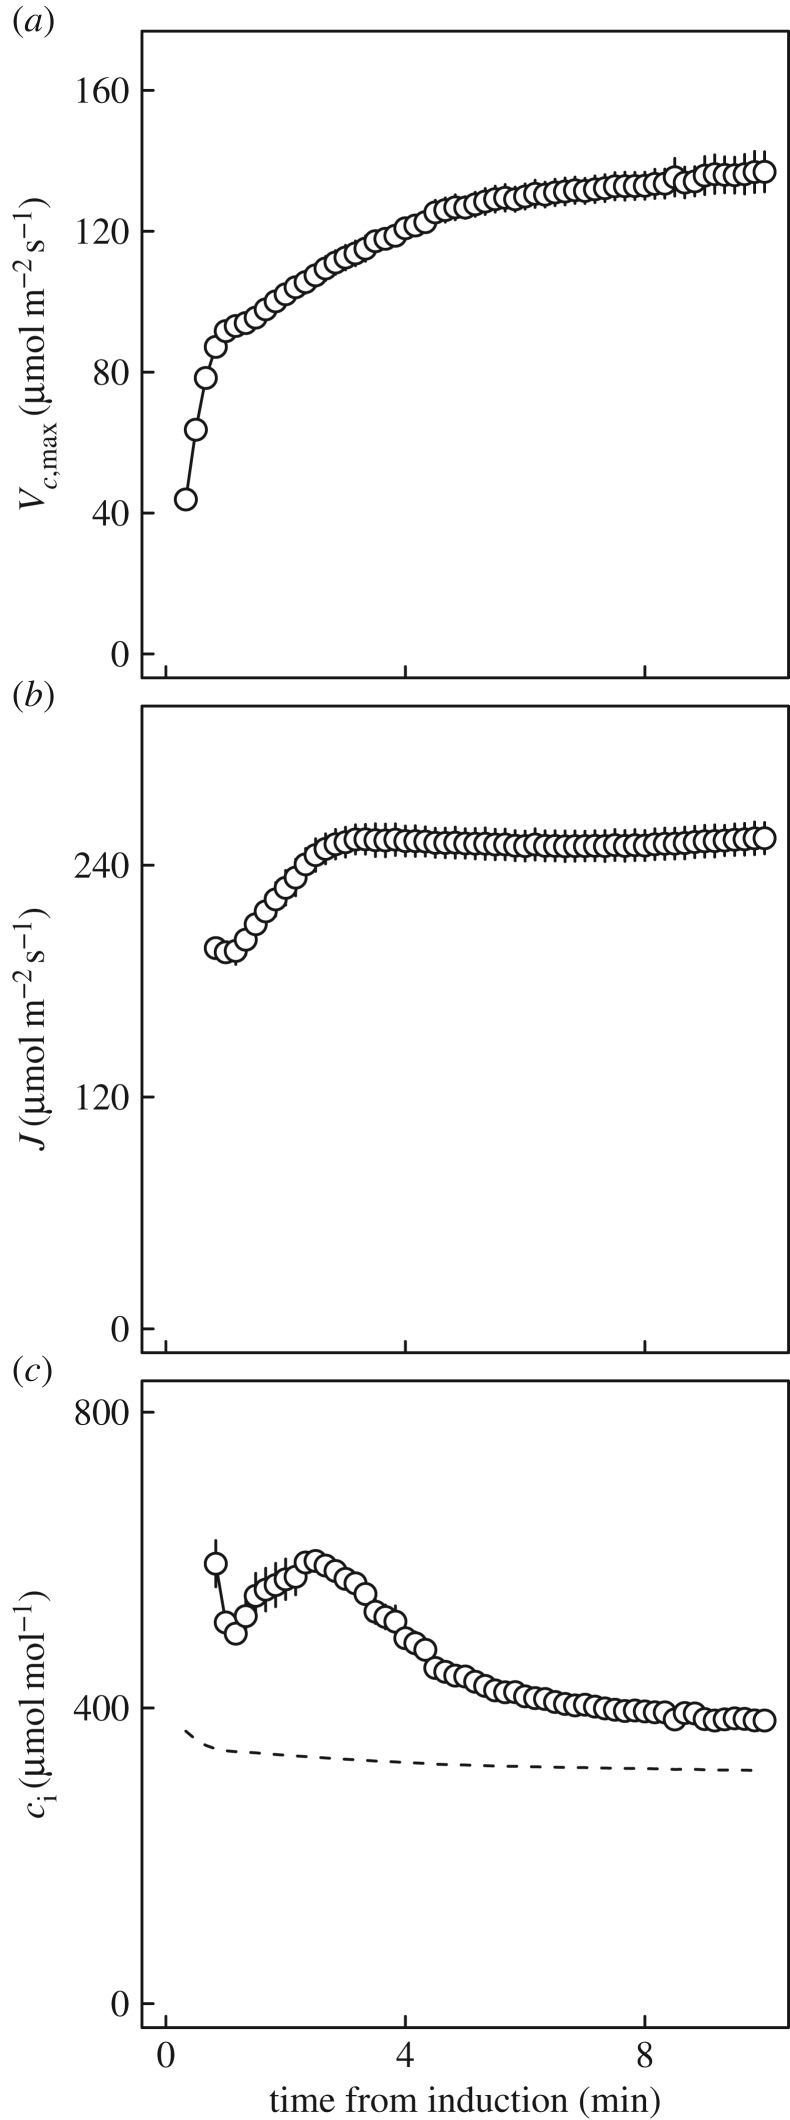
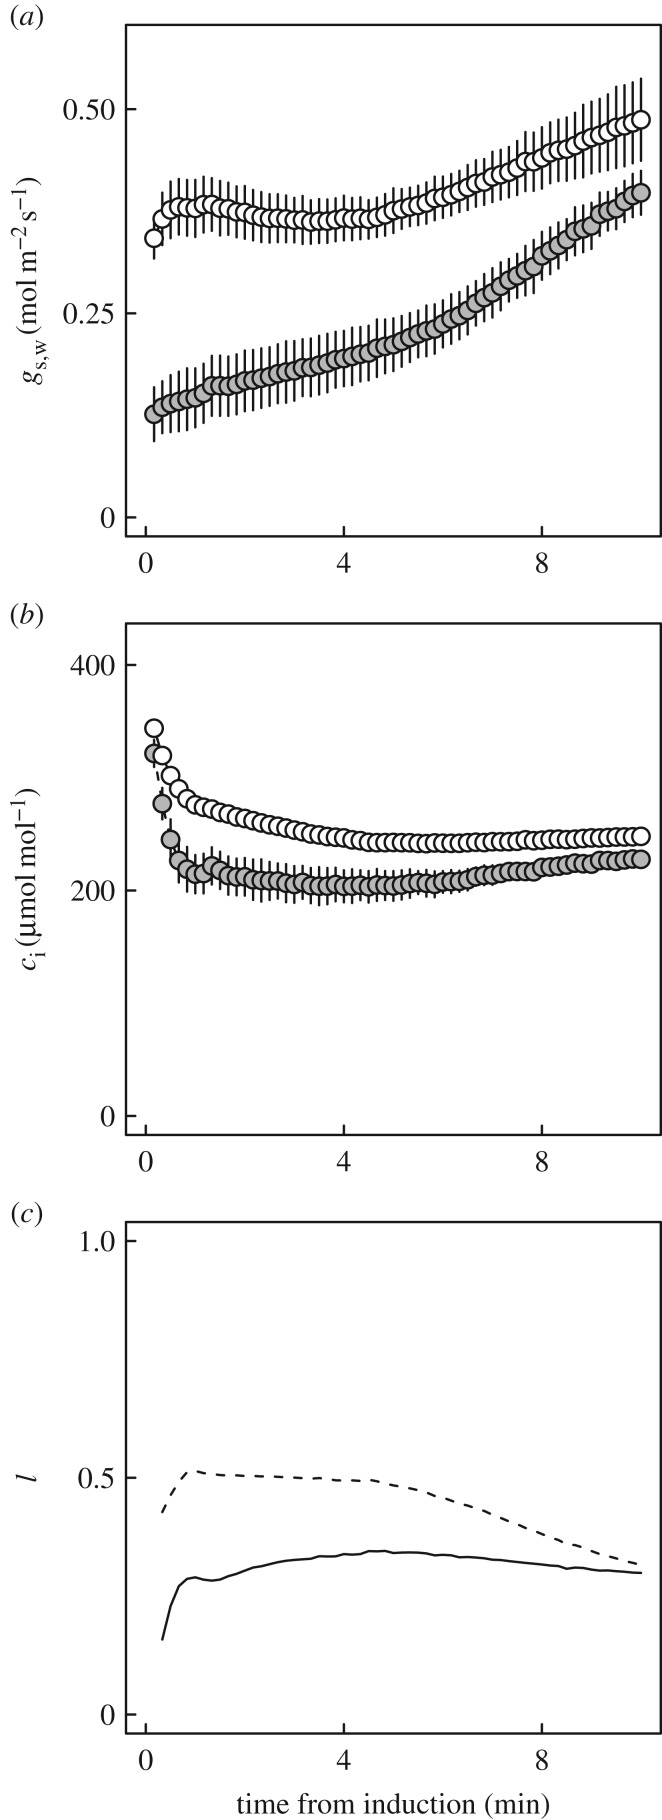
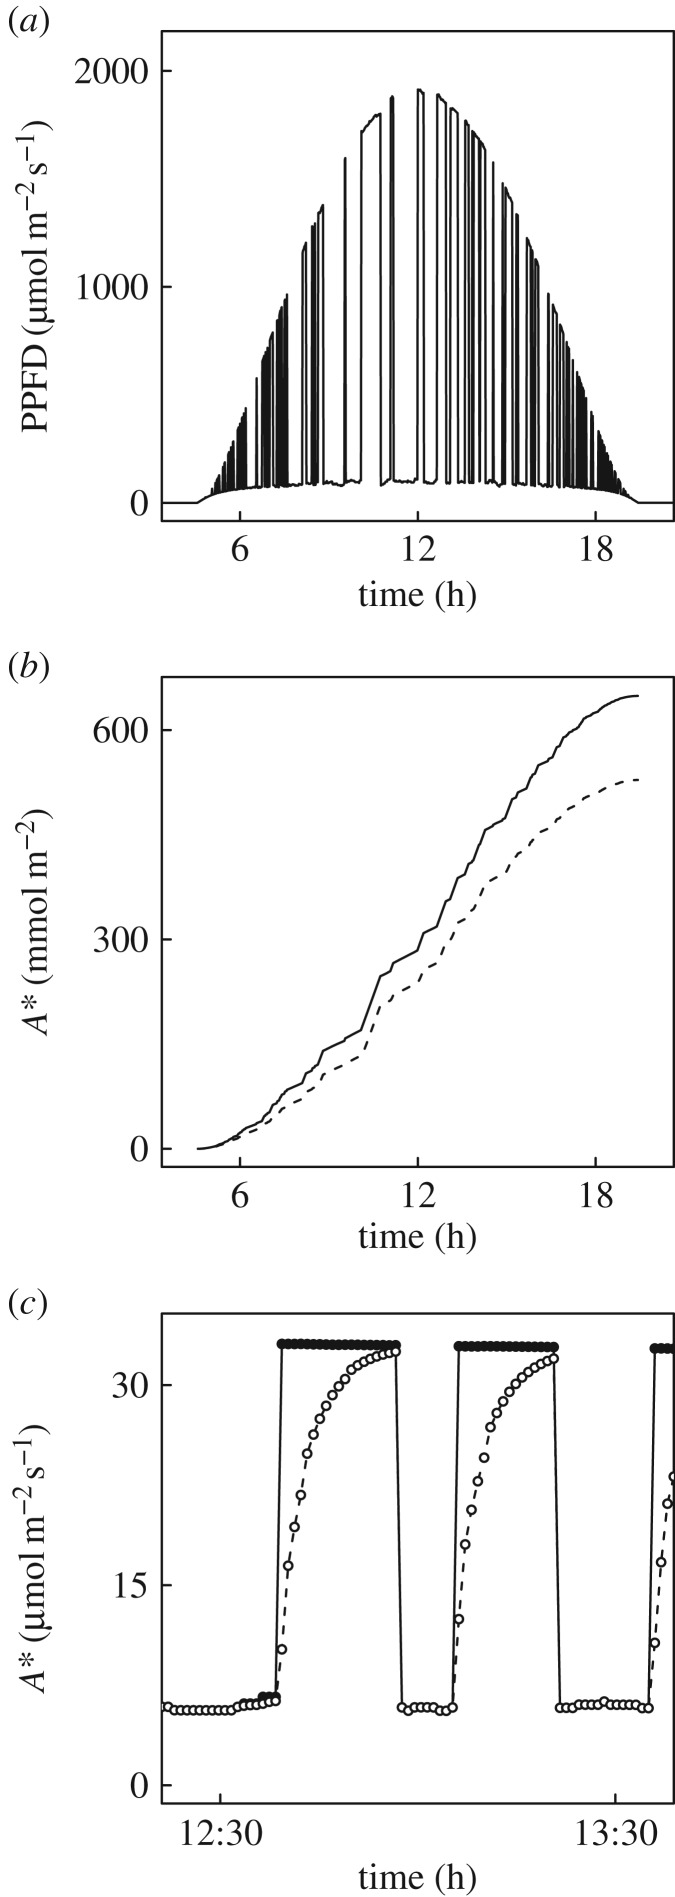
Wheat is the second most important direct source of food calories in the world. After considerable improvement during the Green Revolution, increase in genetic yield potential appears to have stalled. Improvement of photosynthetic efficiency now appears a major opportunity in addressing the sustainable yield increases needed to meet future food demand. Effort, however, has focused on increasing efficiency under steady-state conditions. In the field, the light environment at the level of individual leaves is constantly changing. The speed of adjustment of photosynthetic efficiency can have a profound effect on crop carbon gain and yield. Flag leaves of wheat are the major photosynthetic organs supplying the grain of wheat, and will be intermittently shaded throughout a typical day. Here, the speed of adjustment to a shade to sun transition in these leaves was analysed. On transfer to sun conditions, the leaf required about 15 min to regain maximum photosynthetic efficiency. In vivo analysis based on the responses of leaf CO2 assimilation (A) to intercellular CO2 concentration (ci) implied that the major limitation throughout this induction was activation of the primary carboxylase of C3 photosynthesis, ribulose-1,5-bisphosphate carboxylase/oxygenase (Rubisco). This was followed in importance by stomata, which accounted for about 20% of the limitation. Except during the first few seconds, photosynthetic electron transport and regeneration of the CO2 acceptor molecule, ribulose-1,5-bisphosphate (RubP), did not affect the speed of induction. The measured kinetics of Rubisco activation in the sun and de-activation in the shade were predicted from the measurements. These were combined with a canopy ray tracing model that predicted intermittent shading of flag leaves over the course of a June day. This indicated that the slow adjustment in shade to sun transitions could cost 21% of potential assimilation.This article is part of the themed issue 'Enhancing photosynthesis in crop plants: targets for improvement'.

Keywords: Rubisco; Rubisco activase; crop yield improvement; food security; photosynthetic induction; wheat.


Conflict of interest statement

We have no competing interests.

Figures

Figure 1.
Figure 1.
Responses of photosynthetic CO2 uptake (A) to PPFD in flag leaves of bread-wheat at heading-anthesis. (a) Static light-response: solid line indicates light response based on means of fitted parameters shown, symbol shading differentiates three plants used in the experiment. (b) Dynamics of photosynthetic induction following a transition from 50 to 1200 µmol m−2 s−1 PPFD (shade to sun): values are means ± s.e. based on three leaves from separate plants, shaded symbols and dashed lines indicate leaves maintained at 400 µmol mol−1 [CO2] during the preceding 30 min shade period, open symbols and solid lines indicate leaves maintained at 100 µmol mol−1 [CO2] during the preceding 30 min shade period.
Figure 2.
Figure 2.
Response of net leaf CO2 uptake (A) to intercellular CO2 concentrations (ci) in flag leaves of wheat at heading-anthesis. Fitted curves are shown for Rubisco-limited photosynthesis (solid lines) and RuBP-limited photosynthesis (dashed lines). Vertical dotted lines indicate the ci at which limitation of photosynthesis transitions from Rubisco to RuBP regeneration (ci,trans), and filled points the steady-state operating values. Parameter values were (mean ± s.e., N = 3): Vc,max = 113 ± 12.7 µmol m−2 s−1; Rd = 1.6 ± 0.31 µmol m−2 s−1; J = 214 ± 18.3 µmol m−2 s−1; Γ = 39.0 ± 1.00 µmol mol−1; ci,trans = 407 ± 27.4 µmol mol−1. Conditions during measurements for each leaf were as follows (mean, CV < 0.01): vapour pressure deficit, 0.99 kPa; photosynthetic photon flux density, 1200 µmol m−2 s−1; leaf temperature, 25°C.
Figure 3.
Figure 3.
Photosynthetic induction after transition from 50 to 1200 µmol m−2 s−1 PPFD, represented by dynamic A/ci analysis at: (a) 20 s; (b) 1 min; (c) 2.5 min; (d) 3 min; (e) 4.5 min; (f) 10 min.
Figure 4.
Figure 4.
Dynamics of photosynthetic limitations affecting wheat leaves over 10 min following a step change in PPFD from 50 to 1200 µmol m−2 s−1 (shade to sun). (a) Maximum rate of Rubisco carboxylation (Vc,max). (b) Rate of electron transport (J). (c) The ci at which the primary limitation imposed on photosynthesis switches between Vc,max and J (ci,trans). Values are means ± s.e. based on three leaves from separate plants (indicated by symbol shading). The dashed line in (c) places an upper limit on operating ci, assuming a chamber [CO2] (ca) of 400 µmol mol−1, and steady-state stomatal conductance of 0.7 mol m−2 s−1.
Figure 5.
Figure 5.
Stomatal effects following a step change in PPFD from 50 to 1200 µmol m−2 s−1, as affected by [CO2] pre-treatment. (a) Stomatal conductance to water vapour (gs,w). (b) Intercellular CO2 concentrations (ci). Values are means ± s.e. based on three leaves from separate plants. (c) Limitation imposed by stomata (l), relative to infinite conductance at [CO2] = 400 µmol mol−1. Shaded symbols and dashed lines are for 400 µmol mol−1 [CO2] during shade; open symbols and solid lines are for 100 µmol mol−1 [CO2] during shade.
Figure 6.
Figure 6.
(a) The simulated course of photon flux (PPFD) on a clear sky June day at latitude 44°N for a point on the flag leaf, assuming one layer of randomly distributed elements above the leaf [25]. (b) The cumulative gross assimilation of CO2 assuming that A* instantaneously adjusts to the steady-state value fit to the light response curve (figure 1a), i.e. no lag on a shade to sun transition (solid line); versus accounting for the lag imposed by Rubisco re-activation (dashed line). (c) As for (b) but showing instantaneous A* for the period around solar noon for the no-lag scenario (filled symbols) and the scenario modelled on measured Rubisco activation (open symbols).

References

    1. Kromdijk J, Glowacka K, Leonelli L, Gabilly ST, Iwai M, Niyogi KK, Long SP. 2016. Improving photosynthesis and crop productivity by accelerating recovery from photoprotection. Science 354, 857–861. (10.1126/science.aai8878) - DOI - PubMed
    1. Chazdon RL, Pearcy RW. 1986. Photosynthetic responses to light variation in rain-forest species. 1. Induction under constant and fluctuating light conditions. Oecologia 69, 517–523. (10.1007/bf00410357) - DOI - PubMed
    1. Hammond ET, Andrews TJ, Mott KA, Woodrow IE. 1998. Regulation of Rubisco activation in antisense plants of tobacco containing reduced levels of Rubisco activase. Plant J. 14, 101–110. (10.1046/j.1365-313X.1998.00103.x) - DOI - PubMed
    1. Soleh MA, Tanaka Y, Nomoto Y, Iwahashi Y, Nakashima K, Fukuda Y, Long SP, Shiraiwa T. 2016. Factors underlying genotypic differences in the induction of photosynthesis in soybean Glycine max (L.) Merr. Plant Cell Environ. 39, 685–693. (10.1111/pce.12674) - DOI - PubMed
    1. Yamori W, Masumoto C, Fukayama H, Makino A. 2012. Rubisco activase is a key regulator of non-steady-state photosynthesis at any leaf temperature and, to a lesser extent, of steady-state photosynthesis at high temperature. Plant J. 71, 871–880. (10.1111/j.1365-313X.2012.05041.x) - DOI - PubMed