. 2017 Nov;23(11):1660-1671.
doi: 10.1261/rna.062000.117. Epub 2017 Aug 14.

Rapid RNase L-driven arrest of protein synthesis in the dsRNA response without degradation of translation machinery

Affiliations

Rapid RNase L-driven arrest of protein synthesis in the dsRNA response without degradation of translation machinery

Jesse Donovan et al. RNA. 2017 Nov.

Abstract

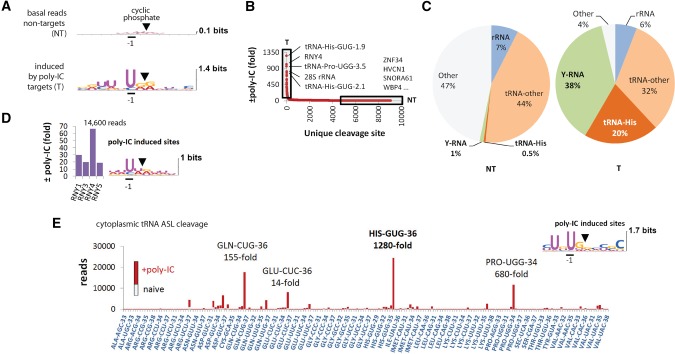
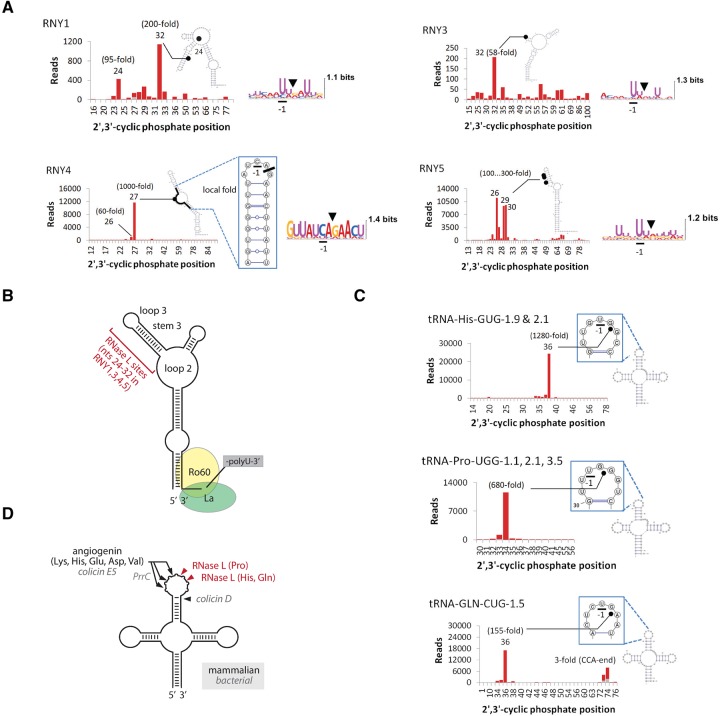
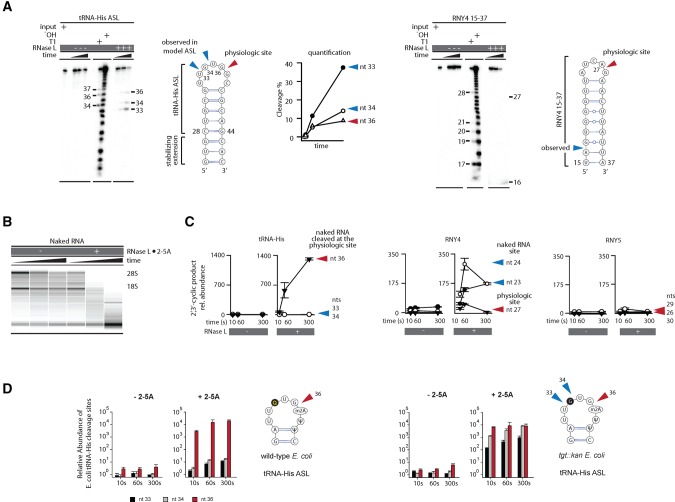
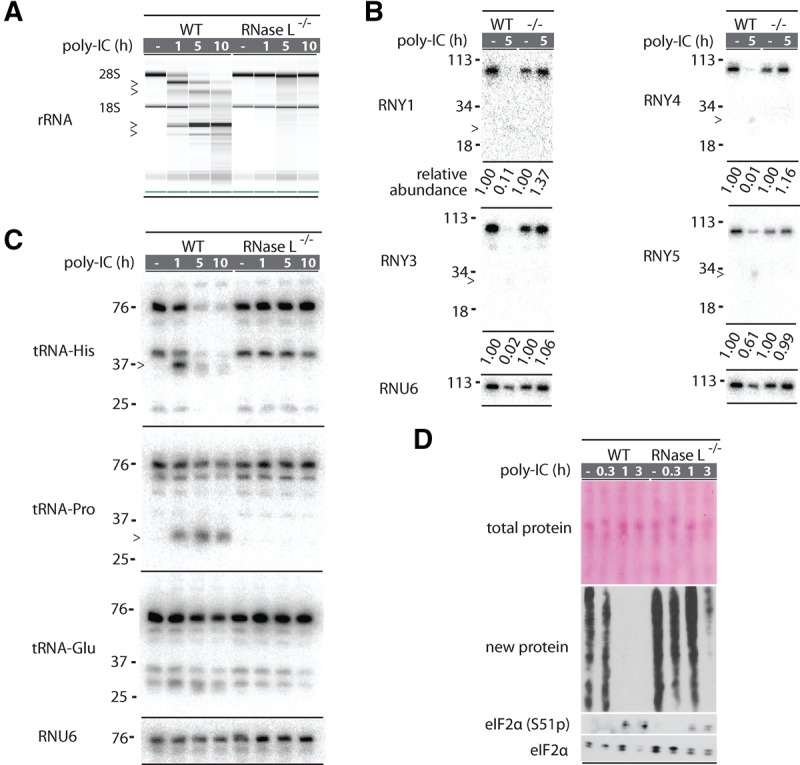
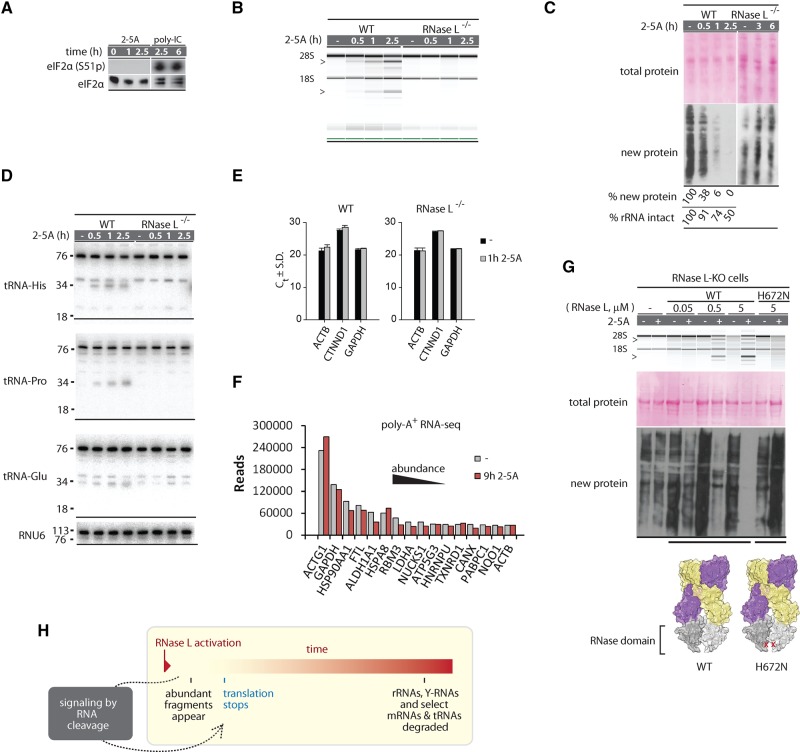
Mammalian cells respond to double-stranded RNA (dsRNA) by activating a translation-inhibiting endoribonuclease, RNase L. Consensus in the field indicates that RNase L arrests protein synthesis by degrading ribosomal RNAs (rRNAs) and messenger RNAs (mRNAs). However, here we provide evidence for a different and far more efficient mechanism. By sequencing abundant RNA fragments generated by RNase L in human cells, we identify site-specific cleavage of two groups of noncoding RNAs: Y-RNAs, whose function is poorly understood, and cytosolic tRNAs, which are essential for translation. Quantitative analysis of human RNA cleavage versus nascent protein synthesis in lung carcinoma cells shows that RNase L stops global translation when tRNAs, as well as rRNAs and mRNAs, are still intact. Therefore, RNase L does not have to degrade the translation machinery to stop protein synthesis. Our data point to a rapid mechanism that transforms a subtle RNA cleavage into a cell-wide translation arrest.

Keywords: RNase L; Y-RNA; signaling; tRNA; translation.


Figures

FIGURE 1.
FIGURE 1.
RtcB RNA-seq analysis of RNA cleavage in poly(IC)-stimulated HeLa cells. (A) Sequence consensus at cleavage sites with 2′,3′-cyclic phosphates before and after poly(IC) treatment. Nontargets (NT) and targets (T) are defined in B. (B) Cleavage site distribution according to fold-induction by poly(IC). Boxed regions mark RNase L-sensitive (T) and resistant (NT) RNAs. (C) Composition of the NT and T groups by main RNA types. The group “other” contains primarily U6 small nucleolar RNA as well as mRNAs, micro-RNAs, and small ncRNAs (Supplemental Dataset S1). (D) Up-regulation of reads for each Y-RNA by poly(IC). Y-RNAs are cleaved at UN^N consensus sites. (E) ASL cleavage sites in observed fragments of cytosolic tRNAs. The stacked bars show basal (gray) and poly(IC)-induced (red) reads for each site.
FIGURE 2.
FIGURE 2.
Single-nucleotide resolution profiles of tRNA and Y-RNA cleavage during poly(IC) response. (A) Secondary structure cleavage profiles for Y-RNAs. RNase L targets the upper region at UN^N sites. RNY4 is cleaved predominantly at a single unconventional site CA^G. Stacked bar charts for RNA fragments are colored as in Figure 1E. (B) Graphic model of Y-RNA cleavage by RNase L. The main cleavage sites in all Y-RNAs are located in the region between nucleotides 24 and 32, away from the conserved binding sites for Ro60 and La autoantigens. (C) Secondary structure cleavage profiles for RNase L-sensitive tRNAs. (D) Graphic model for tRNA cleavage by RNase L versus ANG and bacterial endoribonucleases.
FIGURE 3.
FIGURE 3.
Cleavage of naked human RNA points to distinct specificity determinants for Y-RNAs and tRNAs. (A) Cleavage of model stem–loops from tRNA-His and RNY4 analyzed by polyacrylamide gel electrophoresis (PAGE). Neither model substrate is cleaved preferentially at the physiologic site. (B) RNA chip analysis for cleavage of protein-free total RNA by RNase L. The nonspecific decay observed in this experiment contrasts the site-specific cleavage in cells (Supplemental Fig. S1B). (C) RtcB qPCR analysis to measure cleavage of tRNA-His and RNY4 at physiologic and nonphysiologic sites in naked RNA. Error bars show SE from two qPCR replicates. (D) Cleavage of tRNA-His purified from WT or mutant E.coli lacking a queuosine biosynthesis gene tgt was measured by RtcB qPCR. The queuosine position is shaded gray. Error bars show SE from two biological replicates.
FIGURE 4.
FIGURE 4.
Northern blot analysis of Y-RNA and tRNA cleavage during dsRNA response. (A) RNA chip analysis for cleavage of total RNA in A549 cells treated with poly(IC). Markers show fragments produced by RNase L. RNA is intact in RNase L−/− cells. (B) Northern blot analysis for each Y-RNA after 5 h of poly(IC) treatment. RNA fragments are less abundant than the starting Y-RNAs, but detectable, indicating that they survive for some time in the cells. Relative abundance is normalized to RNU6. (C) Northern blot analysis of tRNA cleavage during poly(IC) treatment. Cleavage of tRNA-His and tRNA-Pro are readily detected but only tRNA-His is depleted upon prolonged treatment. (D) Western blot analysis to detect inhibition of new protein synthesis during poly(IC) treatment. Poly(IC) does not change the abundance of preexisting total protein, but blocks translation of new proteins. RNase L is important for early and strong translation arrest. Western blot for eIF2α phosphorylation status reflects PKR activation.
FIGURE 5.
FIGURE 5.
RNA degradation versus translation control by RNase L. (A) Western blot for eIF2α phosphorylation shows absence of strong PKR activation during 2-5A treatment. (B) RNA chip analysis of cellular RNA cleavage during 2-5A treatment. (C) Western blot analysis to detect protein synthesis inhibition by 2-5A. Note that 2-5A does not change the abundance of preexisting proteins, but arrests new protein synthesis. Translation arrest requires RNase L. (D) Northern blot analysis for tRNA cleavage. The expected tRNA halves are observed for tRNA-His and tRNA-Pro, which are sensitive to RNase L. (E) Cellular levels of abundant mRNAs (ACTB1, GAPDH) and an RNase L-sensitive mRNA (CTNND1) (Rath et al. 2015) during 2-5A treatment analyzed by qPCR. Graph shows cycles to threshold (Ct) and SD for two qPCR replicates. (F) RNA-seq quantification of top most abundant mRNAs before and after 2-5A treatment. (G) Transfection of WT, but not the RNase-inactive H672N RNase L (3 h) induces 2-5A-dependent rRNA cleavage and translation block. (H) Proposed model for RNA and translation regulation by RNase L.

References

    1. Aulas A, Fay MM, Lyons SM, Achorn CA, Kedersha N, Anderson P, Ivanov P. 2017. Stress-specific differences in assembly and composition of stress granules and related foci. J Cell Sci 130: 927–937. - PMC - PubMed
    1. Banerjee S, Chakrabarti A, Jha BK, Weiss SR, Silverman RH. 2014. Cell-type-specific effects of RNase L on viral induction of beta interferon. mBio 5: e00856-14. - PMC - PubMed
    1. Banerjee S, Li G, Li Y, Gaughan C, Baskar D, Parker Y, Lindner DJ, Weiss SR, Silverman RH. 2015. RNase L is a negative regulator of cell migration. Oncotarget 6: 44360–44372. - PMC - PubMed
    1. Brandman O, Hegde RS. 2016. Ribosome-associated protein quality control. Nat Struct Mol Biol 23: 7–15. - PMC - PubMed
    1. Brennan-Laun SE, Ezelle HJ, Li XL, Hassel BA. 2014. RNase-L control of cellular mRNAs: roles in biologic functions and mechanisms of substrate targeting. J Interferon Cytokine Res 34: 275–288. - PMC - PubMed

Publication types