. 2017 Aug;29(8):1952-1969.
doi: 10.1105/tpc.16.00808. Epub 2017 Aug 14.

Mutations in eIF5B Confer Thermosensitive and Pleiotropic Phenotypes via Translation Defects in Arabidopsis thaliana

Affiliations

Mutations in eIF5B Confer Thermosensitive and Pleiotropic Phenotypes via Translation Defects in Arabidopsis thaliana

Liyuan Zhang et al. Plant Cell. 2017 Aug.

Abstract

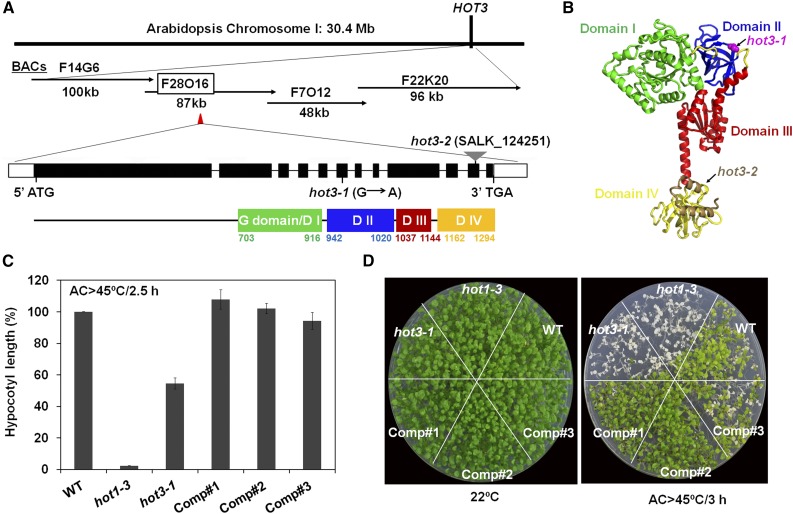
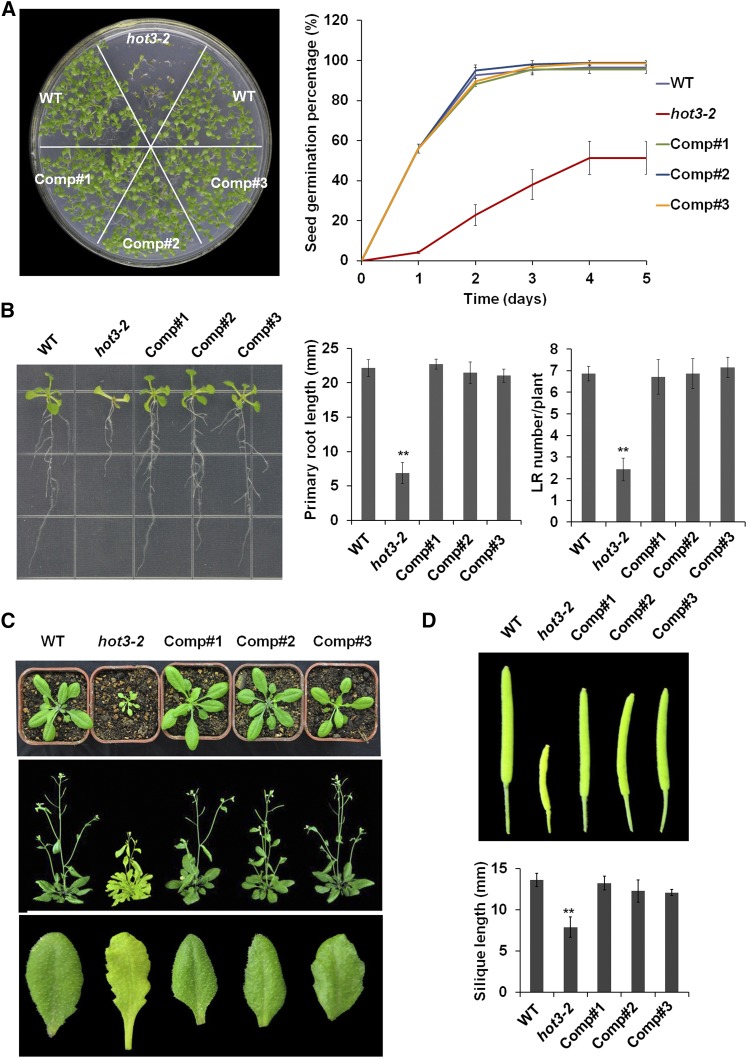
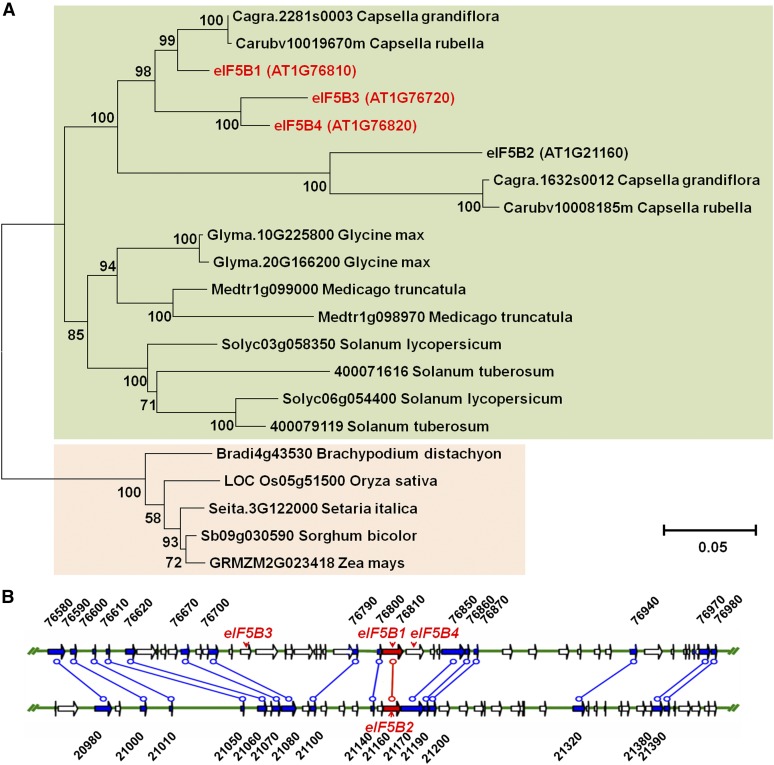
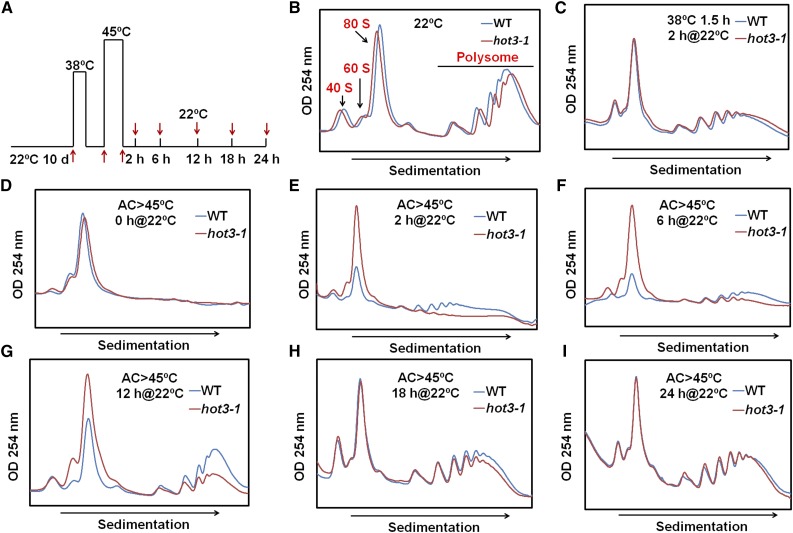
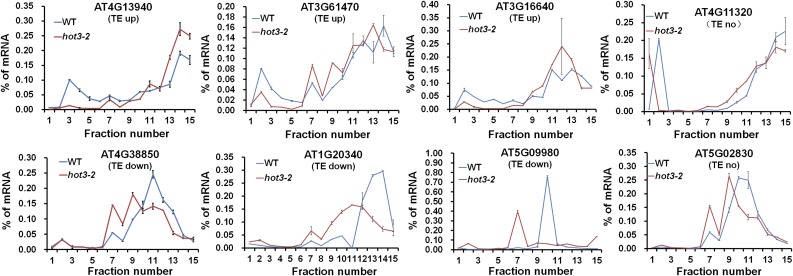
The conserved eukaryotic translation initiation factor 5B, eIF5B, is a GTPase that acts late in translation initiation. We found that an Arabidopsis thaliana mutant sensitive to hot temperatures 3 (hot3-1), which behaves as the wild type in the absence of stress but is unable to acclimate to high temperature, carries a missense mutation in the eIF5B1 gene (At1g76810), producing a temperature sensitive protein. A more severe, T-DNA insertion allele (hot3-2) causes pleiotropic developmental phenotypes. Surprisingly, Arabidopsis has three other eIF5B genes that do not substitute for eIF5B1; two of these appear to be in the process of pseudogenization. Polysome profiling and RNA-seq analysis of hot3-1 plants show delayed recovery of polysomes after heat stress and reduced translational efficiency (TE) of a subset of stress protective proteins, demonstrating the critical role of translational control early in heat acclimation. Plants carrying the severe hot3-2 allele show decreased TE of auxin-regulated, ribosome-related, and electron transport genes, even under optimal growth conditions. The hot3-2 data suggest that disrupting specific eIF5B interactions on the ribosome can, directly or indirectly, differentially affect translation. Thus, modulating eIF5B interactions could be another mechanism of gene-specific translational control.


Figures

Figure 1.
Figure 1.
Identification and Characterization of HOT3. (A) Diagram of the region identified by map-based cloning of HOT3. A G-to-A mutation changes Gly-952 to Ser in eIF5B (At1g76810; eIF5B1) in the hot3-1 mutant. Position of a T-DNA insertion in SALK_124251 (hot3-2) is also shown. Four conserved domains are found in the C-terminal half of eIF5B1 as analyzed at http://pfam.xfam.org/: EF-Tu GTP binding domain/G domain/Domain I, green; EF-Tu domain/Domain II, blue; IF-2 domain/Domain III, red; and Domain IV, orange. (B) Structural model of the conserved domains of eIF5B1 based on eIF5B from the thermophilic yeast Chaetomium thermophilum (PDB: 4N3N) (the N-terminal ∼700 amino acids of HOT3 are not modeled as they are part of a disordered region not present in any crystal structure). Position of the hot3-1 mutation is shown in magenta as a space-filled residue. Conserved domains are colored as in (A), Domain IV is in yellow, with the exception of the final two helices (brown), which are deleted in hot3-2. (C) Hypocotyl elongation after heat stress for the wild type, hot3-1, and three complemented lines (Comp#1, #2, #3) shows that eIF5B1 restores heat acclimation ability to hot3-1 seedlings. A T-DNA protein null allele of HSP101 (hot1-3) was used as a control for heat sensitivity. Hypocotyl elongation 2.5 d after heat treatment (AC >45°C /2.5 h: acclimation at 38°C for 1.5 h and 22°C for 2 h, followed by 45°C for 2.5 h) was measured and expressed as a percentage of growth during the same time period for seedlings that had not been heat treated. Error bars indicate se; n = 12. (D) Complementation of hot3-1 with eIF5B1 rescues the heat sensitivity of 6-d-old light-grown hot3-1 seedlings. Seedlings were maintained at 22°C or subjected to heat stress: acclimation at 38°C for 1.5 h and 22°C for 2 h, followed by 45°C for 3 h (AC >45°C/3 h). Plates were photographed 5 d later.
Figure 2.
Figure 2.
Phenotypes of the hot3-2 Mutant and Three Complemented Lines. (A) Growth of hot3-2 seedlings compared with the wild type after 7 d (left). Seed germination assay in the wild type, hot3-2, and three complemented lines (right). Imbibed seeds were transferred to MS medium, and seed germination was recorded at the indicated time points. Each time point represents the means ± se of three replicates with >100 seeds per replicate. (B) Phenotype of 10-d-old seedlings growing on vertically placed agar plates. Primary root length and the number of lateral roots were measured. Data are means ± se of three replicates (n = 15), **P < 0.01, compared with wild-type plants (two-tail Student t test). (C) Morphology of the wild type, hot3-2, and three complemented lines. Two-week-old (top) and 6-week-old (middle) plants growing in soil and the shape of rosette leaves (bottom). (D) Full-grown siliques. From left to right: the wild type, hot3-2, and three complemented lines (Comp #1, #2, #3). Silique length was measured and data are means ± se (n = 15), **P < 0.01, compared with wild-type plants (two-tail Student’s t test).
Figure 3.
Figure 3.
Phenotypes of T-DNA Insertion Lines of Multiple eIF5B Homologs. (A) Growth and development of 4-week-old mutants under normal conditions. hot3-1, hot3-2, eif5b2 (SALK_148816), eif5b3 (SALK_143304), and eif5b4 (SALK_056578) are shown. (B) The 2.5-d-old dark-gown seedlings were treated by heat stress (A>45°C/1 h: acclimation at 38°C for 1.5 h and 22°C for 2 h, followed by 45°C for 1 h). Hypocotyl elongation was measured before (blue bars) and 2.5 d after (red bars) heat treatment. Data are means ± se (n = 12). (C) Six-day-old seedlings were subjected to heat stress (AC>45°C/3 h: acclimation at 38°C for 1.5 h and 22°C for 2 h, followed by 45°C for 3 h) and photographed 5 d later.
Figure 4.
Figure 4.
Phylogenetic Tree of eIF5B Genes from Various Species and the Chromosomal Positions of the Four eIF5B Homologs in Arabidopsis. (A) The full-length amino acid sequences were aligned and the tree was generated using the neighbor-joining method in MEGA6. Bootstrap values (as a percentage of 1000 replicates) are provided at the branches. The scale bar represents two amino acid replacements per 100 positions. (B) Data from the Plant Genome Duplication Database (http://chibba.agtec.uga.edu/duplication/) indicate that the four eIF5B genes in Arabidopsis are contained in a large duplicated block on chromosome 1. The four eIF5B genes are in red font.
Figure 5.
Figure 5.
Expression Patterns of Four eIF5B Genes from Arabidopsis. (A) In silico analysis of the expression of four eIF5B genes. Data were obtained and organized from public microarray data (http://jsp.weigelworld.org/expviz/expviz.jsp) of transcript levels of the four eIF5B genes under heat stress. The black bar underneath the x axis indicates heat treatment period at 38°C, while the gray bar indicates the recovery period at 25°C following a 3-h heat treatment. (B) Relative expression levels of eIF5B genes under heat stress. RNA from 5-d-old seedlings treated at 38°C in the dark for the indicated times was used for qRT-PCR. The relative levels of eIF5B mRNA were normalized with eIF5B1 set as 1.0. Actin 2 (At3g18780) was used as the internal standard. Data are means ± se from three technical replicates. (C) Analysis of eIF5Bpro::GUS expression. Different tissue-specific expression patterns of the four eIF5B genes were observed. Bars = 1 mm.
Figure 6.
Figure 6.
Time Course of Recovery of Polysome Accumulation after Heat Stress in 10-d-Old Seedlings of the Wild Type and hot3-1. (A) Temperature treatment protocol. Materials for polysome profiles were obtained at the times indicated (AC>45°C: acclimation at 38°C for 1.5 h and 22°C for 2 h, followed by 45°C for 2 h). (B) to (I) Polysome profiles were analyzed by sucrose gradient sedimentation, and OD254 (arbitrary units) was measured for the wild type (blue) and hot3-1 (red) at the times indicated. Samples represent equal amounts of RNA for the wild type and hot3-1 at each time point analyzed. The experiment was repeated more than three times with comparable results.
Figure 7.
Figure 7.
Identity of Genes with Altered TE in hot3-1 and after AC or during Recovery from 45°C HS. (A) Volcano plots of TE changes generated from Xtail. Log2 of TE-fold change is shown on the horizontal axis, and –log10 of the adjusted P value is shown on the vertical axis. Red and blue dots represent significantly up- and downregulated genes (FDR < 0.01). Green dots are genes with a nonsignificant TE change. Total gene number used for the analysis is shown in parentheses. (B) Hierarchical clustering analysis of the log2-transformed TE-fold change values. Each column represents the TE variation between the two samples indicated. Red and green indicate a relative increase or decrease of TE in the comparison. Black indicates that there is no significant difference in TE. The log2-transformed TE-fold changes are color coded according to the scale shown and plotted using the R heatmap.2 function from the R “gplots” library. The 3986 genes that changed TE in one comparison at least were used. (C) GO functional categories of genes with translationally up- and downregulated levels for the indicated comparisons. The color in each cell indicates –log10 (P values) of the GO enrichment according to the scale shown, and blank cells indicate not significant. U, upregulation; D, downregulation.
Figure 8.
Figure 8.
Identification of Genes with Altered TE in the hot3-2 Mutant. (A) Polysome profiles of 10-d-old seedlings from the wild type and hot3-2. Positions of the 40S, 60S, 80S ribosomes, and polysomes are indicated. SP, small polysomes; LP, large polysomes. The experiment was repeated three times with similar results. (B) Volcano plots for the differences in TE between the wild type and hot3-1 as generated by Xtail. Log2 of TE-fold change is shown on the horizontal axis, and –log10 of the adjusted P value is shown on the vertical axis. Red and blue dots represent significantly up- and downregulated genes in hot3-2 compared with the wild type (FDR < 0.01). Green dots represent genes with no significant change in TE. Total gene number used for analysis is shown in parentheses. (C) Biological process GO category of genes with translationally up- (U) and downregulated (D) levels in hot3-2 compared with the wild type. Other details as in Figure 7.
Figure 9.
Figure 9.
Distribution of Specific mRNAs in Polysome Gradients. The relative mRNA levels of three TE upregulated genes (AT4G13940, AT3G61470, and AT3G16640), three TE downregulated genes (AT4G38850, AT1g20340, and AT5G09980), and two genes (AT4G11320 and AT5G02830) whose TE appeared not to change were determined by RT-qPCR performed from the top (fraction 1) to the bottom (fraction 15) of the gradient. Expression values were normalized based on the addition of equal luciferase RNA to each fraction prior to RNA extraction, wild type (blue) and hot3-2 (red). Standard deviations were calculated from technical repeats.

Comment in

Similar articles

Cited by

References

    1. Acker M.G., Shin B.S., Dever T.E., Lorsch J.R. (2006). Interaction between eukaryotic initiation factors 1A and 5B is required for efficient ribosomal subunit joining. J. Biol. Chem. 281: 8469–8475. - PubMed
    1. Branco-Price C., Kawaguchi R., Ferreira R.B., Bailey-Serres J. (2005). Genome-wide analysis of transcript abundance and translation in Arabidopsis seedlings subjected to oxygen deprivation. Ann. Bot. (Lond.) 96: 647–660. - PMC - PubMed
    1. Browning K.S., Bailey-Serres J. (2015). Mechanism of cytoplasmic mRNA translation. Arabidopsis Book 13: e0176. - PMC - PubMed
    1. Carrera P., Johnstone O., Nakamura A., Casanova J., Jäckle H., Lasko P. (2000). VASA mediates translation through interaction with a Drosophila yIF2 homolog. Mol. Cell 5: 181–187. - PubMed
    1. Choi S.K., Lee J.H., Zoll W.L., Merrick W.C., Dever T.E. (1998). Promotion of met-tRNAiMet binding to ribosomes by yIF2, a bacterial IF2 homolog in yeast. Science 280: 1757–1760. - PubMed

MeSH terms