

FELIX: an algorithm for indexing multiple crystallites in X-ray free-electron laser snapshot diffraction images
- PMID: 28808433
- PMCID: PMC5541352
- DOI: 10.1107/S1600576717007506
FELIX: an algorithm for indexing multiple crystallites in X-ray free-electron laser snapshot diffraction images
Abstract
A novel algorithm for indexing multiple crystals in snapshot X-ray diffraction images, especially suited for serial crystallography data, is presented. The algorithm, FELIX, utilizes a generalized parametrization of the Rodrigues-Frank space, in which all crystal systems can be represented without singularities. The new algorithm is shown to be capable of indexing more than ten crystals per image in simulations of cubic, tetragonal and monoclinic crystal diffraction patterns. It is also used to index an experimental serial crystallography dataset from lysozyme microcrystals. The increased number of indexed crystals is shown to result in a better signal-to-noise ratio, and fewer images are needed to achieve the same data quality as when indexing one crystal per image. The relative orientations between the multiple crystals indexed in an image show a slight tendency of the lysozme microcrystals to adhere on ([Formula: see text]10) facets.
Keywords: SFX; materials science; serial crystallography; structural biology.
Figures
 , is parallel to h
 g, while that requiring the maximum rotation,
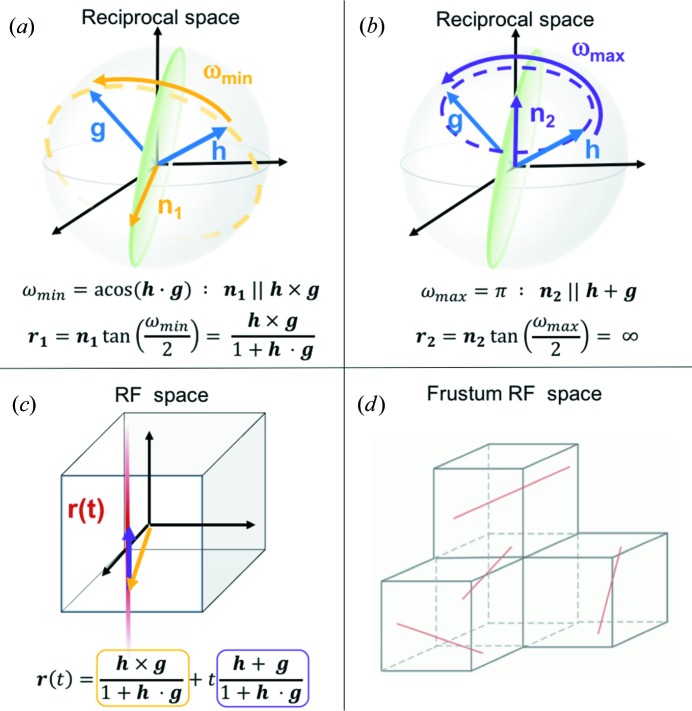
  , is parallel to h + g. All possible rotation axes must satisfy h
 n = g
n and thus lie on the green circular plane that bisects the two vectors. (c) The full set of such rotations can be expressed as a linear combination of the two limiting cases, as given by the equation for r(t). From equation (1), these limiting cases map to vectors in RF space, and the expression for the geodesic, r(t), is an infinite straight line. (d) To avoid searching an infinite space, FELIX maps RF space into four frustums, shown as the four cubes in the image. All of the surfaces of the frustums are mathematically connected, so that a geodesic passing through one surface continues on in the neighboring frustum. The red lines shown in each frustum are then actually a single geodesic that is unbroken when the surface connectivity is applied.
n = g
n and thus lie on the green circular plane that bisects the two vectors. (c) The full set of such rotations can be expressed as a linear combination of the two limiting cases, as given by the equation for r(t). From equation (1), these limiting cases map to vectors in RF space, and the expression for the geodesic, r(t), is an infinite straight line. (d) To avoid searching an infinite space, FELIX maps RF space into four frustums, shown as the four cubes in the image. All of the surfaces of the frustums are mathematically connected, so that a geodesic passing through one surface continues on in the neighboring frustum. The red lines shown in each frustum are then actually a single geodesic that is unbroken when the surface connectivity is applied.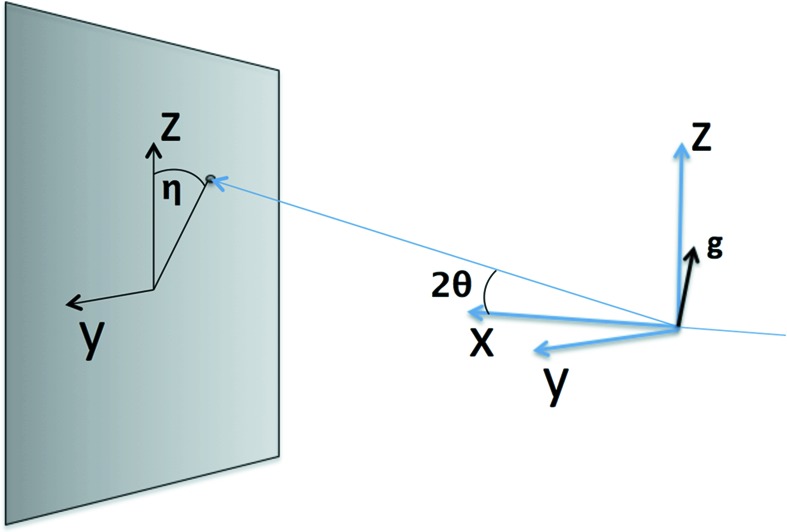
 and η onto the detector, represented as a grey plane in the illustration. The corresponding g vector is shown at the origin.
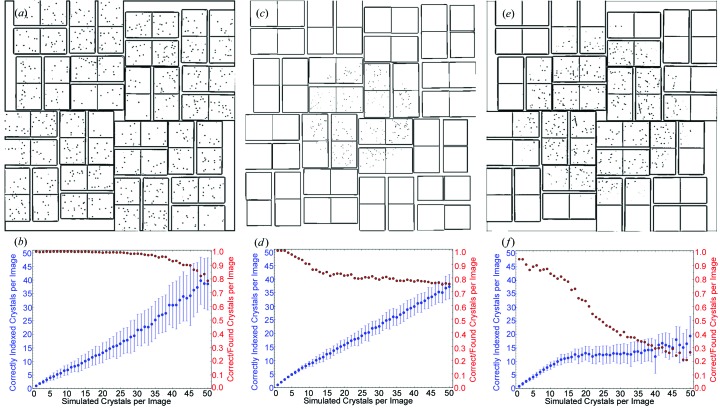
 R, respectively. The spots in the images have been enlarged for the purposes of illustration. (b), (d), (f) Respective trends of the average number of correctly indexed crystals and fraction of correctly found crystals as the number of crystals in the simulated image is increased for the three aforementioned crystal systems. The error bars on the number of correctly indexed crystals depict the standard deviation of this quantity over a set of 100 independent simulations.
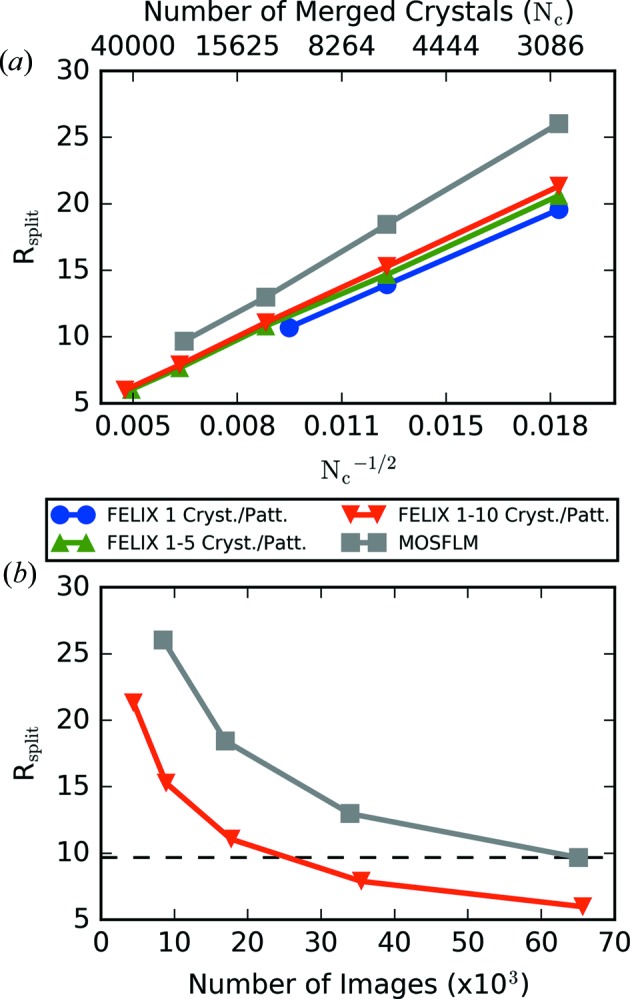
 value calculated by merging different subsets of images indexed by FELIX is shown as a function of the number of merged crystals and compared with that obtained from MOSFLM. (b) The trends of in terms of the number of analyzed images are shown for the final merged FELIX and MOSFLM datasets.
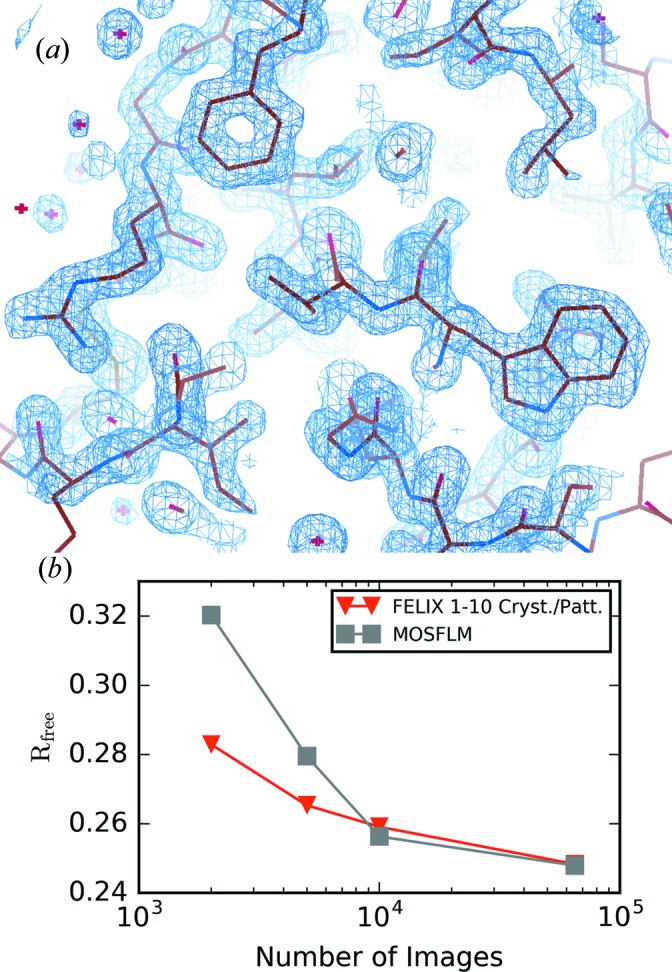
 value from FELIX and MOSFLM datasets is shown in terms of the number of analyzed images on a log scale.
References
-
- Adams, P. D. et al. (2010). Acta Cryst. D66, 213–221.
-
- Agarwal, R. C. (1978). Acta Cryst. A34, 791–809.
-
- Boutet, S. (2013). CXIDB – ID 17, http://www.cxidb.org/id-17.html.
LinkOut - more resources
Full Text Sources
Other Literature Sources