. 2017 Oct 6;16(10):3536-3546.
doi: 10.1021/acs.jproteome.7b00246. Epub 2017 Aug 30.

Glucose Limitation Alters Glutamine Metabolism in MUC1-Overexpressing Pancreatic Cancer Cells

Affiliations

Glucose Limitation Alters Glutamine Metabolism in MUC1-Overexpressing Pancreatic Cancer Cells

Teklab Gebregiworgis et al. J Proteome Res. .

Abstract

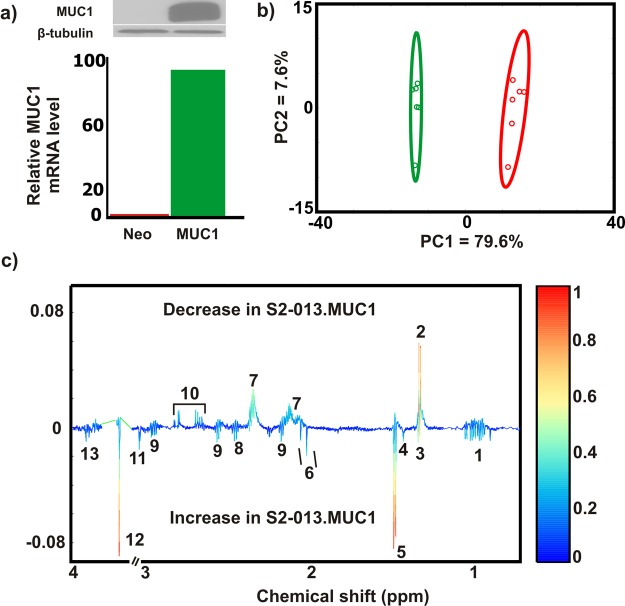
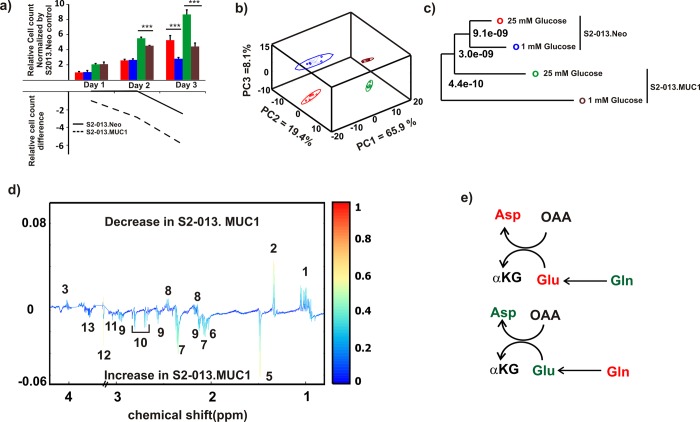
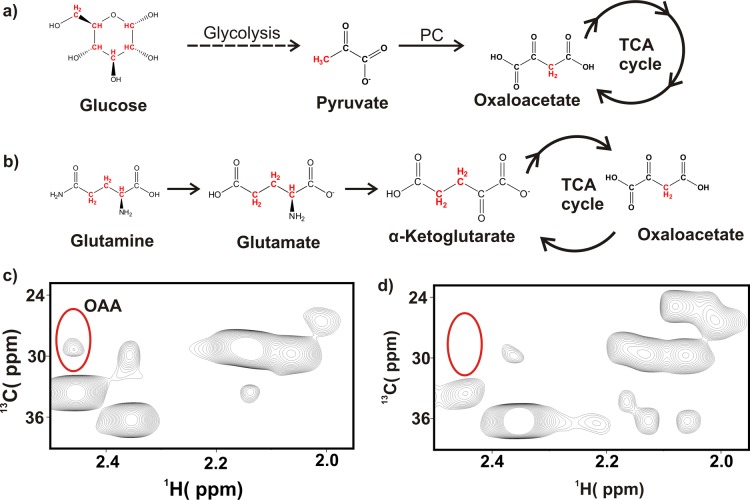
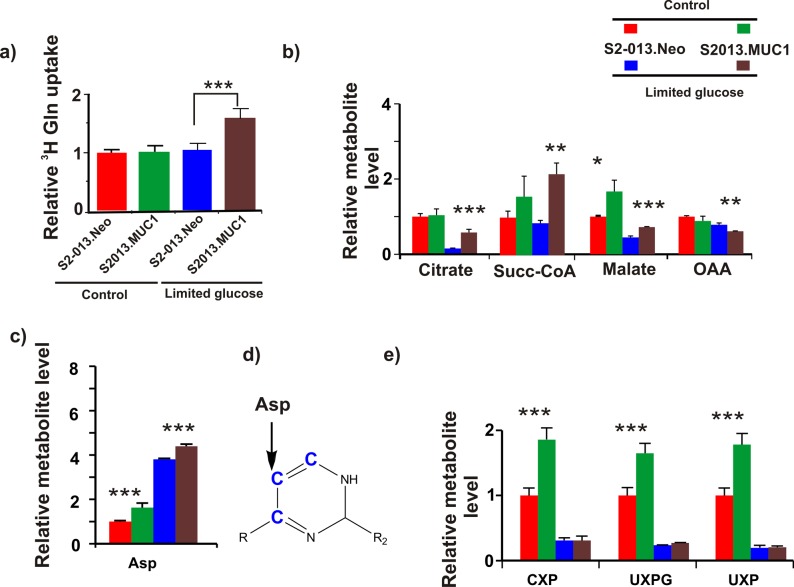
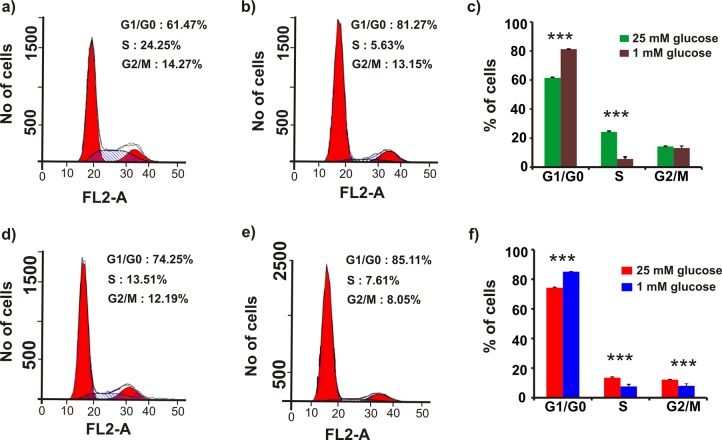
Pancreatic cancer cells overexpressing Mucin 1 (MUC1) rely on aerobic glycolysis and, correspondingly, are dependent on glucose for survival. Our NMR metabolomics comparative analysis of control (S2-013.Neo) and MUC1-overexpressing (S2-013.MUC1) cells demonstrates that MUC1 reprograms glutamine metabolism upon glucose limitation. The observed alteration in glutamine metabolism under glucose limitation was accompanied by a relative decrease in the proliferation of MUC1-overexpressing cells compared with steady-state conditions. Moreover, glucose limitation induces G1 phase arrest where S2-013.MUC1 cells fail to enter S phase and synthesize DNA because of a significant disruption in pyrimidine nucleotide biosynthesis. Our metabolomics analysis indicates that glutamine is the major source of oxaloacetate in S2-013.Neo and S2-013.MUC1 cells, where oxaloacetate is converted to aspartate, an important metabolite for pyrimidine nucleotide biosynthesis. However, glucose limitation impedes the flow of glutamine carbons into the pyrimidine nucleotide rings and instead leads to a significant accumulation of glutamine-derived aspartate in S2-013.MUC1 cells.

Keywords: MUC1 overexpression; NMR metabolomics; cancer metabolism; glucose limitation; glutamine metabolism.


Conflict of interest statement

The authors declare no competing financial interest.

Figures

Figure 1
Figure 1
MUC1 alters global amino acid metabolism. (a) Confirmation of MUC1 overexpression in S2−013.Neo and S2−013.MUC1 cells using Western blot (upper panel) and mRNA expression (lower panel). Please see Figure S1 for the full, original Western blot images. (b) PCA scores plot for lysates extracted from S2–013.Neo (red) and S2–013.MUC1 (green) cells. The ellipses correspond to 95% confidence intervals for a normal distribution. (c) Back-scaled loadings plot produced from the OPLS-DA scores generated from 1D 1H NMR spectra of S2–013.Neo and S2–013.MUC1 cells. Please see Figure S2 for the corresponding OPLS-DA scores plots. A valid OPLS-DA model is indicted by R2 of 0.99, Q2 of 0.87, and CV-ANOVA p-value of 3.92 × 10⁻⁴. The metabolites are labeled accordingly (1: Branched chain amino acids, 2: Lactate, 3: Threonine, 4: Unknown, 5: Alanine, 6: N-Acetylaspartate/N-Acetyleglutamate, 7: Glutamate, 8: Glutamine, 9: Glutathione, 10: Aspartate, 11: Creatine/CreatineP, 12: Glycine, 13: Serine).
Figure 2
Figure 2
Glucose limitation reprograms amino acid metabolism in MUC1 cells. (a) Bar graph representing normalized cell count for 3 days (upper panel). S2–013.Neo and S2–013.MUC1 cells cultured in a medium supplemented with 25 or 1 mM glucose. The cells under each condition were counted daily for 3 days. The cell count was normalized by the first day count for S2–013.Neo cells cultured at 25 mM glucose. The lower panel line graph indicates the difference in the relative cell count between 1 and 25 mM glucose supplemented media for each cell line. The data were obtained by subtracting the relative cell count values of 25 mM from 1 mM glucose cultured cells for each cell line. The solid graph (−) and broken (--) graphs represent the relative difference in S2–013.Neo and S2–013.MUC1 cells, respectively. (b) 3D PCA scores plot generated form 1D 1H NMR spectra of cell lysate collected after S2–013.Neo and S2–013.MUC1 cells were cultured in media supplemented with 25 or 1 mM of glucose. The clusters are colored accordingly: S2−013.Neo cultured in 25 mM glucose (red) S2−013.Neo cultured in 1 mM glucose (blue), S2−013.MUC1 cultured in 25 mM glucose (green), and S2−013.MUC1 cultured in 1 mM glucose (brown). The ellipses correspond to 95% confidence intervals for a normal distribution. Each cluster contains six biological replicates. (c) Tree diagram generated from the PCA scores of panel b, each node is labeled with a p-value calculated from Mahalanobis distances and indicate the statistical significance of cluster separations. The coloring scheme is the same as panel b. (d) Back-scaled loadings plot generated from the OPLS-DA scores plot of S2–013.Neo and S2–013.MUC1 cells cultured in media supplemented with 1 mM glucose. A valid OPLS-DA model is indicted by R2 of 0.99, Q2 of 0.84, and CV-ANOVA p-value of 4.48 × 10⁻⁴. See also Figure S2. The metabolites are labeled accordingly (1: Branched chain amino acids, 2: Lactate, 3: Threonine, 4: Unknown, 5: Alanine, 6: N-Acetylaspartate/N-Acetyleglutamate, 7: Glutamate, 8: Glutamine, 9: Glutathione, 10: Aspartate, 11: Creatine/CreatineP, 12: Glycine, 13: Serine). (e) Metabolite concentrations switch in S2–013.MUC1 cells compared to the S2−013.Neo cells cultured at 25 mM glucose (upper panel) or 1 mM glucose (lower panel). The green and red colors indicate a relative increase or decrease in concentrations, respectively.
Figure 3
Figure 3
13C3 oxaloacetate originates from 13C-labeled glutamine. (a) Synthetic scheme illustrating the 13C3-labeling of OAA from U–13C6 glucose. Glucose-derived pyruvate is made by the glycolytic pathway and is converted to OAA by pyruvate carboxylase (PC). (b) Synthetic scheme illustrating the 13C3-labeling of OAA from U–13C5 glutamine. The CH pairs detected by the 2D 1H–13C HSQC NMR experiment are colored red. (c) Expanded view of 2D 1H–13C HSQC spectrum of S2–013.MUC1 cells cultured for 12 h in medium containing 2 mM U–13C5 glutamine and 25 mM 12C6 glucose. The OAA 1H–13C3 NMR peaks are circled. (d) Same view as panel c of 2D 1H–13C HSQC spectrum of S2–013.MUC1 cells cultured for 12 h in medium containing 25 mM U–13C6 glucose and 2 mM 12C5 glutamine. The predicted location of the OAA C3 peak is indicated in the spectrum. Please see Figure S5 for representative 2D 1H–13C HSQC spectra obtained from other cell culture conditions.
Figure 4
Figure 4
MUC1 alters glutamine uptake and glutamine metabolism. (a) Plot of relative uptake of 3H glutamine by S2–013.Neo or S2–013.MUC1 cells cultured in media supplemented with 25 or 1 mM of glucose. 3H glutamine uptake was normalized to S2−013.Neo cells cultured in media supplemented with 25 mM glucose. (b) Relative concentrations of TCA cycle intermediates derived from 2D 1H–13C HSQC experiments of S2–013.Neo or S2–013.MUC1 cells cultured in media supplemented with U–13C5 glutamine and either 25 or 1 mM of glucose. (c) Relative concentrations of aspartate-derived 2D 1H–13C HSQC experiments of S2–013.Neo or S2–013.MUC1 cells cultured in media supplemented with U–13C5 glutamine and either 25 or 1 mM of glucose. (d) Pyrimidine nucleotide carbons (blue) derived from aspartate during de novo pyrimidine synthesis. Please see Figure S4 for a scheme illustrating the incorporation of aspartate-derived carbon atoms into a pyrimidine nucleotide. (e) Relative concentrations of pyrimidine nucleotides derived from 2D 1H–13C HSQC experiments of S2–013.Neo or S2–013.MUC1 cells cultured in media supplemented with U–13C5 glutamine and either 25 or 1 mM of glucose. The acronyms CXP, UXPG, and UXP correspond to cytidine X phosphate, uridine X phosphate glucose, and uridine X phosphate, respectively. The X indicates that pyrimidine nucleotides could be mono-, di-, or tri-phosphate. The relative concentration of each metabolite was normalized to S2–013.Neo cells cultured with 25 mM glucose.
Figure 5
Figure 5
Glucose limitation induces G1/G0-phase arrest and decreases the S-phase fraction of MUC1-overexpressed cells. Representative flow cytometry pattern obtained by cell-cycle analysis of S2–013.MUC1 cells (a–c) and S2–013.Neo (d–f) cultured at 25 mM glucose containing media (a,d) or 1 mM glucose supplemented media (b,e) for 48 h. The histogram from triplicate experiments shows the percentage of cells in each phase (c: S2–013.MUC1, f: S2–013.Neo). FL2-A corresponds to the area of the DNA florescence signal from the FL2 channel.

References

    1. Cairns R. A.; Harris I. S.; Mak T. W. Regulation of cancer cell metabolism. Nat. Rev. Cancer 2011, 11 (2), 85–95. 10.1038/nrc2981. - DOI - PubMed
    1. Koppenol W. H.; Bounds P. L.; Dang C. V. Otto Warburg’s contributions to current concepts of cancer metabolism. Nat. Rev. Cancer 2011, 11 (5), 325–37. 10.1038/nrc3038. - DOI - PubMed
    1. Boroughs L. K.; DeBerardinis R. J. Metabolic pathways promoting cancer cell survival and growth. Nat. Cell Biol. 2015, 17 (4), 351–9. 10.1038/ncb3124. - DOI - PMC - PubMed
    1. Singh P. K.; Hollingsworth M. A. Cell surface-associated mucins in signal transduction. Trends Cell Biol. 2006, 16 (9), 467–76. 10.1016/j.tcb.2006.07.006. - DOI - PubMed
    1. Singh P. K.; Behrens M. E.; Eggers J. P.; Cerny R. L.; Bailey J. M.; Shanmugam K.; Gendler S. J.; Bennett E. P.; Hollingsworth M. A. Phosphorylation of MUC1 by Met modulates interaction with p53 and MMP1 expression. J. Biol. Chem. 2008, 283 (40), 26985–26995. 10.1074/jbc.M805036200. - DOI - PMC - PubMed

Publication types