Review
. 2013 Feb 5;6(2):483-499.
doi: 10.3390/ma6020483.

Quantum Dots as Multifunctional Materials for Tumor Imaging and Therapy

Affiliations
Review

Quantum Dots as Multifunctional Materials for Tumor Imaging and Therapy

Longfei Liu et al. Materials (Basel). .

Abstract

The rapidly developing field of quantum dots (QDs) provides researchers with more options for imaging modalities and therapeutic strategies. In recent years, QDs were widely used as multifunctional materials for tumor imaging and therapy due to their characteristic properties such as semiconductive, zero-dimension and strong fluorescence. Nevertheless, there still exist the challenges of employing these properties of QDs for clinical diagnosis and therapy. Herein, we briefly review the development, properties and applications of QDs in tumor imaging and therapy. Future perspectives in these areas are also proposed as well.

Keywords: fluorescence; probe; quantum dots; semiconductor; tumor imaging and therapy.


Figures

Figure 1
Figure 1
(a) Absorption and emission of six different quantum dot (QD) dispersions. The black line shows the absorption of the 510 nm emitting QDs. Note that at the wavelength of lowest absorption for the 510 nm QD, ~450 nm, the molar extinction coefficient is greater than that of rhodamine red at its absorption maxima (~150,000 vs. 129,000 M−1 cm−1); (b) Photo demonstrating the size-tunable fluorescence properties and spectral range of the six QD dispersions plotted in A vs. CdSe core size. All samples were excited at 365 nm with a UV source. For the 610 nm emitting QDs, this translates into a Stokes shift of ~250 nm. r = radius. Reprinted with permission from [5]. Copyright 2005 Nature Publishing Group.
Figure 2
Figure 2
Imaging technologies used in oncology. Many macroscopic imaging technologies (shown above the timeline) are in routine clinical use, and there have been huge advances in their capabilities to obtain anatomical and physiological information since the beginning of the twentieth century. Shown are some examples of bones (X-rays), soft tissue (ultrasound, MRI and CT rows), three-dimensional organs (CT and MRI rows) and physiological imaging (MRI and PET rows). Microscopic and other intravital optical techniques (shown below the timeline) have developed over the past decade and now allow studies of genetic, molecular and cellular events in vivo. Shown are surface-weighted, whole-mouse, two-dimensional techniques (macroscopic reflectance row); tomographic three-dimensional techniques, often in combination with other anatomical modalities (tomography row); and intravital microscopy techniques (microscopy row). The timeline is approximate and is not to scale. Here BLI, bioluminescence imaging; CT, computed tomography; DOT, diffuse optical tomography; FMT, fluorescence-mediated tomography; FPT, fluorescence protein tomography; FRI, fluorescence reflectance imaging; HR-FRI, high-resolution FRI; LN-MRI, lymphotropic nanoparticle-enhanced MRI; MPM, multiphoton microscopy; MRI, magnetic resonance imaging; MSCT, multislice CT; OCT, optical coherence tomography; OFDI, optical frequency-domain imaging; PET, positron-emission tomography. Reprinted with permission from [9]. Copyright 2008 Nature Publishing Group.
Figure 3
Figure 3
Confocal microscopy imaging of cells treated with QD-aptamer conjugates. (a) A single incubation of QD605-TTA1, QD655-AS1411, or QD705-MUC-1 was applied to PC-3, HeLa, CHO, C6, and NPA cells, and confocal images were obtained. Each image was compared with the corresponding QD-control aptamers (column 1: QD-TTA1, column 2: QD-TTA1 control, column 3: QD-AS1411, column 4: QD-AS1411 control, column 5: QD-MUC-1, column 6: QDMUC- 1control); (b) Multiplex imaging of cancer cells treated simultaneously with three different types of QD-conjugated aptamers. Single images for QD-TTA1 (605 nm, light green, column 1), QD-AS1411 (655 nm, red, column 2), and QD-MUC-1(705 nm, violet, column3), dual images for QD-AS1411 and QD-TTA1 (column 4, yellow for co-localization), QD-TTA1 and QD-MUC-1 (column 5, light green for co-localization), and QD-AS1411 and QD-MUC-1 (column 6, violet for co-localization), and a triple image for QD-AS1411, QD-TTA1, and QD-MUC-1 (column 7, white for co-localization) were acquired from PC-3, HeLa, CHO, C6, and NPA cells. All figures are merged with the 40, 6-diamidino-2-phenylindole (DAPI) image (nucleus staining, 460 nm) and cellular morphology. Reprinted with permission from [29]. Copyright 2009 John Wiley and Sons.
Figure 4
Figure 4
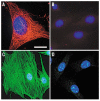
Staining of cytoskeleton fibers in 3T3 mouse fibroblast cells with QD-streptavidin. (A) Microtubules were labeled with monoclonal anti-α-tubulin antibody, biotinylated anti-mouse IgG and QD 630-streptavidin (red); (B) Control for (A) without primary antibody; (C) Actin filaments were stained with biotinylated phalloidin and QD 535-streptavidin (green); (D) Control for (C) without biotin-phalloidin. The nuclei were counterstained with Hoechst 33342 blue dye. Filter sets ex. 480 ± 20 nm/em. 535 ± 10 nm and ex. 560 ± 27.5 nm/em. 635 ± 10 nm were used to observe signals of QD 535 and QD 630, respectively. Scale bar, 10 μm for (A), 24 μm for (B) through (D). Reprinted with permission from [25]. Copyright 2003 Nature Publishing Group.
Figure 5
Figure 5
Fluorescence images of breast cancer tissues labeled with CdSe/ZnS QDs. PCNA was stained red with QDs modified with the antibody. The original QD-SA concentration was about 1 μmol/L and was diluted 200–3200× before staining operations. Reprinted with permission from [40]. Copyright 2010 Society for Applied Spectroscopy.
Figure 6
Figure 6
Direct visualization of binding of RGD-QDs to tumor vessel endothelium and controls. (a) Panel displays different output channels of the identical imaging plane along the row with scale bars. In the green channel, individual EGFP-expressing cancer cells are visible (marked by thick horizontal blue arrows; vertical blue arrow points to a hair follicle), while the red channel outlines the tumor’s vasculature via injection of Angiosense dye. The NIR channel shows intravascularly administered QDs, which remain in the vessels (i.e., they do not extravasate). Binding events are visible by reference to bright white signal. These are demarcated by arrows in the rightmost merged image, in which all three channels have been overlaid; (b) Displays the same as (a) in a different mouse, except that six times the RGD-QDs dose has been injected. Individual cells are not generally visible. Six binding events are observed in this FOV, as marked by arrows in the merged image at right. White arrows in the bottom merged image designate areas of tissue autofluorescence. Typical images of no binding in each control condition are shown in (cf). Tumor neovasculature containing unconjugated QDs (c), normal vasculature containing RGD-QDs (d), and tumor neovasculature containing RAD-QDs (e). (f) Tumor vasculature shortly after Cy5.5 injection (left) and ~20 min post-Cy5.5 injection (right). Individual cancer cells are visible before (left) and after dye extravasates (right, dyed red). Also see movie S6 in Supporting Information. Horizontal white arrows indicate tissue autofluorescence, vertical blue arrows denote hair follicles (which generally display autofluorescence in their center), and thick horizontal blue arrows indicate individual cancer cells. Reprinted with permission from [41]. Copyright 2008 American Chemical Society.
Figure 7
Figure 7
(a) Measurement of PDT sensitivity of KB cells treated with FA-conjugated QD 4. Cells were exposed to QDs in a concentration range of 10–100 nM for 1 (light gray), 3 (dark grey) and 6 h (black); (b) Survival curves obtained for cells incubated with QDs at 5 nM for 3 h incubation before irradiation to increasing doses of light from 1 to 20 J cm−2. Measurement of PDT sensitivity for the QDs were obtained by MTT test (data points show the mean ± s.d., n = 6). * P < 0.05 vs. previous fluence dose. Reprinted with permission from [45]. Copyright 2011 Royal Society of Chemistry.
Figure 8
Figure 8
Schematic presentation of the nanoparticle-based X-ray-induced PDT. Under ionizing radiation a nanoparticle starts to scintillate transferring its energy into a conjugated porphyrin molecule, which then generates singlet oxygen necessary to produce photosensitizing effect. This methodology will help to treat nodular and deeper tumors due to higher penetrating capacity of X-rays and gamma rays compared to that of visible light commonly used in PDT. Reprinted with permission from [43]. Copyright 2008 Elsevier.
Figure 9
Figure 9
Schematics of the 1O2 generation in QD-based PDT systems. Reprinted with permission from [46]. Copyright 2003 American Chemical Society.
Figure 10
Figure 10
Confocal laser scanning microscopy images of PSMA expressing LNCaP cells after incubation with 100 nM QD-Apt-(Dox) conjugates for 0.5 h at 37 °C, washed two times with PBS buffer, and further incubated at 37 °C for (a) 0 h and (b) 1.5 h. Dox and QD are shown in red and green, respectively, and the lower right images of each panel represents the overlay of Dox and QD fluorescent. The scale bar is 20 μm. Reprinted with permission from [47]. Copyright 2007 American Chemical Society.
Figure 11
Figure 11
Growth inhibition assay (MTT). Prostate cancer cell lines, LNCaP (PSMA+) and PC3 (PSMA−), were incubated with QD alone (1.6 μM), Dox along (5 μM), or QD-Apt(Dox) conjugates (1.6 μM), for 3 h, and the cells were washed and further incubated for 24 h prior to measurement of cell viability. Asterisk indicates significant differences between LNCaP and PC3 cells, (P < 0.005, n = 3). Reprinted with permission from [47]. Copyright 2007 American Chemical Society.

Similar articles

Cited by

References

    1. Hanson R., Kouwenhoven L.P., Petta J.R., Tarucha S., Vandersypen L.M.K. Spins in few-electron quantum dots. Rev. Mod. Phys. 2007;79:1217–1265. doi: 10.1103/RevModPhys.79.1217. - DOI
    1. Hardman R. A toxicologic review of quantum dots: Toxicity depends on physicochemical and environmental factors. Environ. Health Perspect. 2006;114:165–172. doi: 10.1289/ehp.8284. - DOI - PMC - PubMed
    1. Michalet X., Pinaud F.F., Bentolila L.A., Tsay J.M., Doose S., Li J.J., Sundaresan G., Wu A.M., Gambhir S.S., Weiss S. Quantum dots for live cells, in vivo imaging, and diagnostics. Science. 2005;307:538–544. doi: 10.1126/science.1104274. - DOI - PMC - PubMed
    1. Samir T.M., Mansour M.M.H., Kazmierczak S.C., Azzazy H.M.E. Quantum dots: Heralding a brighter future for clinical diagnostics. Nanomedicine. 2012;7:1755–1769. doi: 10.2217/nnm.12.147. - DOI - PubMed
    1. Medintz I.L., Uyeda H.T., Goldman E.R., Mattoussi H. Quantum dot bioconjugates for imaging, labelling and sensing. Nat. Mater. 2005;4:435–446. doi: 10.1038/nmat1390. - DOI - PubMed

LinkOut - more resources