. 2017 Aug 14;32(2):169-184.e7.
doi: 10.1016/j.ccell.2017.07.005.

Genomic Evolution of Breast Cancer Metastasis and Relapse

Affiliations

Genomic Evolution of Breast Cancer Metastasis and Relapse

Lucy R Yates et al. Cancer Cell. .

Abstract

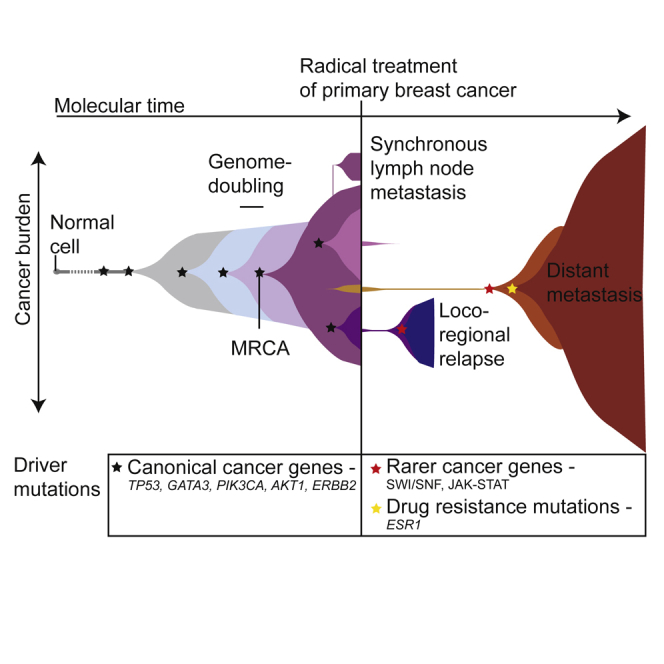
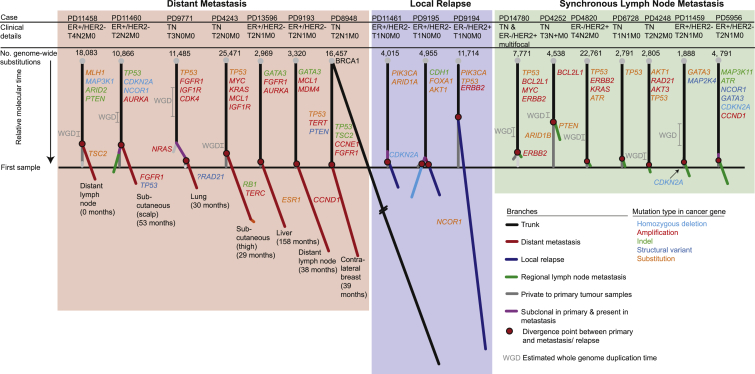
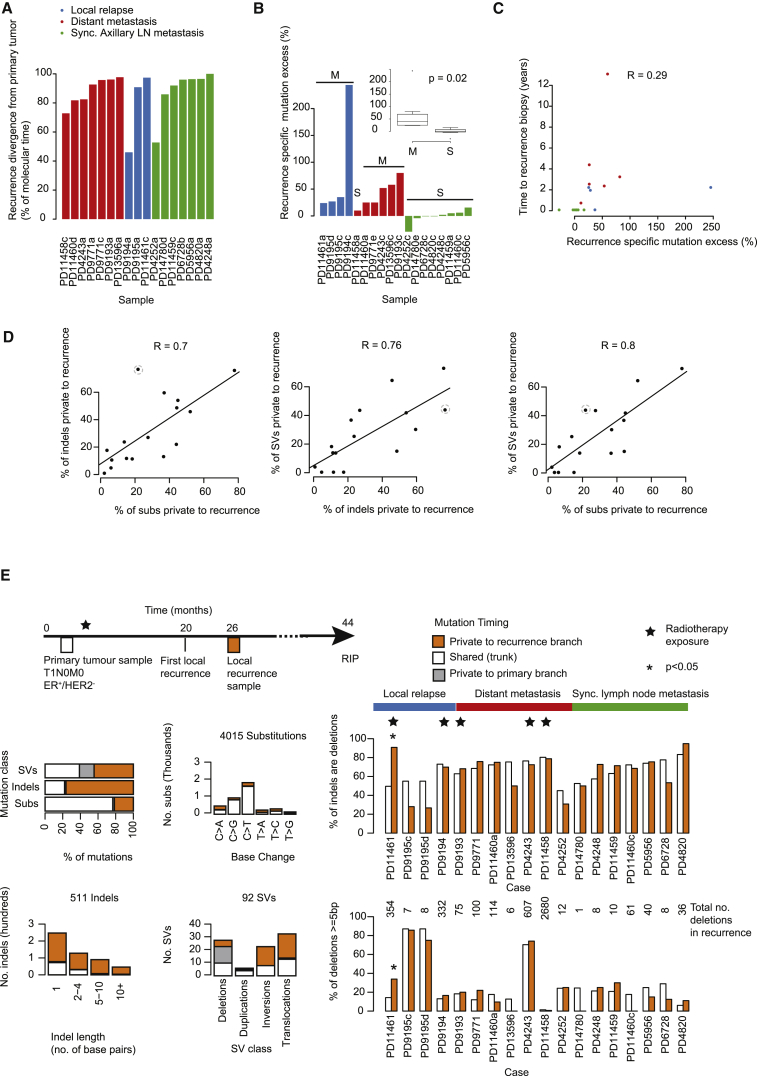
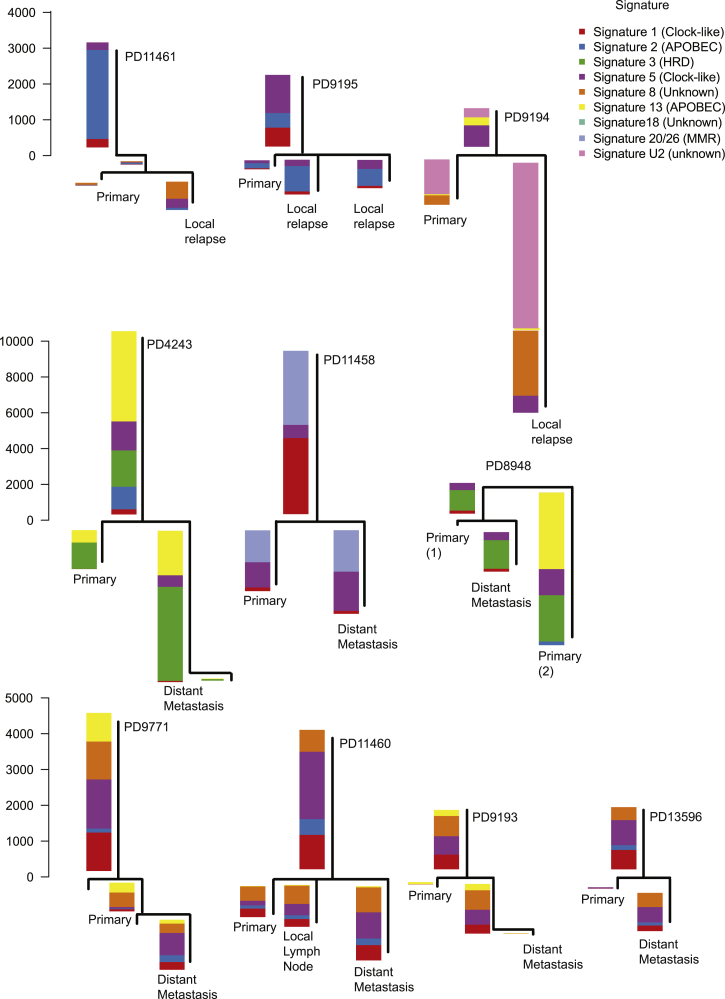
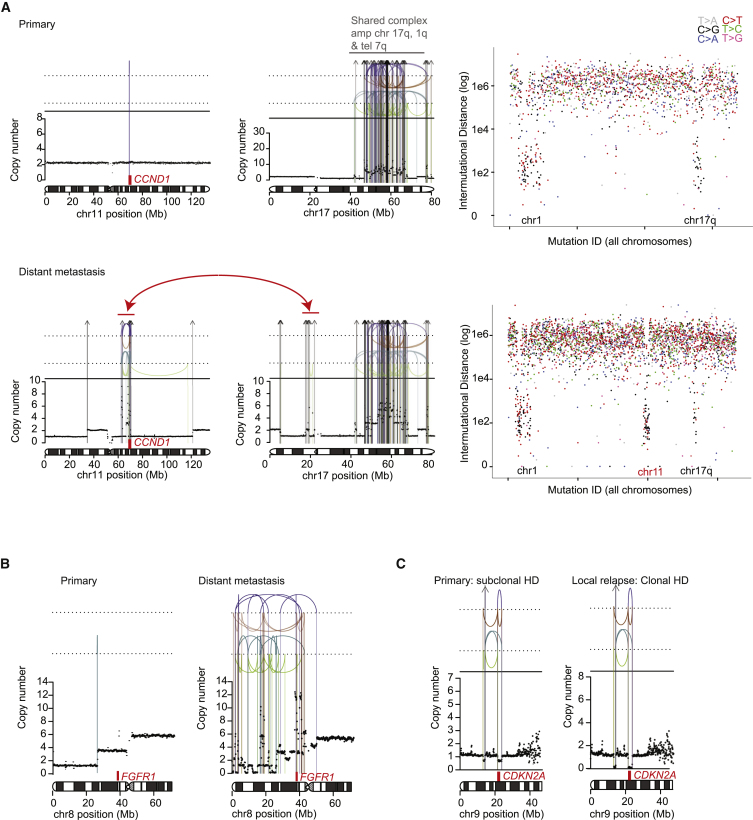
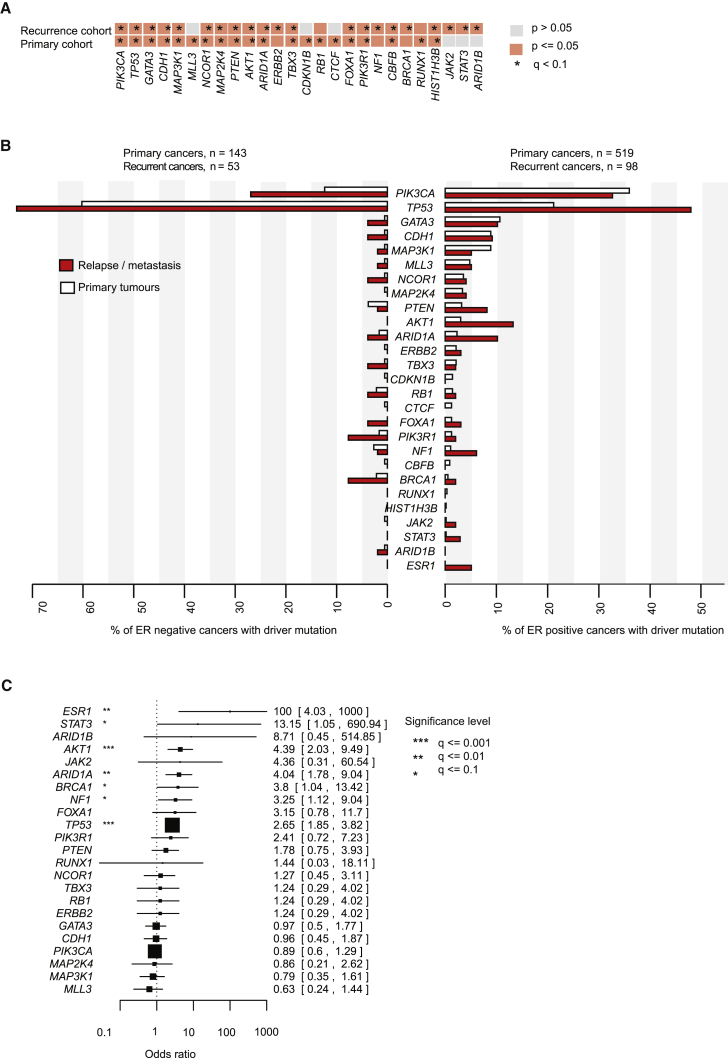
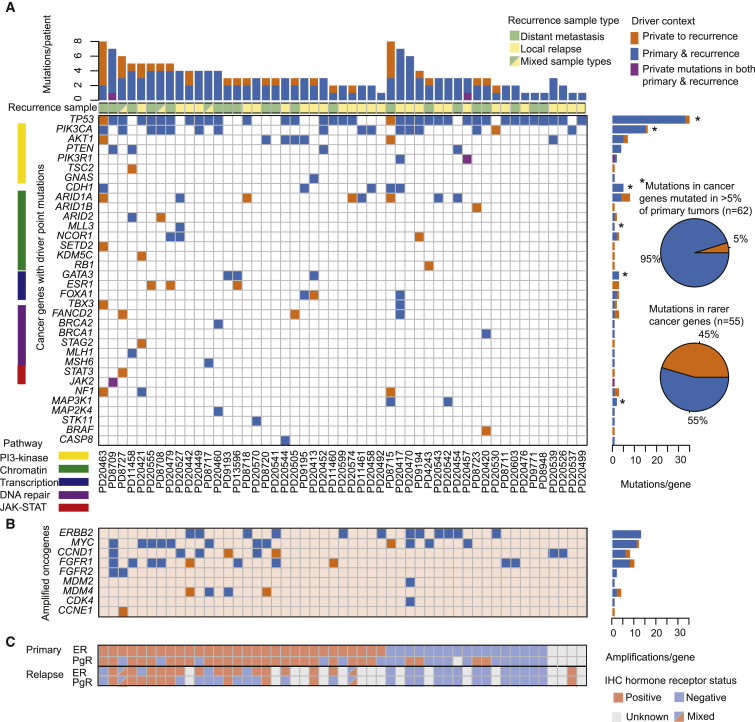
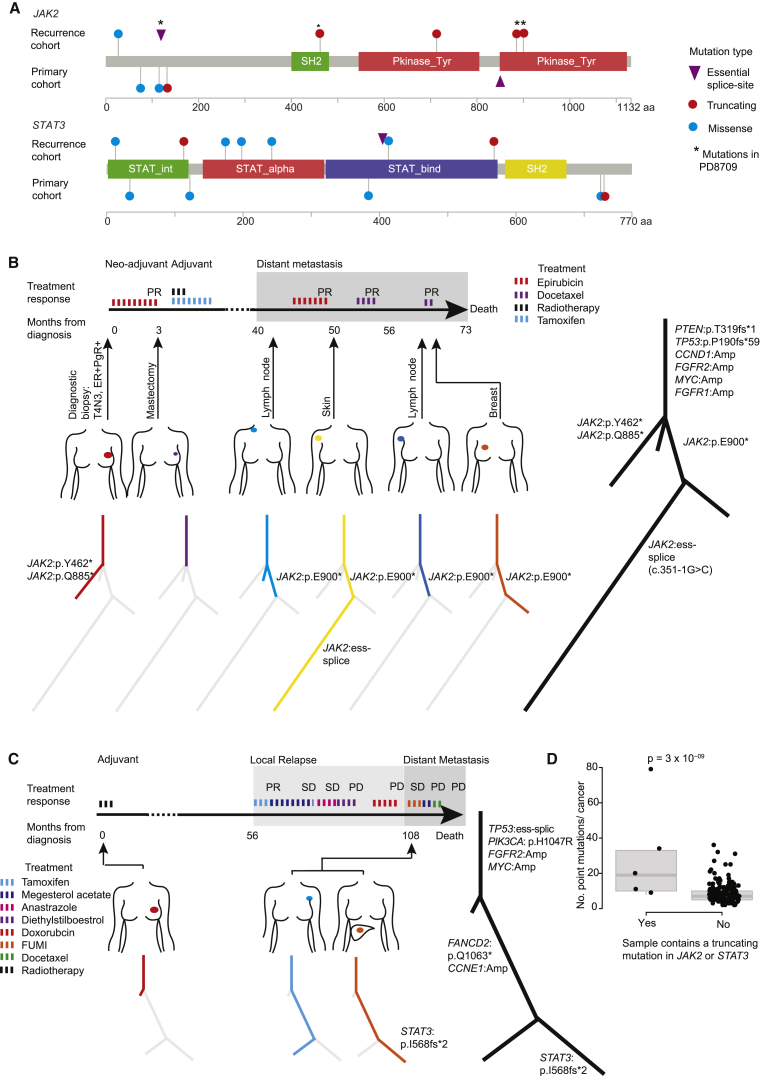
Patterns of genomic evolution between primary and metastatic breast cancer have not been studied in large numbers, despite patients with metastatic breast cancer having dismal survival. We sequenced whole genomes or a panel of 365 genes on 299 samples from 170 patients with locally relapsed or metastatic breast cancer. Several lines of analysis indicate that clones seeding metastasis or relapse disseminate late from primary tumors, but continue to acquire mutations, mostly accessing the same mutational processes active in the primary tumor. Most distant metastases acquired driver mutations not seen in the primary tumor, drawing from a wider repertoire of cancer genes than early drivers. These include a number of clinically actionable alterations and mutations inactivating SWI-SNF and JAK2-STAT3 pathways.

Keywords: breast cancer; genomics; metastasis; relapse; somatic mutation.


Figures

None
Graphical abstract
Figure 1
Figure 1
Phylogenetic Trees Describe Evolution of 17 Primary Breast Cancers to Metastasis or Local Relapse Each tree represents an individual patient's breast cancer inferred from the analysis of a matched normal sample and 2–4 tumor samples per case (total of 40 tumor samples). Trees are derived from genome-wide substitutions. Trees are grouped according to scenario: distant metastasis (red panel), locoregional relapse (blue panel), or synchronous axillary lymph node metastasis (green panel). Branches private to the metastasis or relapse follow the same color theme, while branches representing clones that are specific to the primary tumor are gray. The black trunk represents clonal mutations that are present in 100% of cells in every sample. Purple branches represent mutations within the metastasis or relapse that are subclonal within the primary tumor. Branch lengths reflect the proportion of clustered somatic mutations attributed to that subclone. The whole tree is scaled to the maximum length of a tree that would be inferred from mutations identified in the primary tumor. Red circles identify the point of divergence between the metastasis/relapse-seeding clone and the primary tumor. The estimated whole-genome doubling (WGD) time is indicated by 95% confidence intervals. Numbers in brackets reflect the months elapsed between primary tumor and metastasis sample acquisition. See also Figures S1 and S2 and Tables S1, S2, S3, S4, and S5.
Figure 2
Figure 2
Genome-wide Somatic Mutation Timing in 16 Breast Cancers (A) For each of 17 primary tumor samples, the bar height reflects the point in molecular time that the recurrence seeding clone is estimated to diverge from the primary tumor (relates to phylogenetic trees in Figure 1). Molecular time is determined from the number of base substitutions. (B) The recurrence-specific mutation excess is reported in a barplot for each of 18 recurrence samples and in a boxplot split by synchronous (S) and metachronous (M) cases, where the box represents the interquartile range (IQR) bisected by the median, whiskers represent the maximum and minimum range of the data that do not exceed 1.5× the IQR while outlier data points extend beyond this. The recurrence-specific mutation excess indicates the base substitution load in branches private to the recurrence minus those in branches private to the primary tumor, presented as a percentage of all substitutions identified in the primary tumor. The p value is generated by an F test. (C) The recurrence-specific mutation excess as presented in (B) according to the time from primary tumor diagnosis and acquisition of the relapse sample, each dot represents a patient. R = Pearson's correlation coefficient. (D) Scatterplots compare the proportion of each the major mutation types, indels (insertions and deletion), substitutions (Subs), and structural variants (SVs), localized to the recurrence. Unlike (A) and (B), these figures include variants in regions that were variable in copy number across samples. (E) Radiation mutation signature at relapse following external beam radiation. The mutation spectrum of an outlier sample (PD11461) highlighted by a dashed gray circle in (D) is shown in detail. The overall contribution of indels and structural variants (SVs) outweighs that of substitutions at relapse (top left barplot). Within this sample, indels of greater lengths (bottom left barplot) and inversions and translocations (bottom, middle bar plot) are relatively more common after relapse. Cohort-wide, the relative contribution of deletions as opposed to insertions (top right barplot) and of deletions of 5 base pairs (bp) or longer (bottom right barplot) are reported.p < 0.0001 (Fisher's exact test) for enrichment in the relapse sample. Cases exposed to prior external beam radiotherapy are indicated by a star symbol indicating that other samples do not seem to carry the same signature. See also Figure S3.
Figure 3
Figure 3
Genome-wide Mutation Signatures in Ten Metastatic or Locally Relapsed Breast Cancers Annotated to Phylogenetic Trees The mutational signature composition of each phylogenetic tree branch is reported for the ten multi-sample, whole-genome cases with a local relapse or distant metastatic sample. HRD, homologous recombination deficiency; MMR, mismatch-repair deficiency. See also Figure S4.
Figure 4
Figure 4
Structural Variant Driver Mutations at Relapse in Three Breast Cancers (A) Case PD9193: De novo amplification of CCND1 in a distant lymph node metastasis. Structural variant breakpoints are represented by colored vertical lines: interchromosomal translocations (gray arrows), tail-to-tail inversions (green), head-to-head inversions (blue), tandem duplications (orange), deletions (purple). Rainfall plots report the inter-mutational distance of individual consecutive mutations where each dot reflects a mutation and the color represents the base change. (B) Case PD11460: de novo amplification of FGFR1 in a metastatic deposit. (C) Case PD11461: a subclone containing a homozygous deletion in CDKN2A in the primary tumor seeds a local relapse.
Figure 5
Figure 5
Comparison of the Driver Landscapes of 163 Recurrent and 705 Primary Breast Cancers (A) Cancer genes identified as significantly mutated with a false discovery rate (q) < 0.1, applied to the TCGA 705 primary breast cancer exomes or the 163 recurrent breast cancers independently. (B) Barplots compare the prevalence of each significantly mutated cancer gene and ESR1 in the primary and recurrent breast cancer cohorts (662 and 151 cases, respectively, where the estrogen receptor status of the primary tumor was documented). (C) Forest plot comparing the frequency with which cancer genes are mutated in the relapse cancer cohort (163 cases) compared with the primary tumor cohort (705 cases). Enrichment for each gene was determined using two-sided Fisher's exact tests and Benjamini and Hochberg correction. Box size is scaled to the number of cases and whiskers, and numbers inside brackets represent the 95% confidence interval for the odds ratio (the upper limit is clipped at 1,000).
Figure 6
Figure 6
Temporal Distribution of Mutated Cancer Genes in 51 Paired Primary Tumor and Relapse Samples (A) The heatmap indicates if the driver mutation is early (blue), defined as present in both the primary tumor and recurrence, or late, being detected in the recurrence deposit(s) only (orange), or different mutations in the same gene seen in both the primary and recurrence (purple). Asterisks () indicate cancer genes mutated in >5% of 705 primary tumor samples. The pie charts compare the proportion of mutations that are private to recurrence samples within most commonly mutated genes and within comparatively rare cancer genes (mutated in <5% of primary tumors). Stacked barplot above the heatmap relates cumulative incidence of point mutations and amplifications in (C) for each individual patient. (B) Temporal ordering of amplified oncogenes derived from analysis of next-generation sequencing data. Tile colors follow the format stated in (A). (C) Blue and pink tiles indicate the immunohistochemical (IHC) classification by estrogen receptor (ER) and progesterone receptor (PgR) of primary and relapse samples, where a split tile indicates multiple relapse samples with different ER/PgR statuses. See also Figures S5 and S6.
Figure 7
Figure 7
JAK-STAT Inactivating Mutations Are Enriched at Relapse (A) Pencil plots of JAK2 and STAT3 genes annotated with non-synonymous mutations identified in the relapse cohort (n = 163) and the primary cohort (n = 705). (B) A case (PD8709) of parallel evolution involving four truncating mutations in JAK2. Response to treatment exposures are documented. SD, stable disease; PR, partial response; PD, progressive disease. (C) A case (PD8727) of STAT3 truncating mutation arising in a liver metastasis. (D) Scatter and boxplot of the number of mutations identified in samples (within the relapse cohort, 163 cases) that do or do not contain a JAK2 or STAT3 truncating mutation. The box represents the interquartile range (IQR) bisected by the median, whiskers represent the maximum and minimum range of the data that do not exceed 1.5× the IQR. p value generated using an F test.

Comment in

References

    1. Aas T., Borresen A.L., Geisler S., Smith-Sorensen B., Johnsen H., Varhaug J.E., Akslen L.A., Lonning P.E. Specific P53 mutations are associated with de novo resistance to doxorubicin in breast cancer patients. Nat. Med. 1996;2:811–814. - PubMed
    1. Alexandrov L.B., Nik-Zainal S., Wedge D.C., Aparicio S.A., Behjati S., Biankin A.V., Bignell G.R., Bolli N., Borg A., Borresen-Dale A.L. Signatures of mutational processes in human cancer. Nature. 2013;500:415–421. - PMC - PubMed
    1. Alexandrov L.B., Nik-Zainal S., Wedge D.C., Campbell P.J., Stratton M.R. Deciphering signatures of mutational processes operative in human cancer. Cell Rep. 2013;3:246–259. - PMC - PubMed
    1. Arnedos M., Vicier C., Loi S., Lefebvre C., Michiels S., Bonnefoi H., Andre F. Precision medicine for metastatic breast cancer–limitations and solutions. Nat. Rev. Clin. Oncol. 2015;12:693–704. - PubMed
    1. Balko J.M., Giltnane J.M., Wang K., Schwarz L.J., Young C.D., Cook R.S., Owens P., Sanders M.E., Kuba M.G., Sanchez V. Molecular profiling of the residual disease of triple-negative breast cancers after neoadjuvant chemotherapy identifies actionable therapeutic targets. Cancer Discov. 2014;4:232–245. - PMC - PubMed

Publication types

MeSH terms