. 2017 Aug 15;18(1):621.
doi: 10.1186/s12864-017-4017-7.

Validation of β-lactam minimum inhibitory concentration predictions for pneumococcal isolates with newly encountered penicillin binding protein (PBP) sequences

Affiliations

Validation of β-lactam minimum inhibitory concentration predictions for pneumococcal isolates with newly encountered penicillin binding protein (PBP) sequences

Yuan Li et al. BMC Genomics. .

Abstract

Background: Genomic sequence-based deduction of antibiotic minimum inhibitory concentration (MIC) has great potential to enhance the speed and sensitivity of antimicrobial susceptibility testing. We previously developed a penicillin-binding protein (PBP) typing system and two methods (Random Forest (RF) and Mode MIC (MM)) that accurately predicted β-lactam MICs for pneumococcal isolates carrying a characterized PBP sequence type (phenotypic β-lactam MICs known for at least one isolate of this PBP type). This study evaluates the prediction performance for previously uncharacterized (new) PBP types and the probability of encountering new PBP types, both of which impact the overall prediction accuracy.

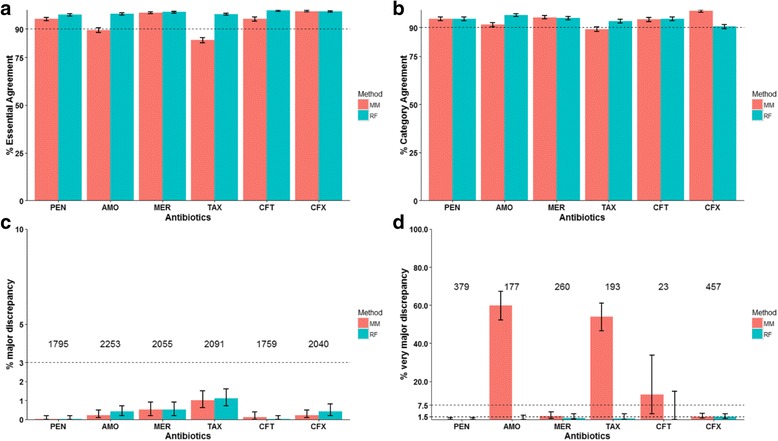
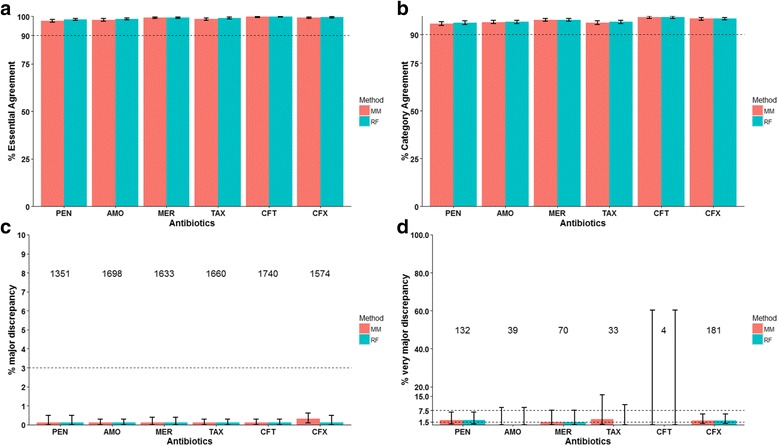
Results: The MM and RF methods were used to predict MICs of 4309 previously reported pneumococcal isolates in 2 datasets and the results were compared to the known broth microdilution MICs to 6 β-lactams. Based on a method that specifically evaluated predictions for new PBP types, the RF results were more accurate than MM results for new PBP types and showed percent essential agreement (MICs agree within ±1 dilution) >97%, percent category agreement (interpretive results agree) >93%, major discrepancy (sensitive isolate predicted as resistant) rate < 1.2%, and very major discrepancy (resistant isolate predicted as sensitive) rate < 1.4% for all 6 β-lactams. The identification of new PBP types over time was well approximated by a diminishingly increasing curve (Pearson's r = 0.99) and minimally impacted overall MIC prediction performance.

Conclusions: MIC prediction using the RF method could be an accurate alternative of phenotypic susceptibility testing even in the presence of previously uncharacterized PBP types.

Keywords: Minimum inhibitory concentration (MIC); Penicillin binding protein typing (PBP typing); Predictive modeling; Streptococcus Pneumoniae; β-lactam antibiotics.


Conflict of interest statement

Ethics approval and consent to participate

Not applicable.

Consent for publication

Not applicable.

Competing interests

The authors declare that they have no competing interests.

Publisher’s Note

Springer Nature remains neutral with regard to jurisdictional claims in published maps and institutional affiliations.

Figures

Fig. 1
Fig. 1
Comparison of the predicted β-Lactam MICs with phenotypic MICs specifically for “new” PBP types using the “leave-one-type-out” cross validation of Dataset1. All isolates of a PBP type were selected as the testing data and the remaining isolates were used as the training data. The MM (red) and RF (green) models were parametrized by the training data and then used to predict the MIC of the testing isolates, which represent a PBP type that was not included in the training data. The procedure was applied to each PBP type in turn, resulting in predicted MICs for each isolate in Dataset1, which were compared with the phenotypic MICs. a Percent Essential Agreement (MICs agree within ±1 2-fold dilution) between the predicted and phenotypic MICs. b Percent Category Agreement (interpretive results agree) between the predicted and phenotypic MICs. c Rate of major discrepancy (phenotypically sensitive isolate predicted as resistant). The number of phenotypically sensitive isolates that was used to calculate this rate is shown above the corresponding antibiotic. d Rate of very major discrepancy (phenotypically resistant isolate predicted as sensitive). The number of phenotypically resistant isolates that was used to calculate this rate is shown above the corresponding antibiotic. Error bars are 95% confidence intervals. PEN: penicillin; AMO: amoxicillin; MER: meropenem; TAX: cefotaxime; CFT: ceftriaxone; CFX: cefuroxime
Fig. 2
Fig. 2
Model of the number of PBP types observed as a function of the number of isolates sequenced. a The grey curve indicates the observed number of PBP types on sequential addition of each new genome in Dataset1. The order of genome addition underwent 1000 permutations and data from each permutation were used to fit Eq. 2 (also shown in the figure) to estimate the model parameters “a” and “b” using nonlinear least squares regression. A histogram of the 1000 estimated “a” values and a histogram of the 1000 estimated “b” values are shown inside the figure. The dashed curve indicates the predicted number of PBP types at a given number of isolates sequenced. Solid curves indicate the prediction intervals. b Agreement between the predicted number of PBP types (dashed curve, same as in (a)) and the observed numbers (blue curve) on sequential addition of each isolate in Dataset2. c Diminishing probability of encountering a new PBP type as more isolates being sequenced. The dashed curve indicates the predicted probability of an additional isolate carrying a new PBP type at a given number of isolates sequenced (Eq. 1). Solid curves are the prediction intervals
Fig. 3
Fig. 3
Comparison between the predicted β-Lactam MICs and phenotypic MICs for all isolates in Dataset2. PBP sequence and phenotypic MIC data of Dataset1 were used to train the MM (red) and RF (green) models. The trained models were used to predict MICs of all Dataset2 isolates. The resulting predicted MICs were compared with the phenotypic MICs of Dataset2 isolates. a Percent Essential Agreement (MICs agree within ±1 2-fold dilution) between the predicted and phenotypic MICs. b Percent Category Agreement (interpretive results agree) between the predicted and phenotypic MICs. c Rate of major discrepancy (phenotypically sensitive isolate predicted as resistant). The number of phenotypically sensitive isolates that was used to calculate this rate is shown above the corresponding antibiotic. d Rate of very major discrepancy (phenotypically resistant isolate predicted as sensitive). The number of phenotypically resistant isolates that was used to calculate this rate is shown above the corresponding antibiotic. Error bars are 95% confidence intervals. PEN: penicillin; AMO: amoxicillin; MER: meropenem; TAX: cefotaxime; CFT: ceftriaxone; CFX: cefuroxime
Fig. 4
Fig. 4
Comparison between the predicted β-Lactam MICs and phenotypic MICs for new PBP type in Dataset2. All isolates of Dataset1 were used to train the MM (red) and RF (green) models. The trained models were used to predict MICs of Dataset2 isolates that carried a PBP type not seen in Dataset1 (new PBP type). The resulting predicted MICs were compared with the phenotypic MICs of these Dataset2 isolates. a Percent Essential Agreement (MICs agree within ±1 2-fold dilution) between the predicted and phenotypic MICs. b Percent Category Agreement (interpretive results agree) between the predicted and phenotypic MICs. c Rate of major discrepancy (phenotypically sensitive isolate predicted as resistant). The number of phenotypically sensitive isolates that was used to calculate this rate is shown above the corresponding antibiotic. d Rate of very major discrepancy (phenotypically resistant isolate predicted as sensitive). The number of phenotypically resistant isolates that was used to calculate this rate is shown above the corresponding antibiotic. Error bars are 95% confidence intervals. PEN: penicillin; AMO: amoxicillin; MER: meropenem; TAX: cefotaxime; CFT: ceftriaxone; CFX: cefuroxime

References

    1. Koser CU, Ellington MJ, Cartwright EJ, Gillespie SH, Brown NM, Farrington M, Holden MT, Dougan G, Bentley SD, Parkhill J, et al. Routine use of microbial whole genome sequencing in diagnostic and public health microbiology. PLoS Pathog. 2012;8(8) doi: 10.1371/journal.ppat.1002824. - DOI - PMC - PubMed
    1. Koser CU, Bryant JM, Becq J, Torok ME, Ellington MJ, Marti-Renom MA, Carmichael AJ, Parkhill J, Smith GP, Peacock SJ. Whole-genome sequencing for rapid susceptibility testing of M. Tuberculosis. N Engl J Med. 2013;369(3):290–292. doi: 10.1056/NEJMc1215305. - DOI - PMC - PubMed
    1. Dowson CG, Johnson AP, Cercenado E, George RC. Genetics of oxacillin resistance in clinical isolates of Streptococcus Pneumoniae that are oxacillin resistant and penicillin susceptible. Antimicrob Agents Chemother. 1994;38(1):49–53. doi: 10.1128/AAC.38.1.49. - DOI - PMC - PubMed
    1. Barcus VA, Ghanekar K, Yeo M, Coffey TJ, Dowson CG. Genetics of high level penicillin resistance in clinical isolates of Streptococcus Pneumoniae. FEMS Microbiol Lett. 1995;126(3):299–303. doi: 10.1111/j.1574-6968.1995.tb07433.x. - DOI - PubMed
    1. Grebe T, Hakenbeck R. Penicillin-binding proteins 2b and 2x of Streptococcus Pneumoniae are primary resistance determinants for different classes of beta-lactam antibiotics. Antimicrob Agents Chemother. 1996;40(4):829–834. - PMC - PubMed

Publication types

MeSH terms