

Understanding the cluster randomised crossover design: a graphical illustraton of the components of variation and a sample size tutorial
- PMID: 28810895
- PMCID: PMC5557529
- DOI: 10.1186/s13063-017-2113-2
Understanding the cluster randomised crossover design: a graphical illustraton of the components of variation and a sample size tutorial
Abstract
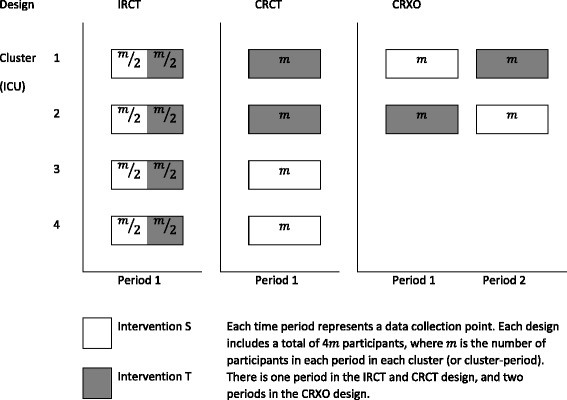
Background: In a cluster randomised crossover (CRXO) design, a sequence of interventions is assigned to a group, or 'cluster' of individuals. Each cluster receives each intervention in a separate period of time, forming 'cluster-periods'. Sample size calculations for CRXO trials need to account for both the cluster randomisation and crossover aspects of the design. Formulae are available for the two-period, two-intervention, cross-sectional CRXO design, however implementation of these formulae is known to be suboptimal. The aims of this tutorial are to illustrate the intuition behind the design; and provide guidance on performing sample size calculations.
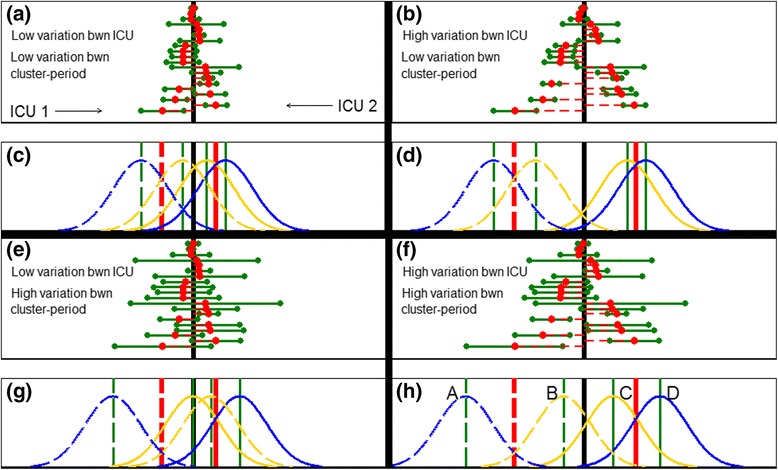
Methods: Graphical illustrations are used to describe the effect of the cluster randomisation and crossover aspects of the design on the correlation between individual responses in a CRXO trial. Sample size calculations for binary and continuous outcomes are illustrated using parameters estimated from the Australia and New Zealand Intensive Care Society - Adult Patient Database (ANZICS-APD) for patient mortality and length(s) of stay (LOS).
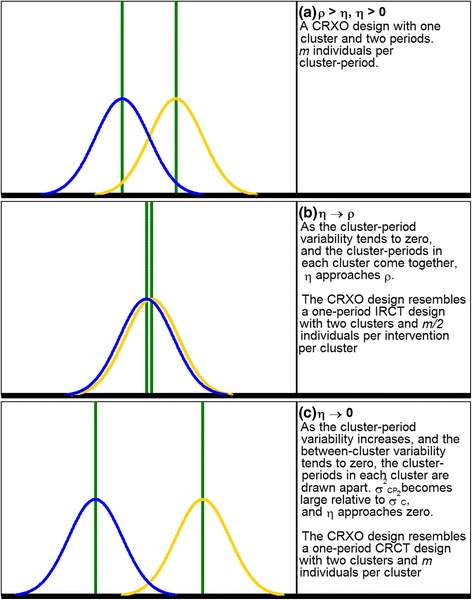
Results: The similarity between individual responses in a CRXO trial can be understood in terms of three components of variation: variation in cluster mean response; variation in the cluster-period mean response; and variation between individual responses within a cluster-period; or equivalently in terms of the correlation between individual responses in the same cluster-period (within-cluster within-period correlation, WPC), and between individual responses in the same cluster, but in different periods (within-cluster between-period correlation, BPC). The BPC lies between zero and the WPC. When the WPC and BPC are equal the precision gained by crossover aspect of the CRXO design equals the precision lost by cluster randomisation. When the BPC is zero there is no advantage in a CRXO over a parallel-group cluster randomised trial. Sample size calculations illustrate that small changes in the specification of the WPC or BPC can increase the required number of clusters.
Conclusions: By illustrating how the parameters required for sample size calculations arise from the CRXO design and by providing guidance on both how to choose values for the parameters and perform the sample size calculations, the implementation of the sample size formulae for CRXO trials may improve.
Keywords: Between-period correlation; Cluster randomised; Components of variability; Crossover; Intracluster correlation; Sample size; Within-period correlation.
Conflict of interest statement
Authors’ information
Not applicable
Ethics approval and consent to participate
Not applicable.
Consent for publication
Not applicable.
Competing interests
The authors declare that they have no competing interests.
Publisher’s Note
Springer Nature remains neutral with regard to jurisdictional claims in published maps and institutional affiliations.
Figures
References
-
- Eldridge S, Kerry S. A practical guide to cluster randomised trials in health services research. Chichester: Wiley; 2012.
-
- Ukoumunne OC, Gulliford MC, Chinn S, Sterne JA, Burney PG. Methods for evaluating area-wide and organisation-based interventions in health and health care: a systematic review. Health Technol Assess. 1999;3(5):iii–92. - PubMed
Publication types
MeSH terms
LinkOut - more resources
Full Text Sources
Other Literature Sources
Medical
