

A novel D2O tracer method to quantify RNA turnover as a biomarker of de novo ribosomal biogenesis, in vitro, in animal models, and in human skeletal muscle
- PMID: 28811296
- PMCID: PMC5814597
- DOI: 10.1152/ajpendo.00157.2017
A novel D2O tracer method to quantify RNA turnover as a biomarker of de novo ribosomal biogenesis, in vitro, in animal models, and in human skeletal muscle
Abstract
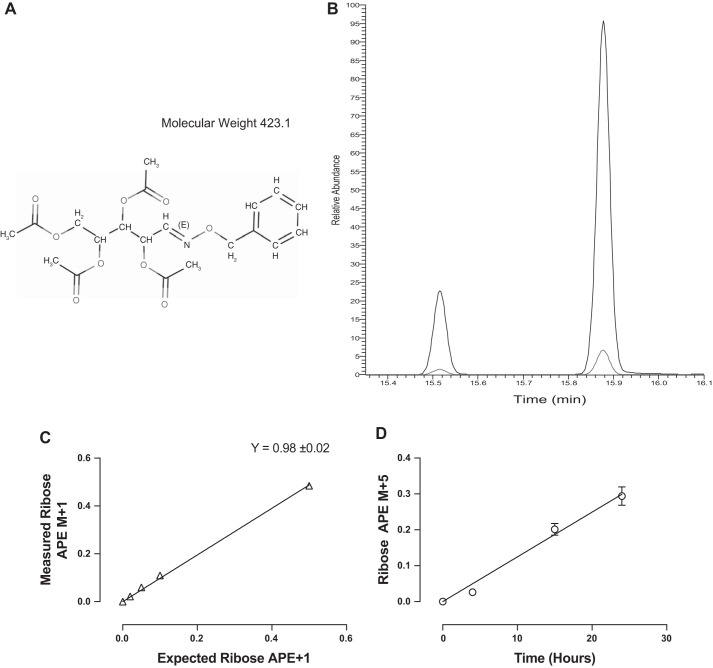
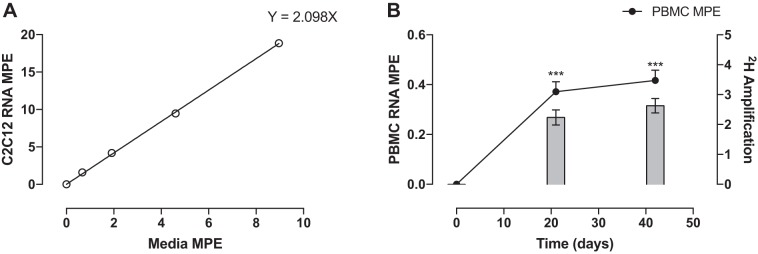
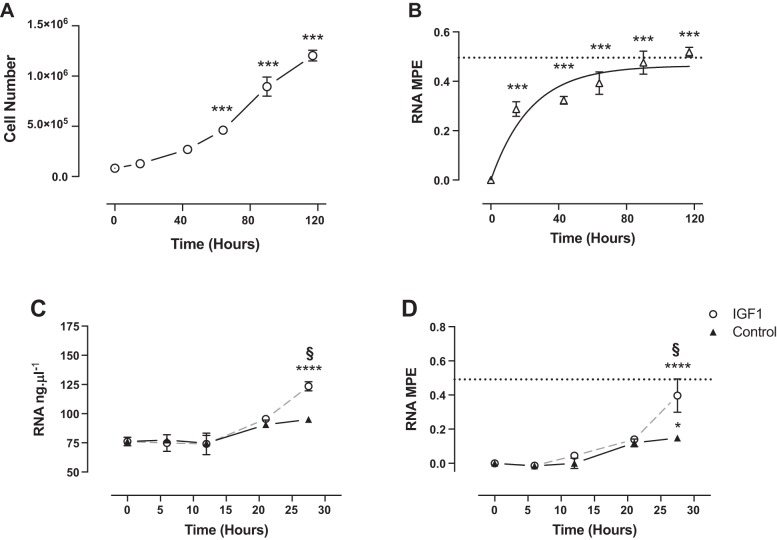
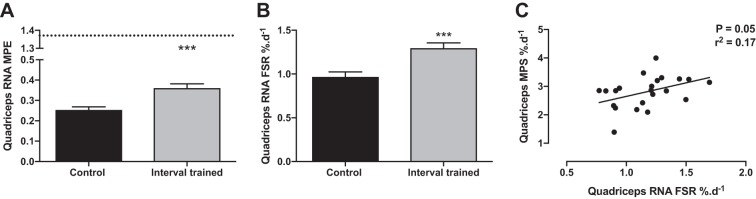
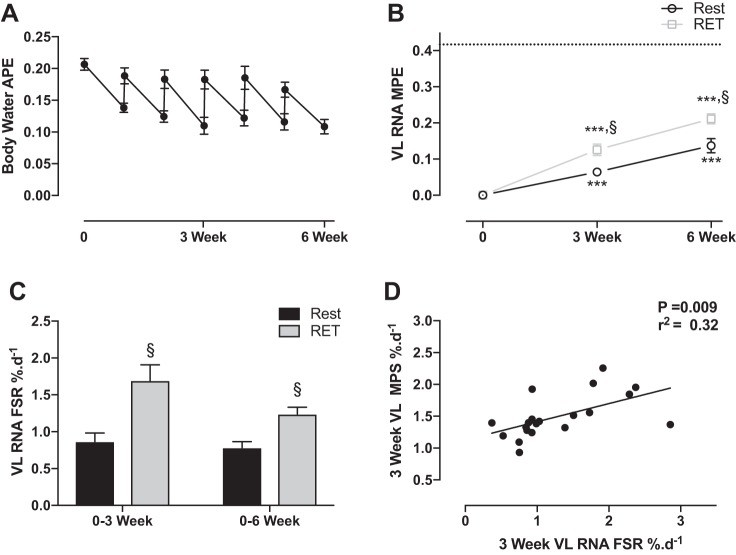
Current methods to quantify in vivo RNA dynamics are limited. Here, we developed a novel stable isotope (D2O) methodology to quantify RNA synthesis (i.e., ribosomal biogenesis) in cells, animal models, and humans. First, proliferating C2C12 cells were incubated in D2O-enriched media and myotubes ±50 ng/ml IGF-I. Second, rat quadriceps (untrained, n = 9; 7-wk interval-"like" training, n = 13) were collected after ~3-wk D2O (70 atom %) administration, with body-water enrichment monitored via blood sampling. Finally, 10 (23 ± 1 yr) men consumed 150-ml D2O followed by 50 ml/wk and undertook 6-wk resistance exercise (6 × 8 repetitions, 75% 1-repetition maximum 3/wk) with body-water enrichment monitored by saliva sampling and muscle biopsies (for determination of RNA synthesis) at 0, 3, and 6 wk. Ribose mole percent excess (r-MPE) from purine nucleotides was analyzed via GC-MS/MS. Proliferating C2C12 cell r-MPE exhibited a rise to plateau, whereas IGF-I increased myotube RNA from 76 ± 3 to 123 ± 3 ng/μl and r-MPE by 0.39 ± 0.1% (both P < 0.01). After 3 wk, rat quadriceps r-MPE had increased to 0.25 ± 0.01% (P < 0.01) and was greater with running exercise (0.36 ± 0.02%; P < 0.01). Human muscle r-MPE increased to 0.06 ± 0.01 and 0.13 ± 0.02% at 3/6 wk, respectively, equating to synthesis rates of ~0.8%/day, increasing with resistance exercise to 1.7 ± 0.3%/day (P < 0.01) and 1.2 ± 0.1%/day (P < 0.05) at 3/6 wk, respectively. Therefore, we have developed and physiologically validated a novel technique to explore ribosomal biogenesis in a multimodal fashion.
Keywords: D2O; RNA synthesis; muscle; ribosomal biogenesis.
Copyright © 2017 the American Physiological Society.
Figures
References
-
- Atherton PJ, Etheridge T, Watt PW, Wilkinson D, Selby A, Rankin D, Smith K, Rennie MJ. Muscle full effect after oral protein: time-dependent concordance and discordance between human muscle protein synthesis and mTORC1 signaling. Am J Clin Nutr 92: 1080–1088, 2010. doi:10.3945/ajcn.2010.29819. - DOI - PubMed
-
- Brook MS, Wilkinson DJ, Mitchell WK, Lund JN, Szewczyk NJ, Greenhaff PL, Smith K, Atherton PJ. Skeletal muscle hypertrophy adaptations predominate in the early stages of resistance exercise training, matching deuterium oxide-derived measures of muscle protein synthesis and mechanistic target of rapamycin complex 1 signaling. FASEB J 29: 4485–4496, 2015. doi:10.1096/fj.15-273755. - DOI - PubMed
-
- Busch R, Kim YK, Neese RA, Schade-Serin V, Collins M, Awada M, Gardner JL, Beysen C, Marino ME, Misell LM, Hellerstein MK. Measurement of protein turnover rates by heavy water labeling of nonessential amino acids. Biochim Biophys Acta 1760: 730–744, 2006. doi:10.1016/j.bbagen.2005.12.023. - DOI - PubMed
-
- Cheek DB. Human Growth. Body Composition, Cell Growth, Energy, and Intelligence. Philadelphia, PA: Lea & Febiger, 1968.
-
- Chesley A, MacDougall JD, Tarnopolsky MA, Atkinson SA, Smith K. Changes in human muscle protein synthesis after resistance exercise. J Appl Physiol (1985) 73: 1383–1388, 1992. - PubMed
Publication types
MeSH terms
Substances
Grants and funding
LinkOut - more resources
Full Text Sources
Other Literature Sources
Miscellaneous