. 2017 Aug 15;8(4):e01069-17.
doi: 10.1128/mBio.01069-17.

Bacteriophages of Gordonia spp. Display a Spectrum of Diversity and Genetic Relationships

Affiliations

Bacteriophages of Gordonia spp. Display a Spectrum of Diversity and Genetic Relationships

Welkin H Pope et al. mBio. .

Abstract

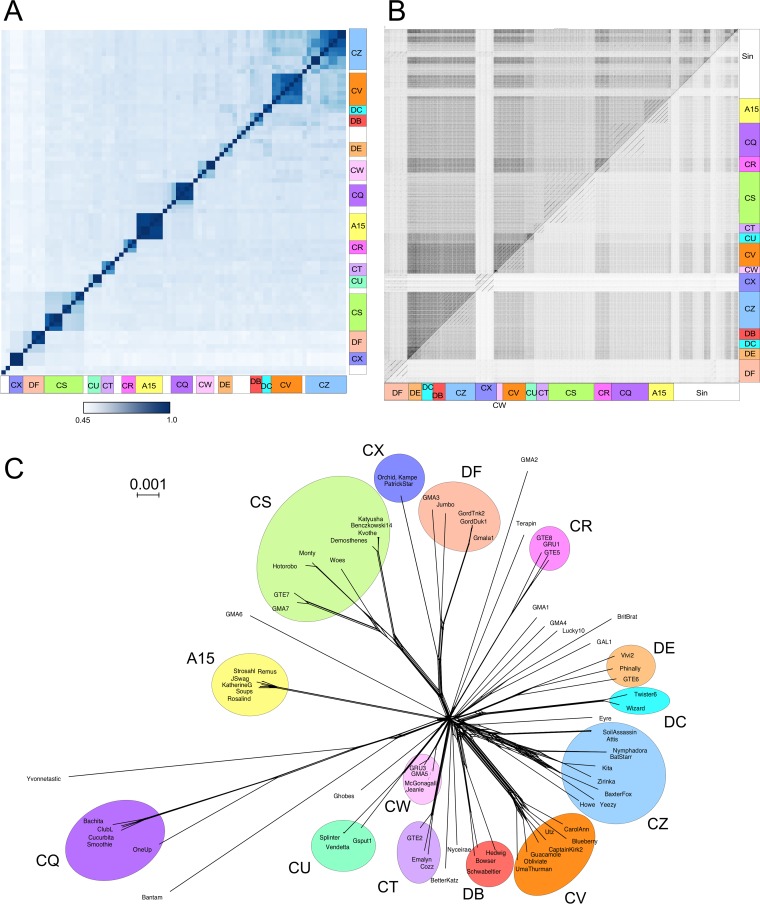
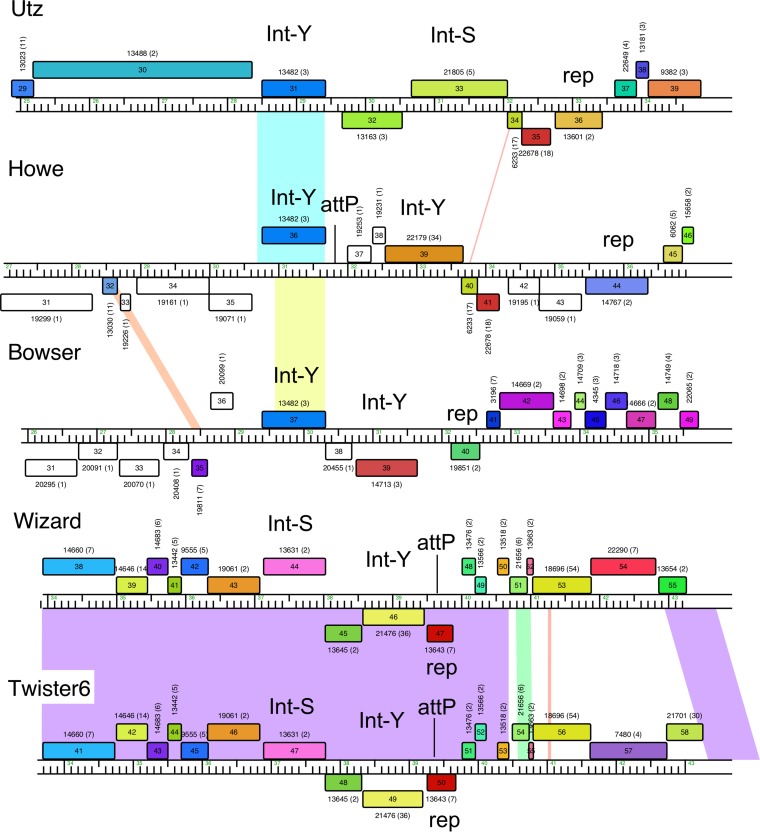
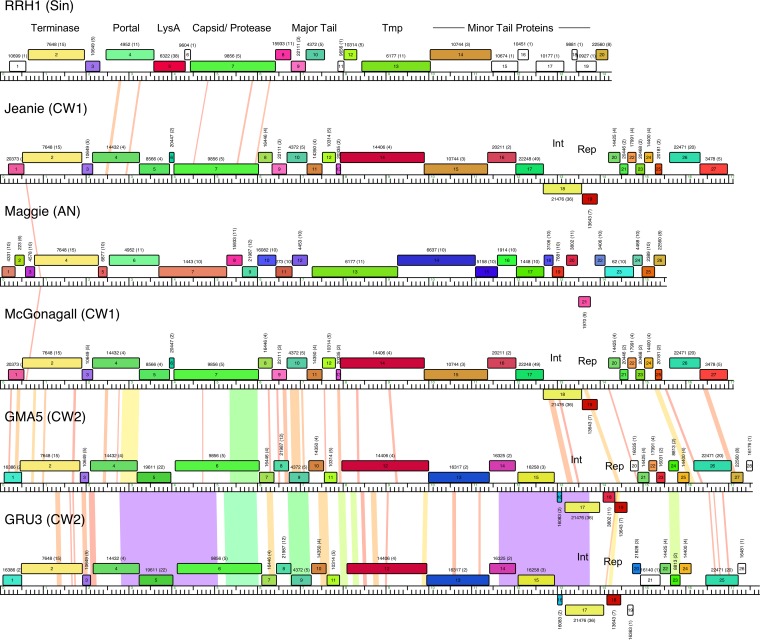
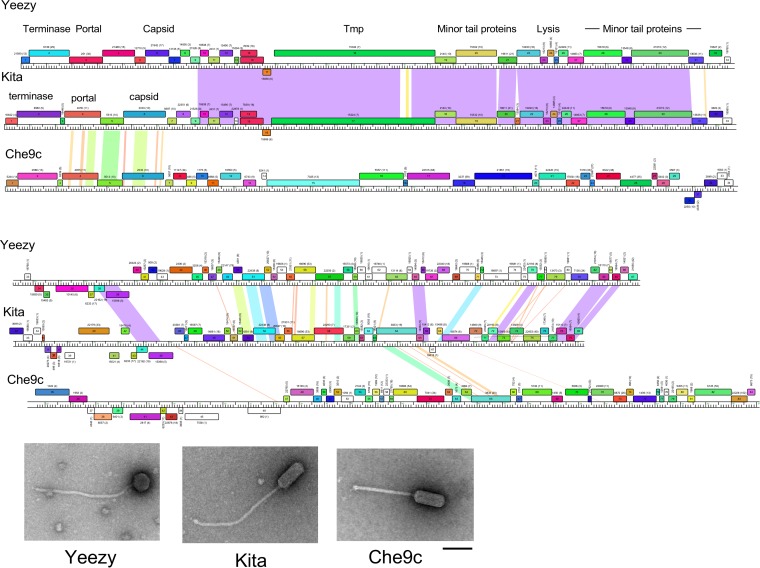
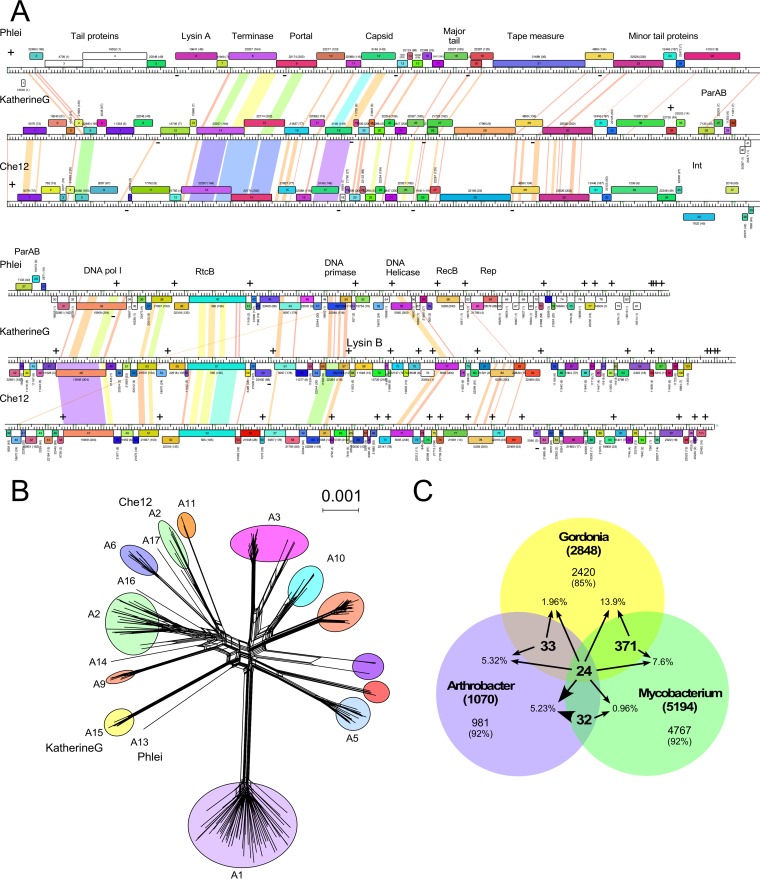
The global bacteriophage population is large, dynamic, old, and highly diverse genetically. Many phages are tailed and contain double-stranded DNA, but these remain poorly characterized genomically. A collection of over 1,000 phages infecting Mycobacterium smegmatis reveals the diversity of phages of a common bacterial host, but their relationships to phages of phylogenetically proximal hosts are not known. Comparative sequence analysis of 79 phages isolated on Gordonia shows these also to be diverse and that the phages can be grouped into 14 clusters of related genomes, with an additional 14 phages that are "singletons" with no closely related genomes. One group of six phages is closely related to Cluster A mycobacteriophages, but the other Gordonia phages are distant relatives and share only 10% of their genes with the mycobacteriophages. The Gordonia phage genomes vary in genome length (17.1 to 103.4 kb), percentage of GC content (47 to 68.8%), and genome architecture and contain a variety of features not seen in other phage genomes. Like the mycobacteriophages, the highly mosaic Gordonia phages demonstrate a spectrum of genetic relationships. We show this is a general property of bacteriophages and suggest that any barriers to genetic exchange are soft and readily violable.IMPORTANCE Despite the numerical dominance of bacteriophages in the biosphere, there is a dearth of complete genomic sequences. Current genomic information reveals that phages are highly diverse genomically and have mosaic architectures formed by extensive horizontal genetic exchange. Comparative analysis of 79 phages of Gordonia shows them to not only be highly diverse, but to present a spectrum of relatedness. Most are distantly related to phages of the phylogenetically proximal host Mycobacterium smegmatis, although one group of Gordonia phages is more closely related to mycobacteriophages than to the other Gordonia phages. Phage genome sequence space remains largely unexplored, but further isolation and genomic comparison of phages targeted at related groups of hosts promise to reveal pathways of bacteriophage evolution.

Keywords: Gordonia; bacteriophage genetics; bacteriophages.


Figures

FIG 1
FIG 1
Analyses of complete genome sequences of phages of Gordonia spp. (A) Heat map of average nucleotide identities (ANIs) of Gordonia phages. Pairwise ANIs were calculated using DNA Master, and the heat map was generated using R. (B) Dot plot of complete Gordonia phage sequences. (C) SplitsTree network of shared gene content between Gordonia phages. All genes were grouped into phams using Phamerator. Each phage was scored by the presence/absence of phams, and the distance between each phage was calculated using SplitsTree. The scale bar indicates 0.001 substitution. Phages are colored according to cluster membership.
FIG 2
FIG 2
Gordonia phage genomes exhibit multiple integrases. Phamerator map of the integration cassettes of the six phages with double integrases. Integrases are labeled with catalytic residue (Y or S), and attP sites are indicated when known. Wizard gene 44 and Twister6 gene 47 are predicted to be nonfunctional.
FIG 3
FIG 3
Small-genome actinobacteriophages. Shown are genomic maps of the small-genome phages included in the Actinobacteriophage_789 database. The central rule indicates nucleotide position—with large tick marks every 1 kbp—and the colored boxes indicate predicted genes. Genes are colored according to pham membership, with the number on the top of each box representing the pham number, followed by the number of members of the pham in the database in parentheses. Pairwise DNA sequence similarity calculated by BLASTn is shown between adjacent genomes and is spectrum colored, with violet being the most similar and red the least above a threshold E value of 10−5. Phages infect the following hosts: RRH1, Rhodococcus sp.; Jeanie, G. neofelifaecis; Maggie, Arthrobacter; McGonagall, G. neofelifaecis; GMA5, G. malaquae; and GRU1, G. rubripertincta.
FIG 4
FIG 4
Gordonia phages in Clusters CZ exhibit multiple virion morphologies. (Top) Genome maps of Gordonia phages Kita and Yeezy and mycobacteriophage Che9c (see Fig. 3 for details) displayed in two tiers. Yeezy and Kita are both Gordonia phages but have different capsid morphologies: Yeezy is isometric, and Kita is prolate. Che9c is a mycobacteriophage that shares capsid structure and assembly genes with Kita and is also prolate. (Bottom) Electron micrographs of Kita, Yeezy, and Che9c. Scale bar = 100 nm.
FIG 5
FIG 5
Relationships between Gordonia and Mycobacterium phages. (A) Genome maps of Gordonia phage KatherineG and mycobacteriophages Phlei and Che12 (see Fig. 3 for details). Stoperators are indicated with a + or − above or below the map to indicate sequence orientation. (B) SplitsTree (60) network representation of shared gene content among the Cluster A phages. Phage groups are colored according to subcluster. The positions of Che12 (A2), Phlei (A13), and KatherineG (A15) are shown. (C) Shared gene phamilies of phages of Mycobacterium, Gordonia, and Arthrobacter. Phamily membership was determined using Phamerator, and the proportions of shared phams were calculated: 24 phams out of 8,294 total are shared between phages of all three hosts, 395 phams are shared between Gordonia and Mycobacterium, 57 phams are shared between Gordonia and Arthrobacter, and 56 phams are shared between Arthrobacter and Mycobacterium. The percentages shown are determined relative to the total number of phams present in each host (the number in boldface in parentheses in each circle).
FIG 6
FIG 6
Gene content dissimilarity in phage populations. For all plots, the x axis is the ordered-by-magnitude individual pairwise comparisons, the y axis is the gene content dissimilarity (GCD [where 1 and 0 correspond to no shared genes and 100% shared genes, respectively]). (A) GCD in mycobacteriophages. (B) GCD in Gordonia phages. (C) GCD in Arthrobacter phages. (D) GCD in cyanophages. Both Mycobacterium and Gordonia phages exhibit a smooth curve of pairwise GCD values when ordered by magnitude. Cyanobacteriophages also exhibit a continuum of diversity with respect to GCD values; however, the slope of the line exhibits a number of plateaus, likely reflecting the “discrete” lineages described previously. Arthrobacter phages exhibit a large discontinuity, reflective of the few shared genes between clusters. Brackets indicate the interval between 30% and 70% gene content dissimilarity.
FIG 7
FIG 7
The various types of relationships of phage genomes are illustrated by three panels, varying (from left to right) from well-separated groups of related phages to a near continuum of relationships with weakly distinct groups. Phages sharing portions of their genomes can be grouped into clusters (shown in similar colors and surrounded by thick dashed circles), some of which can be subdivided into subclusters (surrounded by thin dashed circles). Typically, phages within a cluster have low pairwise gene content dissimilarity (GCD) values (i.e., they share a high proportion of their genes) and phages in different clusters have high pairwise GCD values. The relationships can be represented by MaxGCDGap values that correspond to discontinuities in the range of relationships of one phage relative to all others. Arrows indicate pairs of genomes in relationships at the high value of the MaxGCDGap parameter, which may occur between different clusters (and singletons) or between subclusters within a cluster. The MaxGCDGap values vary on the overall diversity within and between clusters, but are generally higher within phage populations with genetically well-separated phages (e.g., left panel) than where there is a near continuum of genetic diversity (e.g., right panel).
FIG 8
FIG 8
Phage genetic relationships as measured by MaxGCDGap. (A) Representative pairwise GCDs between Gordonia phage Monty (left) or GMA2 (right) and all other phages in the Actinobacteriophage_789 database, ordered by magnitude, similar to Fig. 6 (see Fig. S28 at figshare [https://doi.org/10.6084/m9.figshare.5149663]). Phages involved in comparisons with a GCD of <0.8 are highlighted. The maximum gap in GCD values (MaxGCDGap) was identified for each phage. For example, Cluster CS Monty’s MaxGCDGap occurs between Gordonia phage Kvothe (Cluster CS) and the singleton (sin) Rhodococcus phage ReqiDocB7. It should be noted that the second largest GCD gap is between phages in other CS subclusters (Hotorobo and Woes), illustrating that for some phages, the MaxGCDGap may reflect the distance between subclusters rather than clusters. Singleton phage GMA2 has no close relatives, and the MaxGCDGap is large and approaches 1.0. (B) All phage-specific MaxGCDGap values ordered by magnitude, with the mean and median indicated. Each data point represents a single phage genome. (C) All Gordonia phage-specific MaxGCDGaps grouped by cluster and ordered by median. Each data point represents a single phage genome. (D and E) Box plot distribution of actinobacteriophage-specific MaxGCDGaps from panel B grouped by subcluster (D) or cluster (E) and ordered by median. Boxes reflect the central 50% of the data, with the median as a black bar, and the individual MaxGCDGap values are superimposed. Only the most abundant groups are plotted. (F) Box plot distribution of phage-specific MaxGCDGaps as in panels D and E but grouped by host genus and with mean MaxGCDGaps displayed above. Only the most abundant genera are plotted. (G) Box plot distribution of Synechococcus phage-specific MaxGCDGaps as in panels D to F, grouped by the six previously identified lineages (Lin.) (8). The topmost bar chart in each panel indicates the number of phages per group.

References

    1. Hatfull GF, Hendrix RW. 2011. Bacteriophages and their genomes. Curr Opin Virol 1:298–303. doi: 10.1016/j.coviro.2011.06.009. - DOI - PMC - PubMed
    1. Pedulla ML, Ford ME, Houtz JM, Karthikeyan T, Wadsworth C, Lewis JA, Jacobs-Sera D, Falbo J, Gross J, Pannunzio NR, Brucker W, Kumar V, Kandasamy J, Keenan L, Bardarov S, Kriakov J, Lawrence JG, Jacobs WR Jr, Hendrix RW, Hatfull GF. 2003. Origins of highly mosaic mycobacteriophage genomes. Cell 113:171–182. doi: 10.1016/S0092-8674(03)00233-2. - DOI - PubMed
    1. Hendrix RW, Smith MC, Burns RN, Ford ME, Hatfull GF. 1999. Evolutionary relationships among diverse bacteriophages and prophages: all the world’s a phage. Proc Natl Acad Sci U S A 96:2192–2197. doi: 10.1073/pnas.96.5.2192. - DOI - PMC - PubMed
    1. Pope WH, Bowman CA, Russell DA, Jacobs-Sera D, Asai DJ, Cresawn SG, Jacobs WR, Hendrix RW, Lawrence JG, Hatfull GF, Science Education Alliance Phage Hunters Advancing Genomics and Evolutionary Science, Phage Hunters Integrating Research and Education, Mycobacterial Genetics Course . 2015. Whole genome comparison of a large collection of mycobacteriophages reveals a continuum of phage genetic diversity. eLife 4:e06416. doi: 10.7554/eLife.06416. - DOI - PMC - PubMed
    1. Grose JH, Casjens SR. 2014. Understanding the enormous diversity of bacteriophages: the tailed phages that infect the bacterial family Enterobacteriaceae. Virology 468–470:421–443. doi: 10.1016/j.virol.2014.08.024. - DOI - PMC - PubMed

Publication types

LinkOut - more resources