. 2017 Aug 29;114(35):9273-9278.
doi: 10.1073/pnas.1704908114. Epub 2017 Aug 15.

Angular reconstitution-based 3D reconstructions of nanomolecular structures from superresolution light-microscopy images

Affiliations

Angular reconstitution-based 3D reconstructions of nanomolecular structures from superresolution light-microscopy images

Desirée Salas et al. Proc Natl Acad Sci U S A. .

Abstract

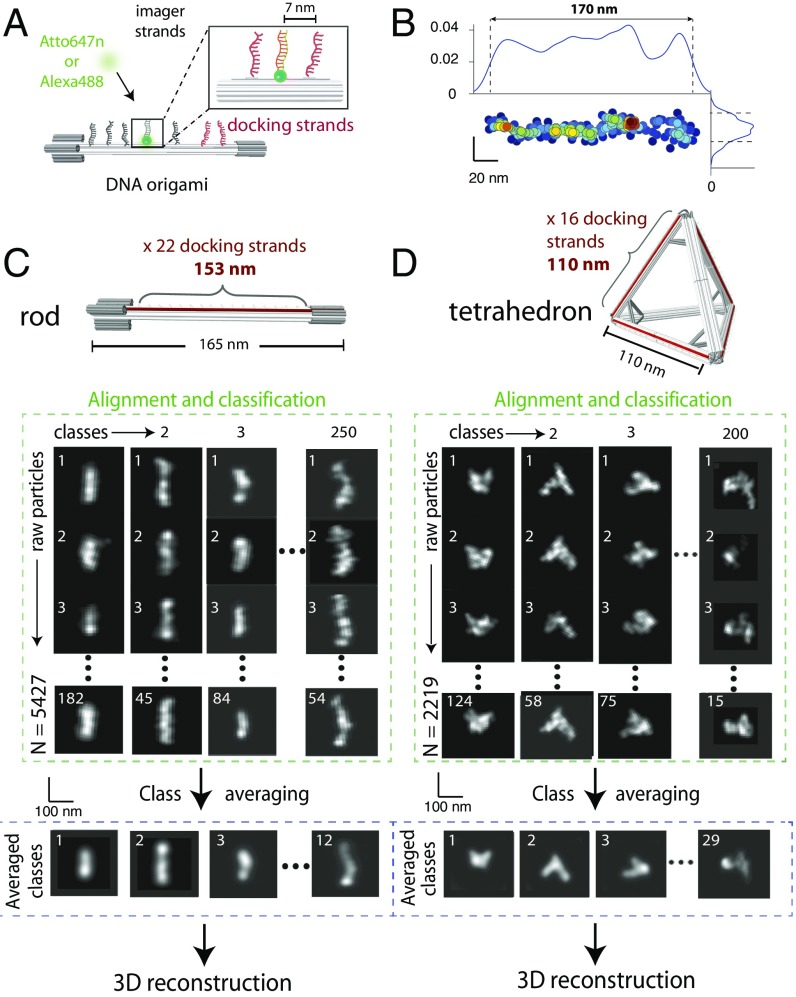
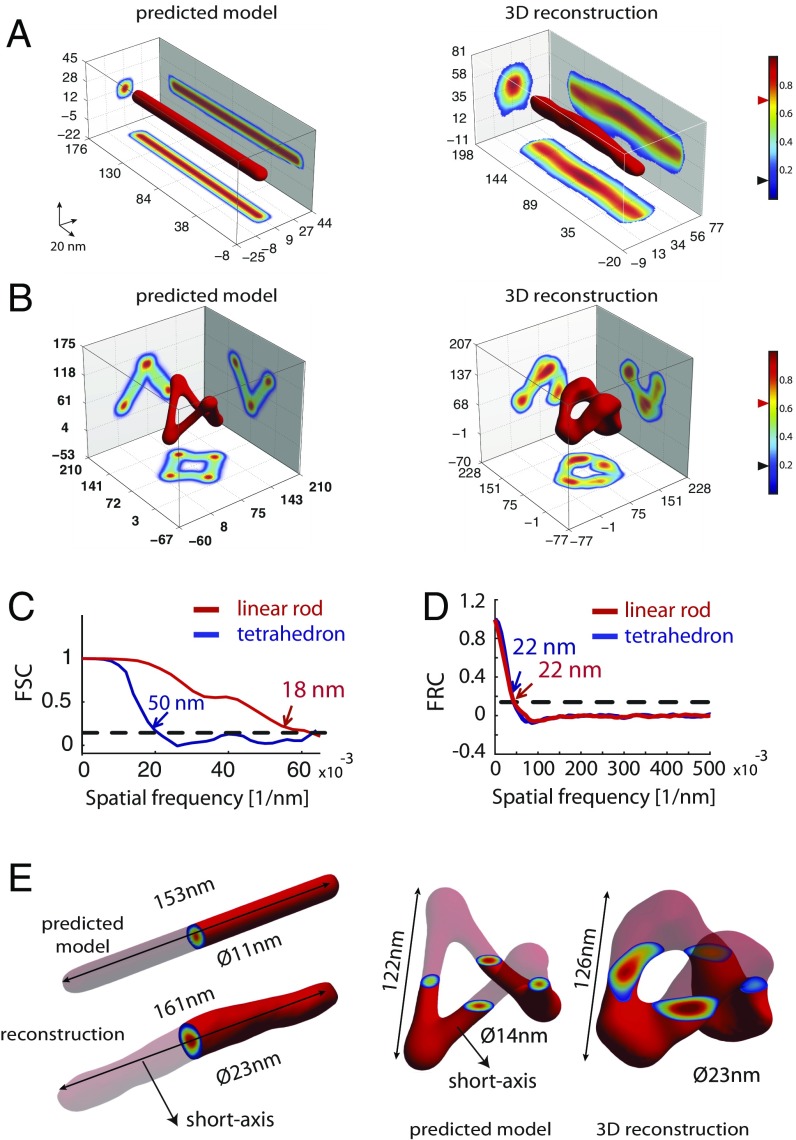
Superresolution light microscopy allows the imaging of labeled supramolecular assemblies at a resolution surpassing the classical diffraction limit. A serious limitation of the superresolution approach is sample heterogeneity and the stochastic character of the labeling procedure. To increase the reproducibility and the resolution of the superresolution results, we apply multivariate statistical analysis methods and 3D reconstruction approaches originally developed for cryogenic electron microscopy of single particles. These methods allow for the reference-free 3D reconstruction of nanomolecular structures from two-dimensional superresolution projection images. Since these 2D projection images all show the structure in high-resolution directions of the optical microscope, the resulting 3D reconstructions have the best possible isotropic resolution in all directions.

Keywords: 3D reconstruction; DNA origami; multivariate statistical analysis; structural biology; superresolution microscopy.


Conflict of interest statement

The authors declare no conflict of interest.

Figures

Fig. 1.
Fig. 1.
Self-assembly of DNA origami and single-particle averaging. (A) Schematic representation of DNA origami and DNA-PAINT strategy. Docking strands were positioned on the surface of the origami at regular spacings; imager strands were localized with nanometer precision. (B) Single, surface-bound DNA origami can be visualized by DNA-PAINT (Left and Right). The typical profile width was 14 nm (Bottom). (C and D, Top) Schematic representations of linear rod and tetrahedron. (Bottom) Raw particles were reoriented and retranslated, aligned, and classified to obtain class averages. Total number of raw particles from over 20 independent experiments: 5,427 for linear rod and 2,219 for tetrahedron.
Fig. 2.
Fig. 2.
Three-dimensional structures of DNA origami by single-particle reconstruction. (A and B, Left) Three-dimensional structures of linear rod and tetrahedron from theoretical models. (Right) Template-free 3D reconstructions. Black and red triangles on colormaps represent the threshold and iso values used for the intensity projections and 3D representation of the structures, respectively. (C) FSC of the final 3D reconstructions. (D) Average FRC obtained by averaging the FRC curves of 100 single particles for the linear rod and the tetrahedron. (E) Direct comparison of the reference model and 3D reconstructions.
Fig. 3.
Fig. 3.
Fidelity of 3D single-particle reconstructions for different labeling spacings. (A) Robustness of the 3D single-particle reconstruction as a function of labeling spacing measured as the FSC resolution obtained by correlating the high-resolution theoretical model and the 3D reconstruction. (Inset) Three-dimensional structure of the high-resolution model of the T4 bacteriophage (250 nm in height, 150 nm in diameter). (B–E) Reconstruction results for different labeling spacings. (Left) Three-dimensional representation of single-molecule localizations from a single simulated particle. (Middle) Projections of raw particles and class averages. (Right) Final 3D single-particle analysis reconstruction. A total of 4,000 raw particles were used for each labeling spacing. Black and red triangles on colormaps represent the threshold and iso values used for the intensity projections and 3D representation of the structures, respectively.
Fig. 4.
Fig. 4.
Three-dimensional reconstructions of asymmetric structures. (A and D) High-resolution structural models of a spiral-shaped and a duckling-shaped structure. (B and E) Class averages produced by cumulating similar projections of the spiral-shaped and duckling structures generated with a 6- and 5-nm labeling spacing, respectively. (C and F) Three-dimensional reconstructions of the spiral and duckling structures. Black and red triangles on colormaps represent the threshold and iso values used for the intensity projections and 3D representation of the structures, respectively.

References

    1. Low HH, et al. Structure of a type IV secretion system. Nature. 2014;508:550–553. - PMC - PubMed
    1. Schmidt C, et al. The cryo-EM structure of a ribosome-Ski2-Ski3-Ski8 helicase complex. Science. 2016;354:1431–1433. - PubMed
    1. Frank J. Advances in the field of single-particle cryo-electron microscopy over the last decade. Nat Protoc. 2017;12:209–212. - PMC - PubMed
    1. Schermelleh L, Heintzmann R, Leonhardt H. A guide to super-resolution fluorescence microscopy. J Cell Biol. 2010;190:165–175. - PMC - PubMed
    1. Shtengel G, et al. Interferometric fluorescent super-resolution microscopy resolves 3D cellular ultrastructure. Proc Natl Acad Sci USA. 2009;106:3125–3130. - PMC - PubMed

Publication types