. 2017 Aug 15;8(1):262.
doi: 10.1038/s41467-017-00259-3.

Membrane-free culture and real-time barrier integrity assessment of perfused intestinal epithelium tubes

Affiliations

Membrane-free culture and real-time barrier integrity assessment of perfused intestinal epithelium tubes

Sebastiaan J Trietsch et al. Nat Commun. .

Abstract

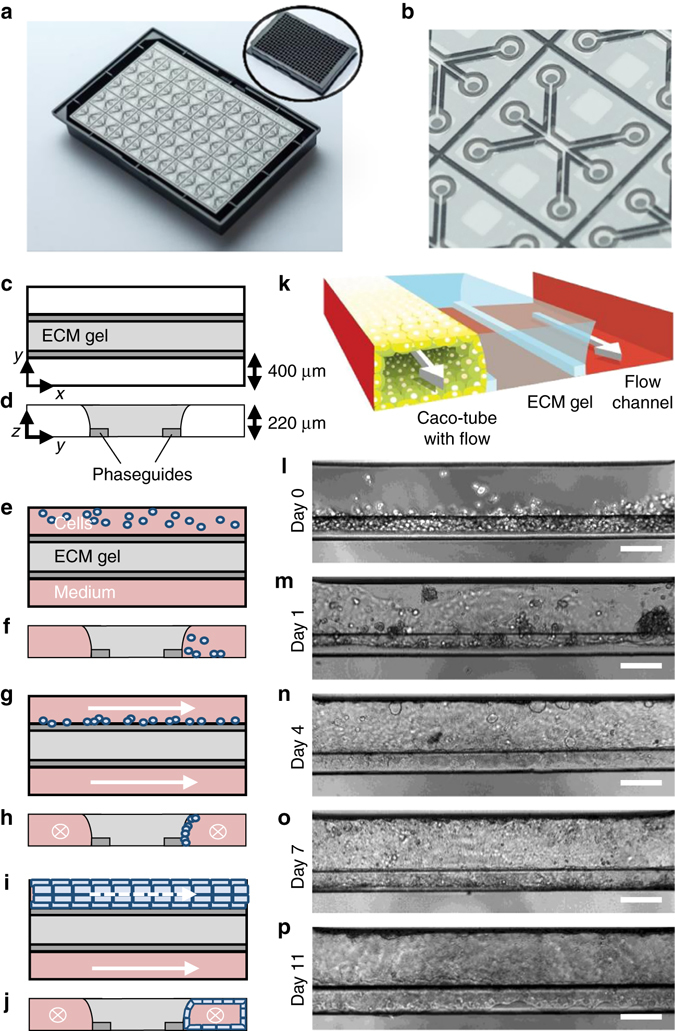
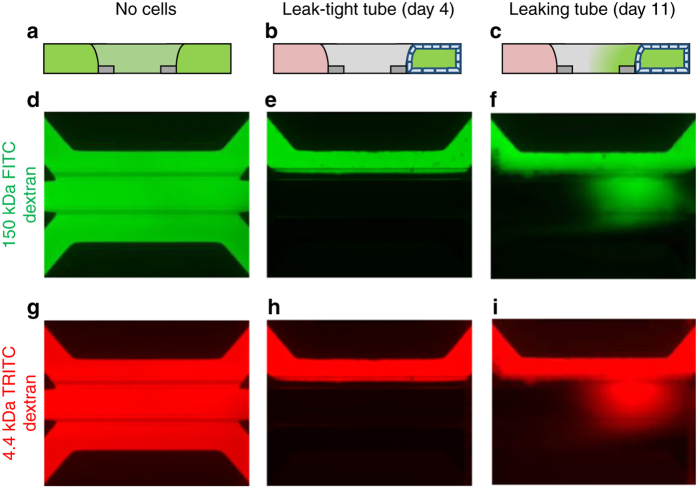
In vitro models that better reflect in vivo epithelial barrier (patho-)physiology are urgently required to predict adverse drug effects. Here we introduce extracellular matrix-supported intestinal tubules in perfused microfluidic devices, exhibiting tissue polarization and transporter expression. Forty leak-tight tubules are cultured in parallel on a single plate and their response to pharmacological stimuli is recorded over 125 h using automated imaging techniques. A study comprising 357 gut tubes is performed, of which 93% are leak tight before exposure. EC50-time curves could be extracted that provide insight into both concentration and exposure time response. Full compatibility with standard equipment and user-friendly operation make this Organ-on-a-Chip platform readily applicable in routine laboratories.Efforts to determine the effects of drugs on epithelial barriers could benefit from better in vitro models. Here the authors develop a microfluidic device supporting the growth and function of extracellular matrix-supported intestinal tubules, and evaluate the effect of staurosporine and acetylsalicylic acid on barrier integrity.


Conflict of interest statement

S.J.T., E.N., M.C.S., M.K.V., K.J.W., H.L.L., A.N., C.P.N., D.K., J.J., and P.V. are employees of MIMETAS BV, the Netherlands, which is marketing the OrganoPlate. P.V., J.J., T.H. and S.J.T. are shareholders of that same company. OrganoPlate is a trademark of MIMETAS. A.R., S.K., and A.M. are employees of F. Hofmann-LaRoche Ltd and A.M. is a shareholder of F. Hofmann-LaRoche Ltd.

Figures

Fig. 1
Fig. 1
Overview of the method for modeling intestinal tubules in the OrganoPlate platform. a Photograph of the bottom of an OrganoPlate showing 40 microfluidic channel networks with inlay showing the top view of the 384-well plate format device; b Zoom-in on a single microfluidic channel network comprising three channels that join in the center. c, e, g, i Horizontal projection and d, f, h, j vertical cross section of center region for subsequent steps in establishing the gut model. c, d An extracellular matrix gel (light gray) is patterned by two phaseguides (dark gray), e, f culture medium is introduced in the two lanes adjacent to the ECM gel, one of which comprises cells. g, h Cells are allowed to settle against the ECM gel surface by placing the plate on its side. i, j Upon application of flow, cells form a confluent layer lining the channel and gel surfaces, resulting in a tubular shape. k 3D artist impression of the center of a chip comprising a tubule, an extra cellular matrix gel and a perfusion lane; two phaseguides (white bars) are present that define the three distinct lanes in the central channel. The tubule has a lumen at its apical side that is perfused. lp Phase-contrast images of the formation of the tubular structure at day 0, 1, 4, 7, and 11, respectively. Scale bars are 100 µm
Fig. 2
Fig. 2
Tubule characterization by immunofluorescent staining. a 3D reconstruction of a confocal z-stack showing tubular morphology with a lumen. White arrows indicate the apical (A) and basal (B) sides. The tube is stained for tight junctions (ZO-1 in red) and brush borders (ezrin in green). b Max projection and c vertical cross-section of the tubular structure in a; d, e zoom of the epithelial layer at the bottom of the tube exhibiting d tight junctions (ZO-1 in red) and brush borders (ezrin in green), and e acetylated tubulin (green) and occluding (red). f Phase-contrast image showing dome formation. g Zoom of a z-slice of the tube in a of the cell layer on top of the phaseguide showing apical positioning of ezrin, indicating polarization of the tube (white arrow indicates basal side B). h Expression of glucose and MRP2 transporters, respectively stained with Glut-2 in red and MRP2 stain in green. Both Glut-2 and MRP2 show significantly higher signal against the collagen gel compared to the regions that are not exposed to the collagen, indicating increased expression levels. Both stains clearly stain the apical side of the tube. For z-slices above the phaseguide at a higher magnification see Supplementary Fig. 2b. i ErbB1 (red) and acetylated tubulin (green) expression. ErbB1 expression levels appear higher against the collagen. j Co-staining of Glut-2 transporter and ErbB2 receptor; both stains show higher signal levels against the collagen gel. ErbB2 is primarily expressed pericellularly (see also Supplementary Fig. 2d for a zoom)). All tubes are fixed after 4 days in culture. Nuclei are stained blue with Draq5 (ac, gj) and DAPI (d, e). Scale bars in white are 100 µm with the exception of d, e, f, and g, where they are 50 µm. Z-slices just above the phaseguide at higher magnification of the images gj are available in Supplementary Fig. 2. All images are representative of at least three biological and at least three technical replicates
Fig. 3
Fig. 3
Barrier integrity assay in OrganoPlate. A fluorescent dye is inserted in the channel comprising the tube. Integrity of the tube barrier is quantified by measuring the amount of dye that is leaking out of the tube into the adjacent gel channel. ac Sketch in vertical cross section showing fluorescence distribution: a in absence of a tube, b for the case of a leak-tight tube and c for a leaky tube. di Fluorescent images of microfluidic chips perfused with fluorescent molecules show experimental results for: gel only (d, g), leak-tight tube (e, h), and leaky tube (fi) using both 150 kDa FITC-dextran and 4.4 kDa TRITC-Dextran during the same experiment
Fig. 4
Fig. 4
Drug-induced loss of barrier integrity is observed over time in a concentration-dependent manner. Results shown for staurosporine (a, b, eg) and aspirin (c, d, hj). ad Array of fluorescence micrographs of the gel region showing distribution of the 150 kDa FITC-Dextran (a, c), and 4.4 kDa TRITC-Dextran (b, d) over time and for various compound concentrations; the loss of barrier integrity results in an increased fluorescent signal. Measurements are taken at 1-h intervals up to 12 h, at 16 h, from 24 to 36 h at 1 h interval, and at 48, 53, 60, 72, 82, 96, and 125 h. In between each interval, the OrganoPlate was placed back into the incubator on the interval rocker platform to maintain the perfusion flow. Five technical replicates of each concentration of a compound were measured on a single plate. One well was excluded from further data analysis, because of a pipetting error (marked with “excl” in white). e, h The progression of the loss of barrier function over time is plotted as the ratio between fluorescent signal in apical and basal regions for the various concentrations of staurosporine (e) and aspirin (h), where the plotted line is the mean of five replicate exposures and error bars depict the standard deviation. f, i Kaplan–Meier curves were generated where survival was defined as showing a leakage score below 40%. Overlapping curves were shifted by 1% for clarity purposes. g, j EC50 values are plotted as a function of exposure time. EC50 values were obtained by fitting a concentration-response curve at each time point based on non-linear regression of leakage scores using normalized response and standard slope and were plotted including 95% confidence interval (CI). EC50 values obtained from time points before the first event in the Kaplan–Meier plot, as indicated by a grayed out line, should be interpreted with caution as the curve fit could be dominated by noise rather than biological effect. All shown graphs were derived from data acquired using 150 kDa FITC dextran. Technical replicates are defined as tubes seeded on the same plate and exposed in the same experimental session. Independent full replicate series were run for both staurosporine and aspirin that are displayed in Supplementary Figs. 3 and 4
Fig. 5
Fig. 5
Drug-induced loss of barrier integrity as a function of staurosporine concentration measured in real-time. a, b Array of fluorescence micrographs of the gel region showing distribution of the 150 kDa FITC-Dextran (a) and 4.4 kDa TRITC-Dextran (b) over time and as a function of compound concentration; the OrganoPlate was continuously kept in an incubated automated microscope. Pictures were taken at 1 h intervals. One data point was excluded for the fact that the tube appeared leaky at the first time point (marked with “excl” in white). c The progression of the loss of barrier function over time shows that untreated controls lose barrier integrity at 6–8 h due to lack of flow. The plotted line is the mean of 3–5 technical replicate exposures and error bars depict the standard deviation. d EC50 values over time for real-time measurement without flow and for measurement in intervals with flow induced between measurement (overlay with the graph of Fig. 4g). EC50 values with and without flow are similar for the initial 8 h of measurement

References

    1. Pampaloni F, Reynaud EG, Stelzer EHK. The third dimension bridges the gap between cell culture and live tissue. Nat. Rev. Mol. Cell. Biol. 2007;8:839–845. doi: 10.1038/nrm2236. - DOI - PubMed
    1. Weaver VM, et al. Reversion of the malignant phenotype of human breast cells in three-dimensional culture and in vivo by integrin blocking antibodies. J. Cell. Biol. 1997;137:231–245. doi: 10.1083/jcb.137.1.231. - DOI - PMC - PubMed
    1. van Duinen V, Trietsch SJ, Joore J, Vulto P, Hankemeier T. Microfluidic 3D cell culture: from tools to tissue models. Curr. Opin. Biotechnol. 2015;35:118–126. doi: 10.1016/j.copbio.2015.05.002. - DOI - PubMed
    1. Tibbitt MW, Anseth KS. Hydrogels as extracellular matrix mimics for 3D cell culture. Biotechnol. Bioeng. 2009;103:655–663. doi: 10.1002/bit.22361. - DOI - PMC - PubMed
    1. Huh D, Hamilton GA, Ingber DE. From 3D cell culture to organs-on-chips. Trends. Cell. Biol. 2011;21:745–754. doi: 10.1016/j.tcb.2011.09.005. - DOI - PMC - PubMed

Publication types

MeSH terms