. 2017 Aug 15;7(1):8136.
doi: 10.1038/s41598-017-08225-1.

The lichen secondary metabolite atranorin suppresses lung cancer cell motility and tumorigenesis

Affiliations

The lichen secondary metabolite atranorin suppresses lung cancer cell motility and tumorigenesis

Rui Zhou et al. Sci Rep. .

Erratum in

Abstract

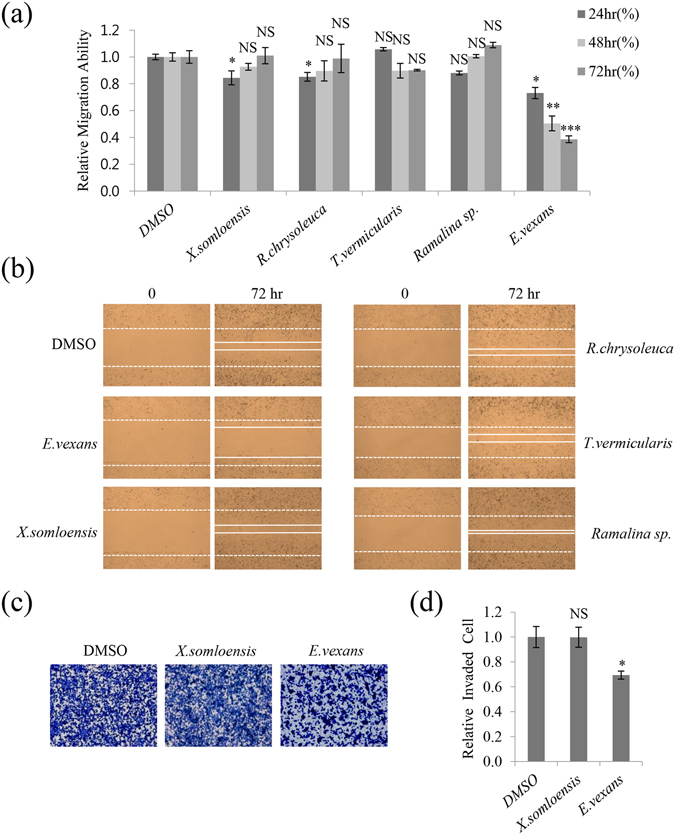
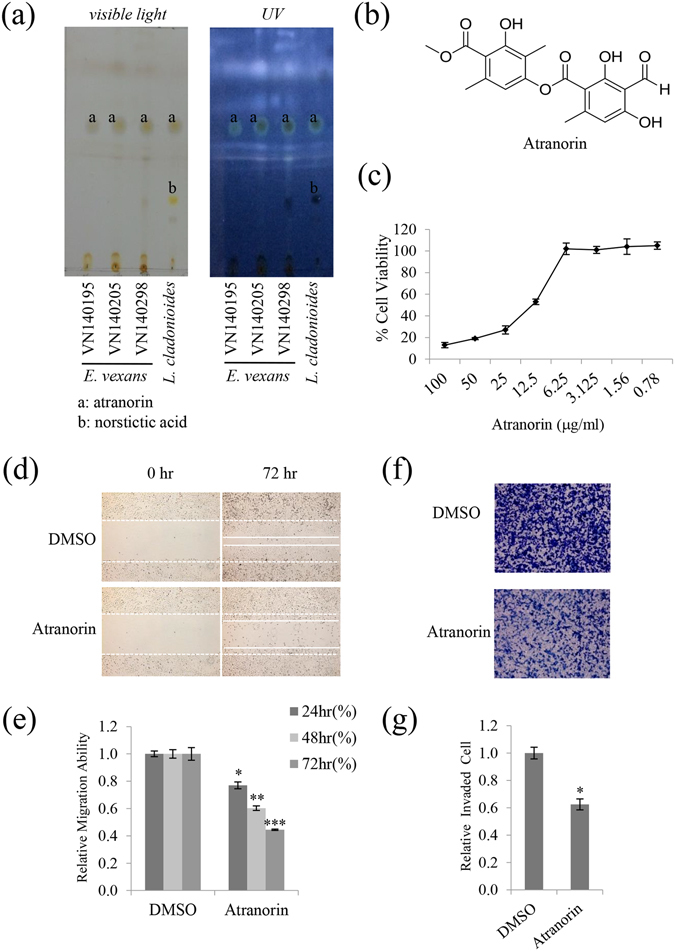
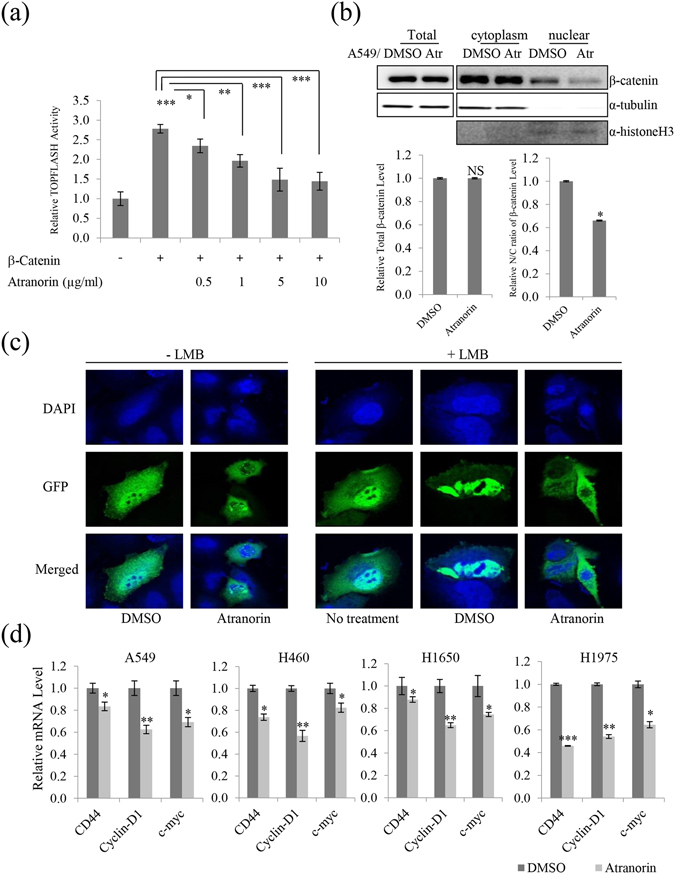
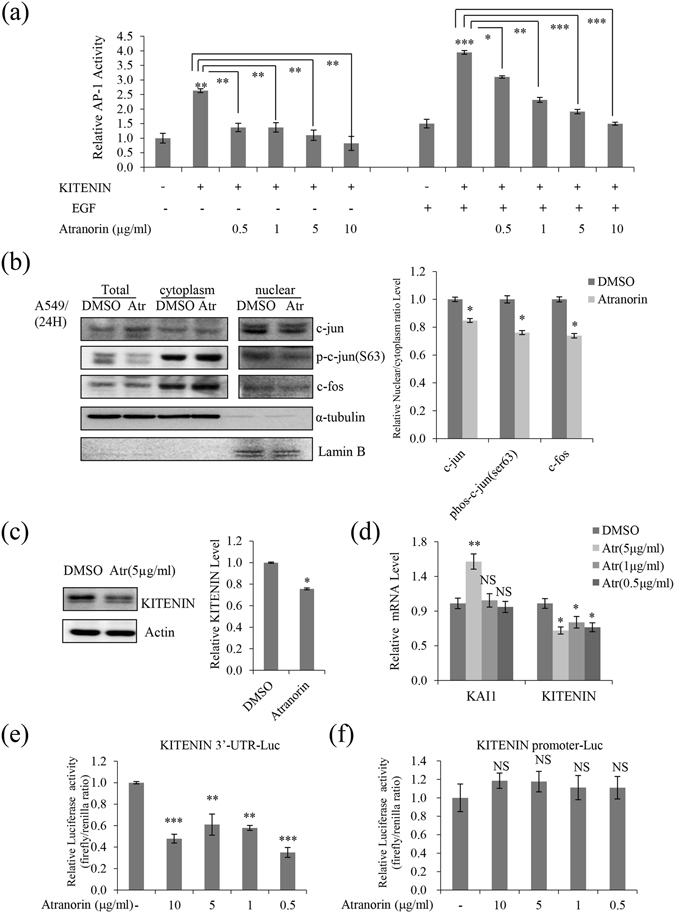
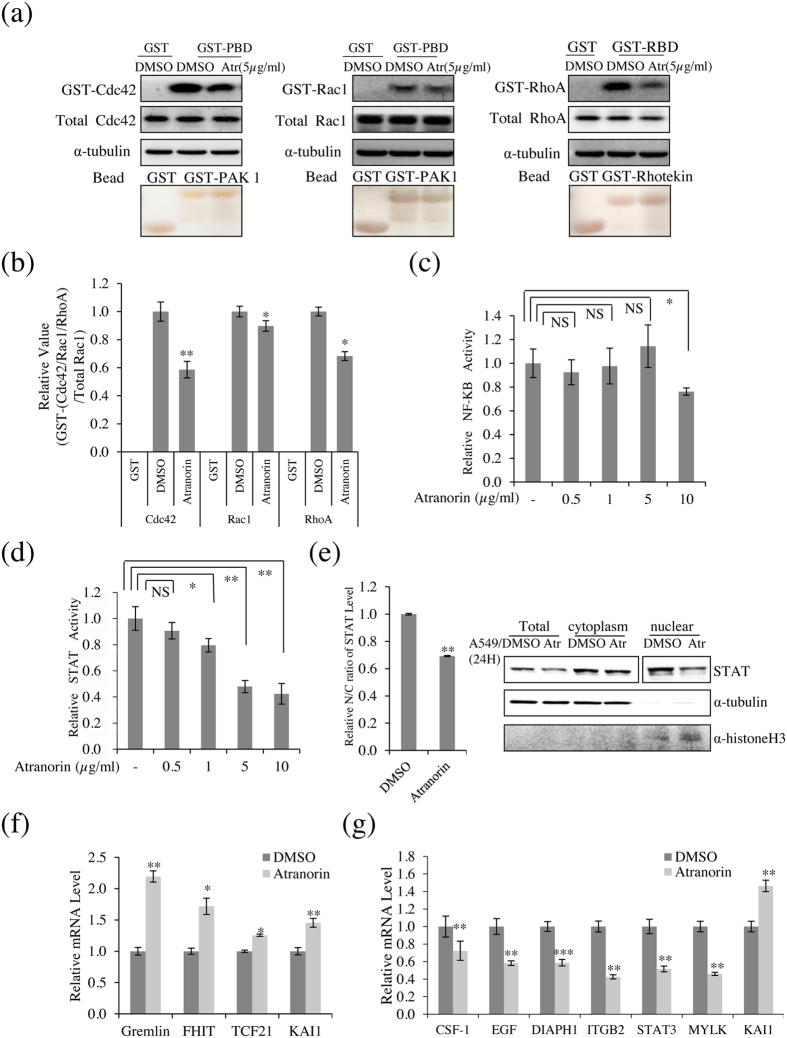
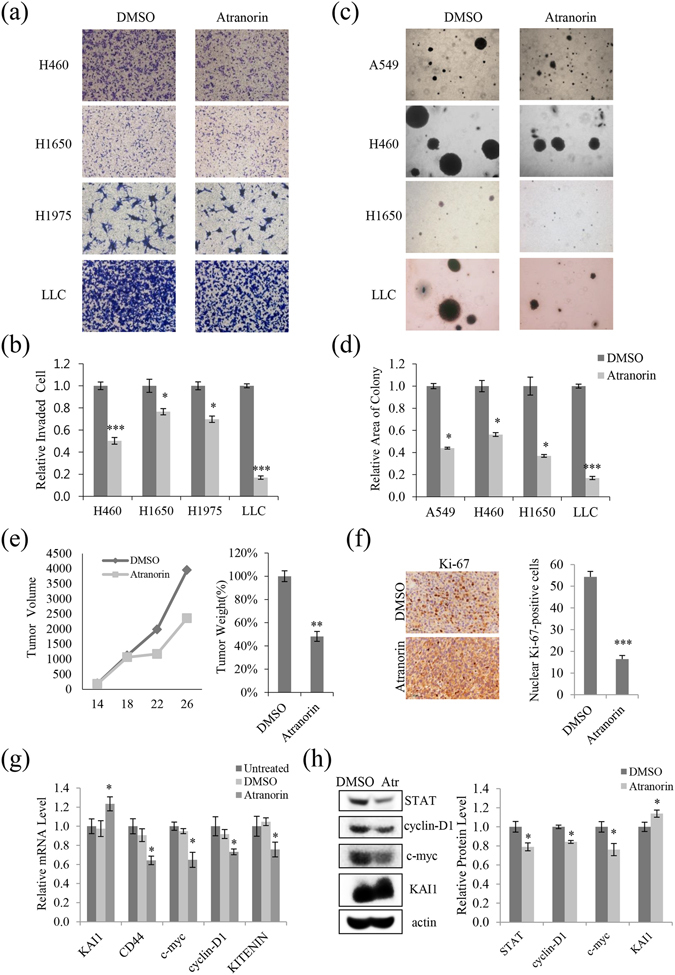
Lichens are symbiotic organisms that produce various secondary metabolites. Here, different lichen extracts were examined to identify secondary metabolites with anti-migratory activity against human lung cancer cells. Everniastrum vexans had the most potent inhibitory activity, and atranorin was identified as an active subcomponent of this extract. Atranorin suppressed β-catenin-mediated TOPFLASH activity by inhibiting the nuclear import of β-catenin and downregulating β-catenin/LEF and c-jun/AP-1 downstream target genes such as CD44, cyclin-D1 and c-myc. Atranorin decreased KAI1 C-terminal interacting tetraspanin (KITENIN)-mediated AP-1 activity and the activity of the KITENIN 3'-untranslated region. The nuclear distribution of the AP-1 transcriptional factor, including c-jun and c-fos, was suppressed in atranorin-treated cells, and atranorin inhibited the activity of Rho GTPases including Rac1, Cdc42, and RhoA, whereas it had no effect on epithelial-mesenchymal transition markers. STAT-luciferase activity and nuclear STAT levels were decreased, whereas total STAT levels were moderately reduced. The human cell motility and lung cancer RT² Profiler PCR Arrays identified additional atranorin target genes. Atranorin significantly inhibited tumorigenesis in vitro and in vivo. Taken together, our results indicated that E. vexans and its subcomponent atranorin may inhibit lung cancer cell motility and tumorigenesis by affecting AP-1, Wnt, and STAT signaling and suppressing RhoGTPase activity.


Conflict of interest statement

The authors declare that they have no competing interests.

Figures

Figure 1
Figure 1
Lichen crude extracts inhibited A549 cell migration and invasion. (a,b) Quantitative analysis and representative images of migration assays in A549 cells treated with 10 μg/mL acetone extracts of Xanthoparmelia somloensis, Rhizoplaca chrysoleuca, Thamnolia vermicularis, Ramalina sp., and Everniastrum vexans. (c,d) Invasion assays in A549 cells treated with 10 μg/mL acetone extracts of X. somloensis and E. vexans, and quantitative analysis of invaded cell numbers in each group. Representative images from three independent experiments are shown (n = 3). Data represent the mean ± S.E.M. *p < 0.05; **p < 0.01; ***p < 0.001; NS, no significant difference compared with dimethylsulfoxide (DMSO)-treated A549 cells.
Figure 2
Figure 2
Atranorin was identified as an active secondary metabolite from E. vexans with inhibitory activity against A549 cell motility. (a) TLC analysis performed using a Toluene: Dioxin: Acetic acid = 180: 45: 5 (v/v/v) solvent system showed that lichen extracts had inhibitory activity against A549 cell motility; ‘a’ denotes the location of the spot for atranorin. L. cladonioides was used as the standard control for atranorin; it contained atranorin (spot ‘a’) and norstictic acid (spot ‘b’). (b) Chemical structure of atranorin. (c) MTT assay in A549 cells treated with atranorin at different doses. (d,e) Migration assay in A549 cells treated with 5 μg/mL atranorin, and quantitative analysis of wound length. (f,g) Invasion assays in A549 cells treated with 5 μg/mL atranorin and quantitative analysis of invaded cell numbers in each treatment. Quantitative data were obtained from three independent experiments (n = 3). Data represent the mean ± S.E.M. *p < 0.05; **p < 0.01; ***p < 0.001 compared with DMSO-treated A549 cells.
Figure 3
Figure 3
Atranorin inhibited β-catenin-mediated TOPFLASH activity by suppressing nuclear import and downregulated β-catenin/LEF and c-jun/AP-1 downstream genes. (a) Atranorin decreased the β-catenin-mediated transcriptional activity of the TOPFLASH promoter. HEK293T cells were transfected with β-catenin and the TOPFLASH reporter plasmid. After 12 h of transfection, cells were treated with atranorin for 48 h. (b) Decreased β-catenin nuclear localization upon atranorin treatment. The total, nuclear, and cytoplasmic levels of β-catenin were analyzed in A549 cells. α-Histone H3 was used as a nuclear marker. Quantitative analysis of the ratio of nuclear to cytoplasmic β-catenin in A549 cells treated with 5 μg/mL atranorin. (c) A549 cells were transiently transfected with GFP-β-catenin for 12 h. Cells were visualized using a fluorescence confocal microscope after DMSO or atranorin treatment for 24 h (left). Treatment with leptomycin B (LMB, a nuclear export inhibitor) alone induced a significant accumulation of nuclear β-catenin at 4 h (central). Treatment with DMSO resulted in significant retention of nuclear β-catenin for 24 h after 4 h of pretreatment with LMB, whereas the accumulation was not observed after treatment with atranorin (right). DAPI was used for visualization of the nucleus. (d) Quantitative analysis of the mRNA level of CD44, c-myc, and cyclin-D1 in A549, H460, H1650, and H1975 cells treated with 5 μg/mL atranorin. Data represent the mean ± S.E.M. (n = 3). *p < 0.05; **p < 0.01; ***p < 0.001 compared with the DMSO-treated group in each cell line.
Figure 4
Figure 4
Atranorin suppressed KITENIN-mediated AP-1 activity, affected the expression of KAI1 and KITENIN, and downregulated c-jun and c-fos. (a) Atranorin inhibited the KITENIN-mediated transcriptional activity of the AP-1 promoter. After 12 h of transfection with KITENIN and the AP-1 reporter plasmid, cells were treated with atranorin for 48 h in the presence or absence of EGF. (b) Western blot analysis of total, cytoplasmic, and nuclear c-jun, phospho-c-jun (ser63), and c-fos in A549 cells. (c) Western blot analysis of KITENIN in A549 cells treated with 5 μg/mL atranorin. (d) Quantitative analysis of the mRNA level of KITENIN and KAI1 in A549 cells treated with different concentrations of atranorin. (e,f) KITENIN 3′-UTR (e) and promoter (f) luciferase assays in HEK293T cells treated with atranorin. Quantitative data were obtained from at least two independent experiments. Data represent the mean ± S.E.M. (n = 3). *p < 0.05; **p < 0.01; ***p < 0.001; NS, no significant difference compared with the DMSO-treated group in each cell line.
Figure 5
Figure 5
Atranorin reduced RhoGTPase activity and affected the expression of cell motility and lung cancer-related genes. (a) The levels of GTP-bound Cdc42, Rac1, and RhoA were measured in A549 cells treated with 5 μg/mL atranorin. GTP-Rac1 and -Cdc42 were measured using GST-PBD, and GTP-RhoA was measured using GST-RBD. The total amounts of RhoA, Rac1, and Cdc42 are also shown. (b) The relative activities of Cdc42, Rac1, and RhoA were measured as described in Materials and Methods. (c) NF-κB luciferase assay of HEK293T cells treated with 5 μg/mL atranorin. (d) STAT-transfected HEK293T cells showed a dose-dependent decrease in luciferase activity. (e) Western blot analysis of total, cytoplasmic, and nuclear STAT. (f) Quantitative analysis of the mRNA levels of Gremlin, FHIT, TCF21, and KAI1 in A549 cells treated with 5 μg/mL atranorin. (g) Quantitative analysis of the mRNA levels of CSF1, EGF, DIAPH1, ITGB2, STAT3, MYLK, and KAI1 in A549 cells treated with 5 μg/mL atranorin. KAI1 levels were measured as a positive control for atranorin activity. The data represent the mean ± S.E.M. (n = 3). *p < 0.05; **p < 0.01; ***p < 0.001; NS, no significant difference compared with DMSO-treated A549/HEK293T cells.
Figure 6
Figure 6
Atranorin inhibited invasion and suppressed tumor growth in vitro and in vivo in different lung cancer cell lines. (a,b) Invasion assays in H460, H1650, H1975, and LLC cells treated with 5 μg/mL atranorin, and quantitative analysis of invaded cell numbers in each cell line. (c,d) Soft agar colony-formation assays in A549, H460, H1650, and LLC cells treated with atranorin (5 μg/mL) and quantitative analysis of colony areas in each group. (e) LLC cells were inoculated subcutaneously into C57BL/6 mice (n = 5 per group) at 2 × 106 cells per mouse. On day 12 of treatment, tumor volume at different time points and tumor weight were measured (p < 0.005). (f) Immunohistochemistry of tumor tissue sections using a Ki-67 antibody displayed nuclear Ki-67 immunoreactivity, a marker of cell proliferation. (g,h) Mouse tissue lysates were analyzed for the expression of KAI1, CD44, c-myc, cyclin-D1, and KITENIN by qRT-PCR (g) or for the expression of STAT, cyclin-D1, c-myc, and KAI by Western blot (h). Representative images are shown from three independent experiments (n = 3). Data represent the mean ± S.E.M. *p < 0.05; **p < 0.01; ***p < 0.001 compared with untreated or DMSO-treated cells.

References

    1. Ramalingam SS, Owonikoko TK, Khuri FR. Lung cancer: new biological insights and recent therapeutic advances. CA: a cancer journal for clinicians. 2011;61:91–112. - PubMed
    1. Olson MF, Sahai E. The actin cytoskeleton in cancer cell motility. Clinical & experimental metastasis. 2009;26:273–287. doi: 10.1007/s10585-008-9174-2. - DOI - PubMed
    1. Steeg PS. Metastasis suppressors alter the signal transduction of cancer cells. Nature Reviews Cancer. 2003;3:55–63. doi: 10.1038/nrc967. - DOI - PubMed
    1. Nash III, T. H. Lichen sensitivity to air pollution. Lichen biology2 (2008).
    1. Elix J, Stocker-Wörgötter E. Biochemistry and secondary metabolites. Lichen biology. 1996;1:154–180.

Publication types

MeSH terms