

Deregulation of transcription factors controlling intestinal epithelial cell differentiation; a predisposing factor for reduced enteroendocrine cell number in morbidly obese individuals
- PMID: 28811552
- PMCID: PMC5557953
- DOI: 10.1038/s41598-017-08487-9
Deregulation of transcription factors controlling intestinal epithelial cell differentiation; a predisposing factor for reduced enteroendocrine cell number in morbidly obese individuals
Abstract
Morbidly obese patients exhibit impaired secretion of gut hormones that may contribute to the development of obesity. After bariatric surgery there is a dramatic increase in gut hormone release. In this study, gastric and duodenal tissues were endoscopically collected from lean, and morbidly obese subjects before and 3 months after laparoscopic sleeve gastrectomy (LSG). Tissue morphology, abundance of chromogranin A, gut hormones, α-defensin, mucin 2, Na+/glucose co-transporter 1 (SGLT1) and transcription factors, Hes1, HATH1, NeuroD1, and Ngn3, were determined. In obese patients, the total number of enteroendocrine cells (EEC) and EECs containing gut hormones were significantly reduced in the stomach and duodenum, compared to lean, and returned to normality post-LSG. No changes in villus height/crypt depth were observed. A significant increase in mucin 2 and SGLT1 expression was detected in the obese duodenum. Expression levels of transcription factors required for differentiation of absorptive and secretory cell lineages were altered. We propose that in obesity, there is deregulation in differentiation of intestinal epithelial cell lineages that may influence the levels of released gut hormones. Post-LSG cellular differentiation profile is restored. An understanding of molecular mechanisms controlling epithelial cell differentiation in the obese intestine assists in the development of non-invasive therapeutic strategies.
Conflict of interest statement
The authors declare that they have no competing interests.
Figures
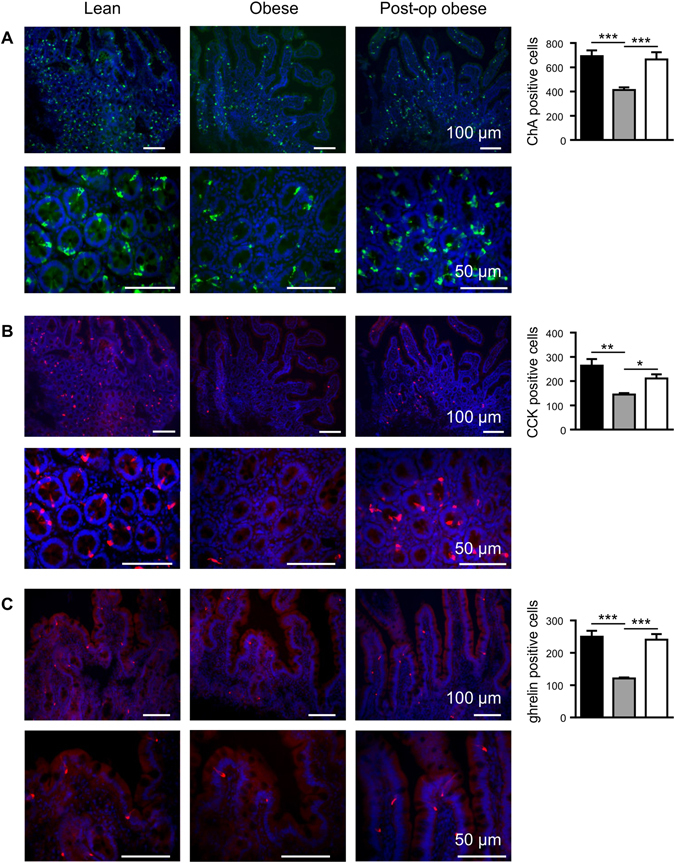
 ) and post-operative obese, (□) by immunohistochemistry. Bar charts (on the right) show number of cells counted expressing ChA or gut hormones. Statistical significance was determined by a One-way ANOVA with differences between means identified using a Holm-Sidak multiple comparison post-test where, *p < 0.05, **p < 0.01 and ***p < 0.001. Scale bars are either 100 or 50 µm. Nuclei are stained blue with 4′,6-diamidino-2-phenylindole (Dapi).
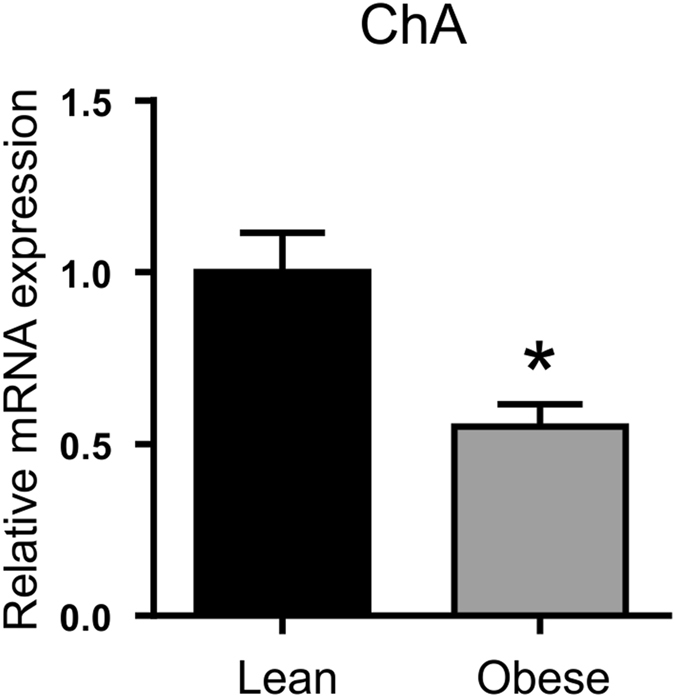 ) duodenum for ChA (enteroendocrine cell marker) determined by qPCR. Values are means ± SEM, normalised to RNA polymerase IIA (POLR2A) m RNA expression, n = 4. Statistical significance was determined by a Student’s t-test where *p < 0.05.
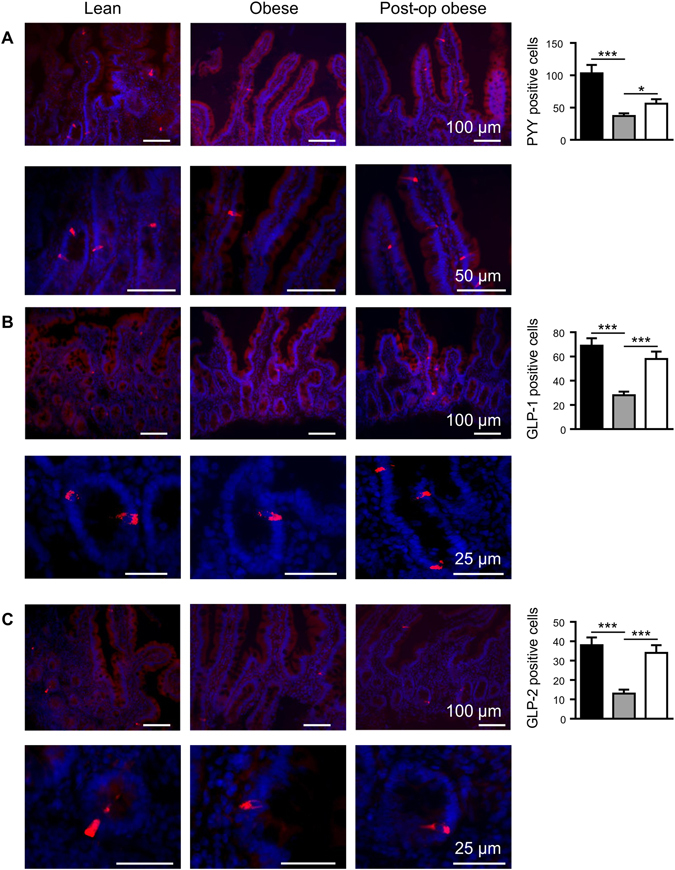 ) and post-operative obese, (□) by immunohistochemistry. Bar charts (on the right) show number of cells counted expressing the gut hormones. Statistical significance was determined by a One-way ANOVA with differences between means identified using a Holm-Sidak multiple comparison post-test test where *p < 0.05, ***p < 0.001. Scale bars are either 100, 50 or 25 µm. Nuclei are stained blue with 4′,6-diamidino-2-phenylindole (Dapi).
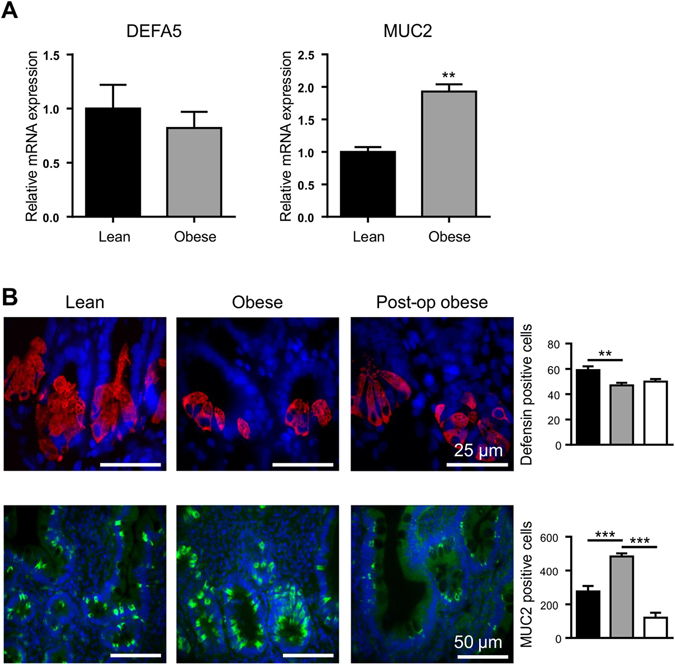 ) duodenum for DEFA5 (Paneth cell marker) and MUC2 (goblet cell marker) determined by qPCR. Values are means ± SEM, normalised to RNA polymerase IIA (POLR2A) m RNA expression, n = 4. (B) Profile of defensin 5 (DEFA5; red) and mucin 2 (MUC2; green) determined in lean (■), obese () and post-operative obese, (□) duodenum by immunohistochemistry. Bar charts (on the right) show total number of cells counted expressing either DEFA5 or MUC2. Statistical significance was determined by a Student’s t-test (A) or One-way ANOVA with differences between means identified using Tukey’s multiple comparison post-test (B) where **p < 0.01; ***p < 0.001. Scale bars are 25 µm. Nuclei are stained blue with 4′,6-diamidino-2-phenylindole (Dapi).
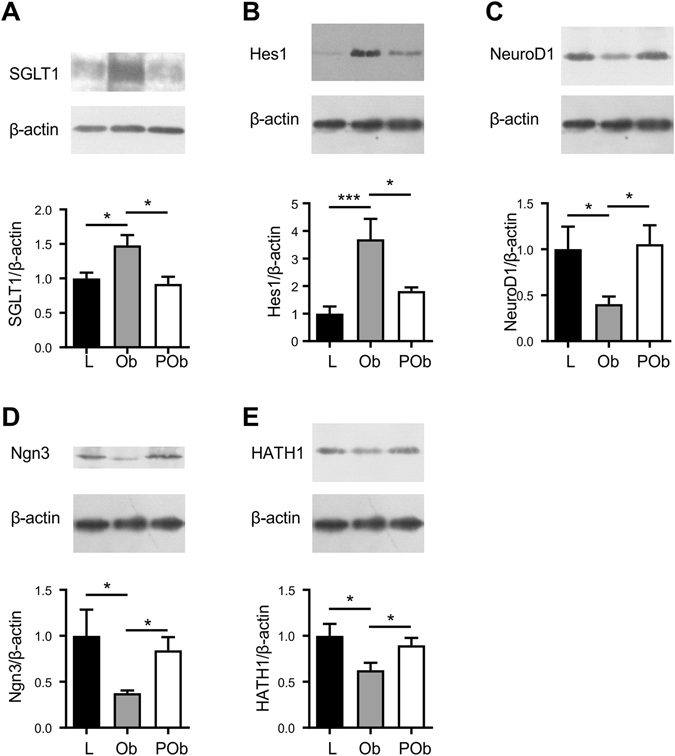 ) and post-operative obese, (POb) (□) individuals. Results are shown as mean ± SEM; n = 7–10. Statistically significant results determined using a One-way ANOVA with differences between means identified using a Holm-Sidak multiple comparison post-test where *P < 0.05 and ***P < 0.001. For clarity, boxed western blot images are displayed. Full length blots are shown in Supplementary Figure S4.
References
Publication types
MeSH terms
Substances
LinkOut - more resources
Full Text Sources
Other Literature Sources
Research Materials
