. 2017 Aug 15;8(1):255.
doi: 10.1038/s41467-017-00151-0.

Transcriptional response to stress is pre-wired by promoter and enhancer architecture

Affiliations

Transcriptional response to stress is pre-wired by promoter and enhancer architecture

Anniina Vihervaara et al. Nat Commun. .

Abstract

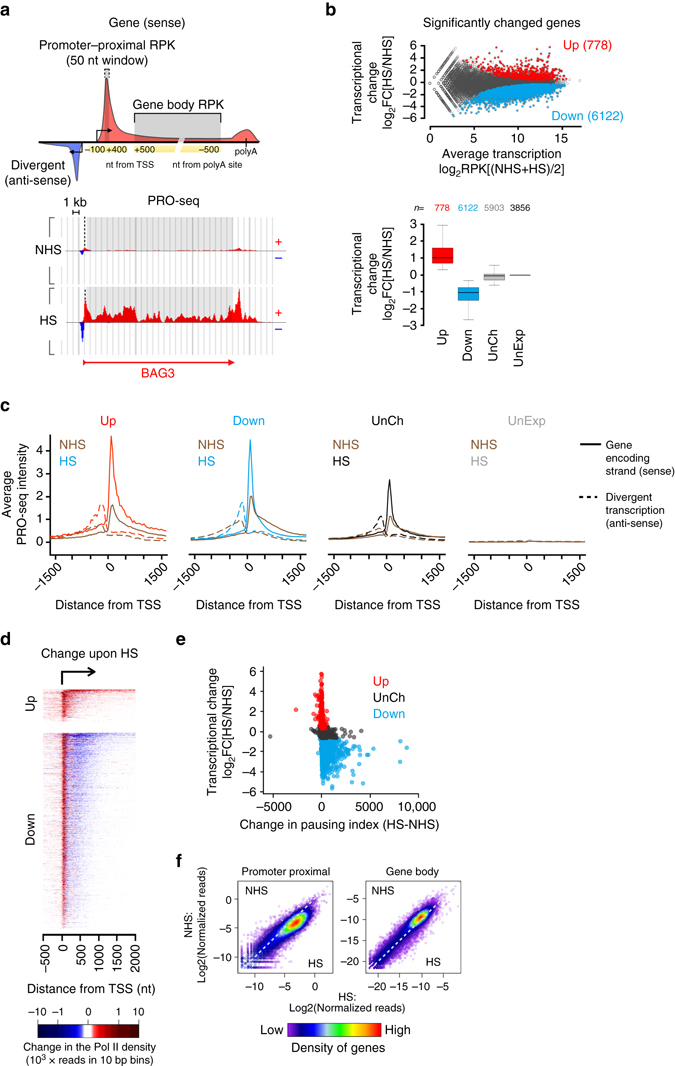
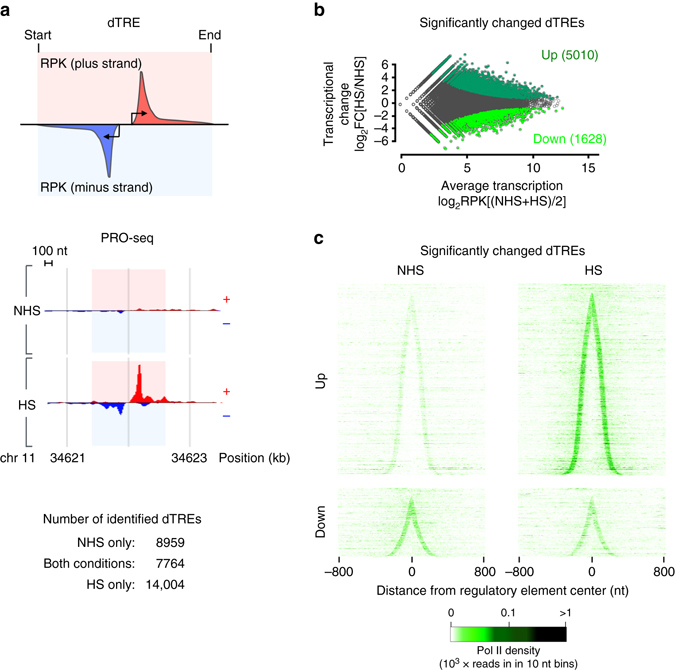
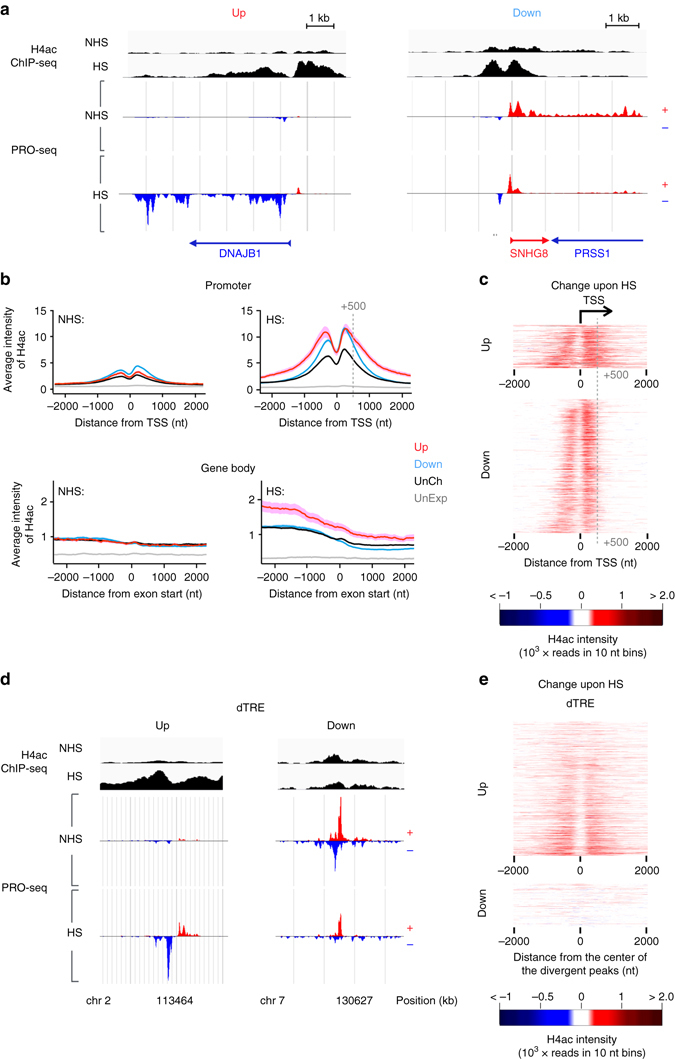
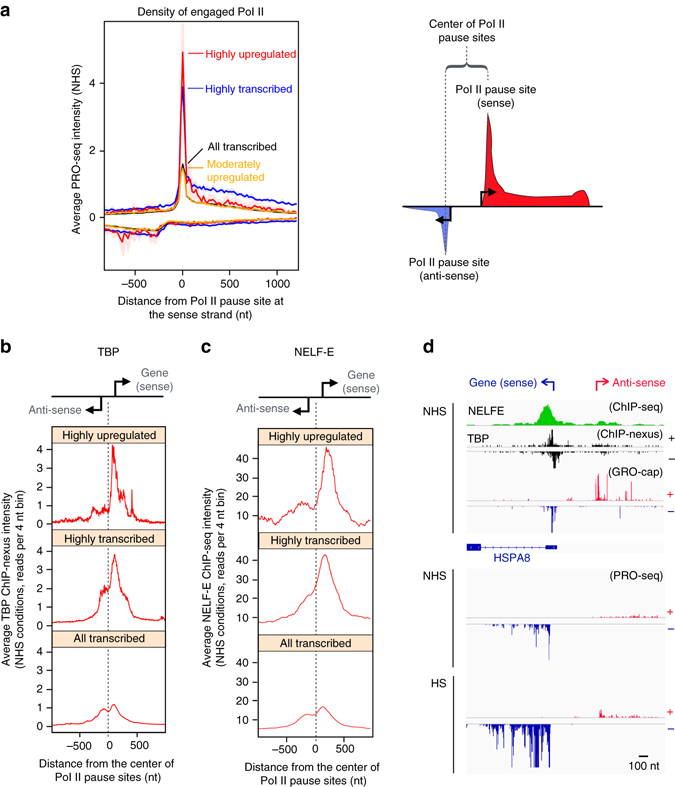
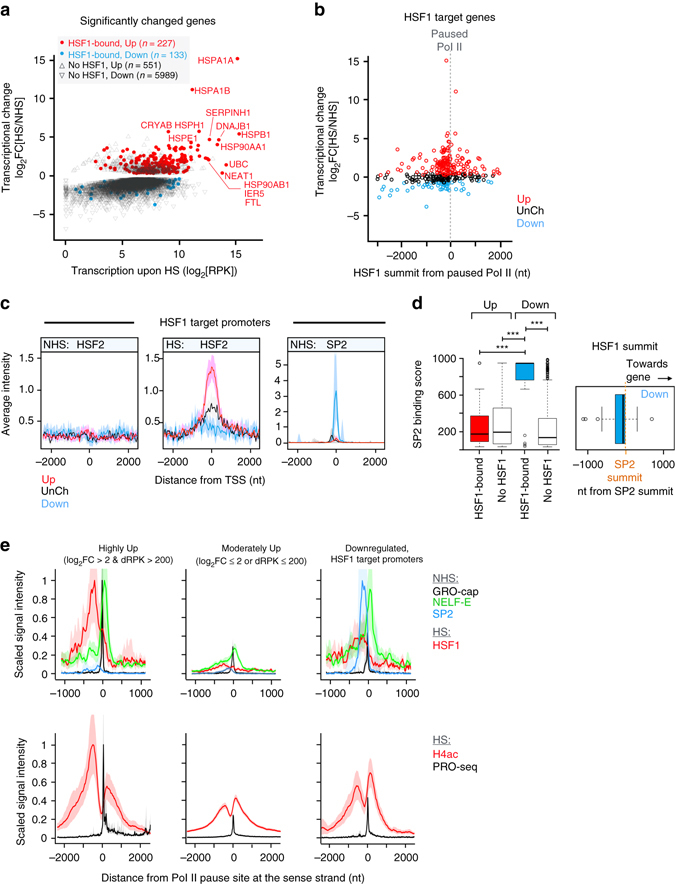
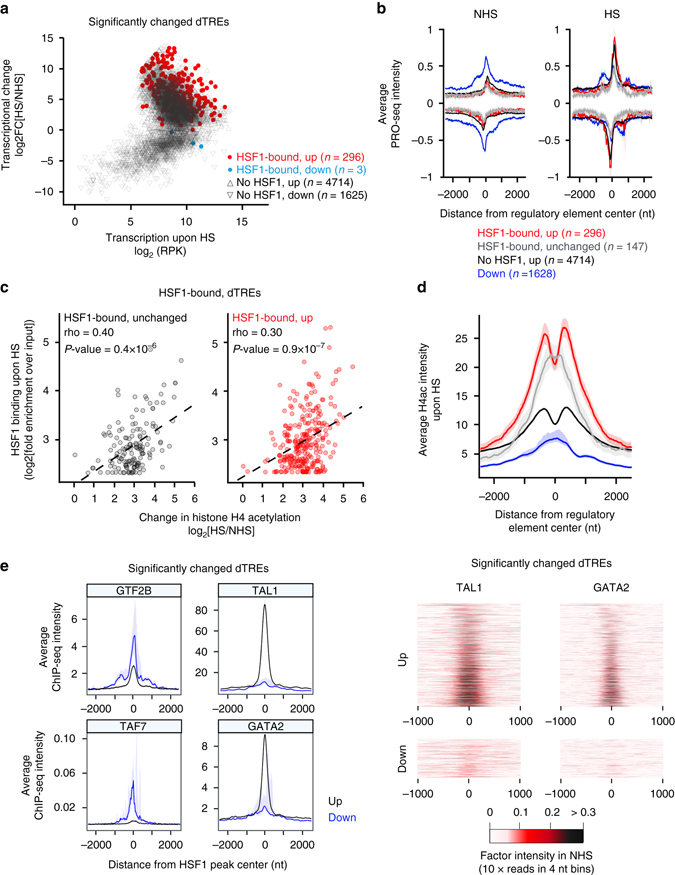
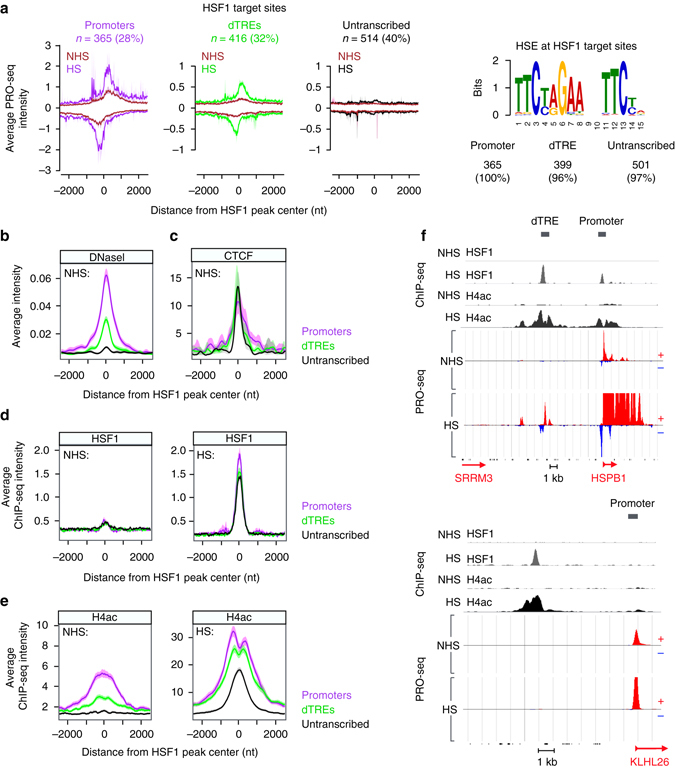
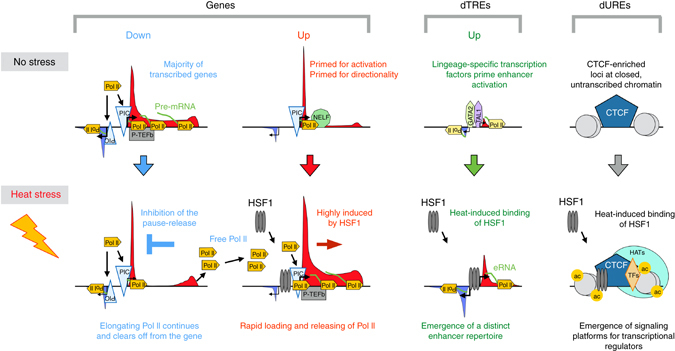
Programs of gene expression are executed by a battery of transcription factors that coordinate divergent transcription from a pair of tightly linked core initiation regions of promoters and enhancers. Here, to investigate how divergent transcription is reprogrammed upon stress, we measured nascent RNA synthesis at nucleotide-resolution, and profiled histone H4 acetylation in human cells. Our results globally show that the release of promoter-proximal paused RNA polymerase into elongation functions as a critical switch at which a gene's response to stress is determined. Highly transcribed and highly inducible genes display strong transcriptional directionality and selective assembly of general transcription factors on the core sense promoter. Heat-induced transcription at enhancers, instead, correlates with prior binding of cell-type, sequence-specific transcription factors. Activated Heat Shock Factor 1 (HSF1) binds to transcription-primed promoters and enhancers, and CTCF-occupied, non-transcribed chromatin. These results reveal chromatin architectural features that orient transcription at divergent regulatory elements and prime transcriptional responses genome-wide.Heat Shock Factor 1 (HSF1) is a regulator of stress-induced transcription. Here, the authors investigate changes to transcription and chromatin organization upon stress and find that activated HSF1 binds to transcription-primed promoters and enhancers, and to CTCF occupied, untranscribed chromatin.


Conflict of interest statement

The authors declare no competing financial interests.

Figures

Fig. 1
Fig. 1
Rapid transcriptional reprogramming of genes is defined at the step of promoter-proximal pause-release. a Schematic representation (upper panel) of promoter-proximal region (−100 to +400 nt from TSS) from which the Pol II pause site was scored as a 50-nt window, and gene body (+500 nt from TSS to −500 nt from polyA site) from which the average Pol II density across the coding region was measured. Divergent transcription is depicted upstream of the gene, and the transcription initiation sites towards the sense and anti-sense are indicated with arrows. The lower panel illustrates the strand-specific scanning of Pol II density at promoter–proximal (dashed line) and gene body (grey box) regions at BAG3 gene prior to (NHS) and upon (HS) heat shock. b MA-plot (upper panel) showing the heat-induced transcriptional change at the coding regions of individual genes. Genes with significantly upregulated (Up) or downregulated (Down) transcription upon HS are colored red and blue, respectively. The lower panel indicates the number and transcriptional change of genes that were significantly upregulated, downregulated or remained unchanged (UnCh) upon acute heat stress, or that were not transcribed (UnExp) prior to or upon HS in human K562 cells. c Strand-specific average intensity of transcriptionally engaged Pol II at the TSS of upregulated (Up), downregulated (Down), unchanged (UnCh) and unexpressed (UnExp) genes. Coding strand is indicated with solid, divergent strand with dashed line. d Heatmap depicting the change in the Pol II density at the coding strand of significantly changed genes upon acute stress. e The change in the pausing index at individual upregulated, downregulated and unchanged genes. f Comparison of PRO-seq reads prior to (NHS) and upon heat shock (HS) at promoter-proximal and gene body regions of each gene. The density of genes in the scatter plot is indicated with the color scale
Fig. 2
Fig. 2
Immediate emergence of a stress-specific repertoire of active regulatory elements. a Schematic representation (upper panel) and a browser shot example (lower panel) of a transcribed distal regulatory element (dTRE) showing the characteristic pattern of short divergent transcription. The strand-specific measurement of Pol II density along the length of the dTRE is indicated with the red (plus strand) and blue (minus strand) boxes. The numbers of dTREs in K562 cells that occur prior to (NHS), upon acute heat shock (HS), or in both conditions are shown. b MA-plot showing dTREs with significantly up- or downregulated Pol II density across the length of the regulatory element. c Density of transcriptionally engaged Pol II at individual up- or downregulated dTREs. The dTREs are sorted by the increasing distance between the Pol II pause sites at the sense and the anti-sense strands, and the signal is centered to the middle coordinate between the pause sites
Fig. 3
Fig. 3
The state of histone H4 acetylation changes in cells exposed to acute stress. a Genome browser images of heat-induced (DNAJB1) and heat-repressed (SNHG8) genes, showing the histone H4 acetylation (black) and transcription from plus (red) and minus (blue) strands prior to (NHS) and upon (HS) heat stress. b Average ChIP-seq intensity of histone H4 acetylation at promoters (upper panels) and gene bodies (lower panels) of genes grouped by their transcriptional response. c The change in histone H4 acetylation upon stress at individual promoters of up- and downregulated genes. The grey dashed line in (b, c) marks the +500 nt position from TSS. d Genome browser images of histone H4 acetylation at dTREs with upregulated (left) and downregulated (right) Pol II density upon stress. e The change in histone H4 acetylation upon stress at individual up- or downregulated dTREs
Fig. 4
Fig. 4
Directionality and rapid transcriptional induction is pre-wired in the promoter architecture. a PRO-seq profile of highly upregulated, highly transcribed, moderately upregulated and all transcribed genes, centered on the Pol II pause site at the coding strand. The intensity of transcriptionally engaged Pol II at the coding strand is indicated above the value zero, respective intensity at the non-coding strand is depicted with negative values. The right panel schematically depicts the Pol II profile at divergent regulatory elements, indicating TSSs to sense and anti-sense directions with arrows, Pol II pause sites at sense and anti-sense strands with dotted lines, and the mid coordinate between the Pol II pause sites with a bracket. b, c Average intensity of (b) TBP ChIP-nexus and (c) NELF-E ChIP-seq at highly upregulated, highly transcribed and all transcribed genes. The corresponding heatmaps are shown in Supplementary Fig. 4c. d Browser shot of HSPA8 gene indicating the positioning of NELF-E and TBP with respect to the GRO-cap mapping of transcription start sites at the sense and the anti-sense strands, and the PRO-seq profile of transcriptionally engaged Pol II prior to (NHS) and upon (HS) heat stress. ChIP-nexus data set for TBP was obtained from He et al., ChIP-seq for NELF-E is from the ENCODE, and GRO-cap from Core et al.
Fig. 5
Fig. 5
Local chromatin architecture is permissive or restrictive for HSF1-mediated trans-activation. a Transcriptional change of up and downregulated genes, plotted against the transcriptional level upon stress. The HSF1-bound upregulated genes are indicated with red, the HSF1-bound downregulated genes with blue closed circles. b Localization of HSF1 summit point from the Pol II pause site at the coding strand, plotted against the gene’s transcriptional change upon heat shock. c The average occupancy of HSF2 and SP2 at HSF1 target promoters. d Left panel: ENCODE binding score (proportional number between 0–1000; https://genome.ucsc.edu/FAQ/FAQformat.html#format12) of SP2 at the HSF1-bound and HSF1-unbound upregulated (Up) and downregulated (Down) genes. Significant P-values (Mann–Whitney U-test) are shown; the three asterisks indicating values lower than 0.0005. The position of HSF1 peak summit from the peak summit of SP2 is depicted with respect to the directionality of the divergent promoter (right panel). e Scaled ChIP-seq, PRO-seq and GRO-cap intensities at indicated gene groups. The highest average signal intensity for each factor in any bin across the gene groups is used as normalization constant, bringing the maximum signal to value 1. ChIP-seq data sets for NELF-E and SP2 were obtained from the ENCODE, GRO-cap is from Core et al.
Fig. 6
Fig. 6
Lineage-specific transcription factors prime enhancers for transcriptional induction. a Transcriptional change of significantly changed dTREs plotted as function of transcription level upon stress. The HSF1-bound upregulated dTREs are indicated with red, the HSF1-bound downregulated dTREs with blue closed circles. The numbers of HSF1-targeted or un-targeted dTREs are indicated. b PRO-seq profile of indicated dTREs in NHS and HS conditions. c HSF1 binding intensity as the function of heat-induced change in the histone H4 acetylation at individual dTREs. The coefficients (rho) and P-values are according to Spearman’s rank correlation. The correlation lines are fitted for linear regression. d Average histone H4 acetylation at indicated dTREs upon HS. e Left panels: Average ChIP-seq intensity of GTF2B, TAF7, TAL1 and GATA2 at up- and downregulated dTREs. Right panels show heatmaps of TAL1 and GATA2 at up- and downregulated dTREs. ChIP-seq data sets for GTF2B, TAF7, GATA2 and TAL1 are from the ENCODE
Fig. 7
Fig. 7
HSF1 binds to regions that are devoid of initiating Pol II but gain hyper-acetylation at histone H4 upon stress. a Left panels: Average Pol II density at the HSF1-bound promoters, dTREs and untranscribed genomic regions. N indicates the number, and percentage the share, of HSF1 target sites in respective category. The right panel shows the number and percentage of HSF1 target sites that contain a MEME-ChIP identified HSE (Supplementary Methods). be Average intensities of (b) DNaseI sensitivity, (c) CTCF ChIP-seq, (d) HSF1 ChIP-seq and (e) histone H4 acetylation ChIP-seq at HSF1-targeted promoters (purple), dTREs (green) and untranscribed regions (black). f Genome browser examples of a promoter and a dTRE (upper panel), and an untranscribed genomic region (lower panel) that are bound by HSF1 upon heat shock. HSF1 binding (gray), histone H4 acetylation (black) and transcriptionally engaged Pol II (red and blue) are shown in NHS and HS conditions. Data sets of DNaseI sensitivity and CTCF ChIP-seq (Broad institute) were obtained from the ENCODE
Fig. 8
Fig. 8
Rapid and coordinated reprogramming of genes and distal regulatory elements in stressed human cells. Model showing the rapid heat-induced response of the human genome, including reprogramming of gene transcription and establishment of a stress-specific repertoire of distal regulatory elements. Inhibition of the pause-release of promoter–proximal Pol II clears transcription complexes from the downregulated genes, elevating the concentration of free Pol II in the cell. The heat-induced genes are primed for directionality and rapid activation by the pre-assembled PIC on the core promoter of the coding strand, and by the paused Pol II at the 5′ region of the gene. Upon stress, trans-activators, such as HSF1, launch Pol II from the primed genes into productive elongation. The elevated levels of free Pol II and the highly positioned PIC on the coding strand enable instant loading of Pol II to the freed pause sites, efficiently launching rounds of transcript synthesis from the activated genes. The free Pol II allows also tuning up of the enhancer repertoire, increasing eRNA-production at dTREs that are marked by lineage-specific transcription factors, for example GATA1, GATA2 and TAL1 as shown in this study. In addition to reprogramming TREs, heat stress causes emergence of putative untranscribed regulatory elements, as demonstrated by the acetylation of histone H4 and recruitment of HSF1 to CTCF-rich loci that do not contain components of Pol II complex. Only the key regulatory factors discussed in the text are shown. ac, acetylation; CTCF, CCCTC-binding factor; Down, downregulated genes upon acute heat stress, dTRE, distal transcription regulatory element; dURE, distal untranscribed regulatory element; eRNA, enhancer RNA; GATA, GATA-binding protein; HSF1, heat shock factor 1; PIC, pre-initiation complex; P-TEFb, positive transcription elongation factor b; TAL1, T-cell acute lymphoid leukemia 1; TF, transcription factor, Up, upregulated genes or dTREs upon acute heat stress

References

    1. Fuda NJ, Ardehali MB, Lis JT. Defining mechanisms that regulate RNA polymerase II transcription in vivo. Nature. 2009;461:186–192. doi: 10.1038/nature08449. - DOI - PMC - PubMed
    1. Banerji J, Rusconi S, Schaffner W. Expression of a beta-globin gene is enhanced by remote SV40 DNA sequences. Cell. 1981;27:299–308. doi: 10.1016/0092-8674(81)90413-X. - DOI - PubMed
    1. Kim TK, et al. Widespread transcription at neuronal activity-regulated enhancers. Nature. 2010;465:182–187. doi: 10.1038/nature09033. - DOI - PMC - PubMed
    1. Wang D, et al. Reprogramming transcription by distinct classes of enhancers functionally defined by eRNA. Nature. 2011;474:390–394. doi: 10.1038/nature10006. - DOI - PMC - PubMed
    1. Maston GA, Evans SK, Green MR. Transcriptional regulatory elements in the human genome. Annu. Rev. Genomics Hum. Genet. 2006;7:29–59. doi: 10.1146/annurev.genom.7.080505.115623. - DOI - PubMed

Publication types