. 2017 Aug 15;7(1):8291.
doi: 10.1038/s41598-017-08994-9.

Localized iron accumulation precedes nucleation and growth of magnetite crystals in magnetotactic bacteria

Affiliations

Localized iron accumulation precedes nucleation and growth of magnetite crystals in magnetotactic bacteria

Jacques Werckmann et al. Sci Rep. .

Abstract

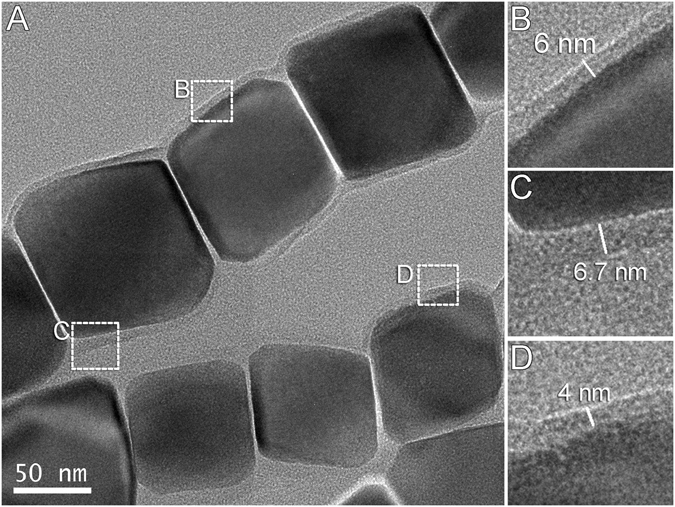
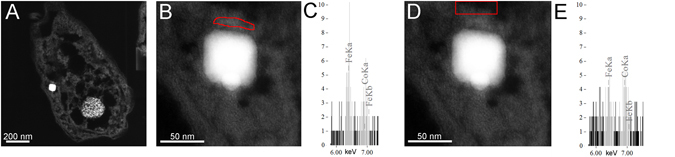
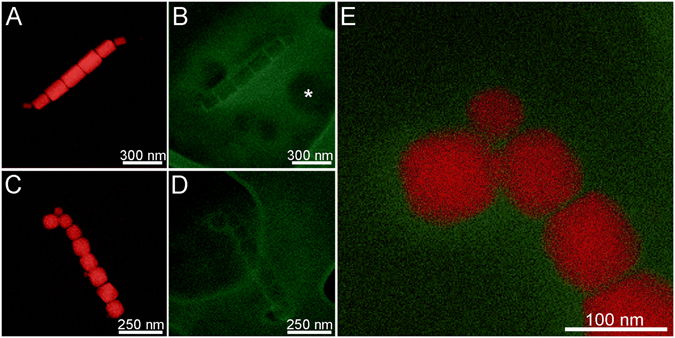
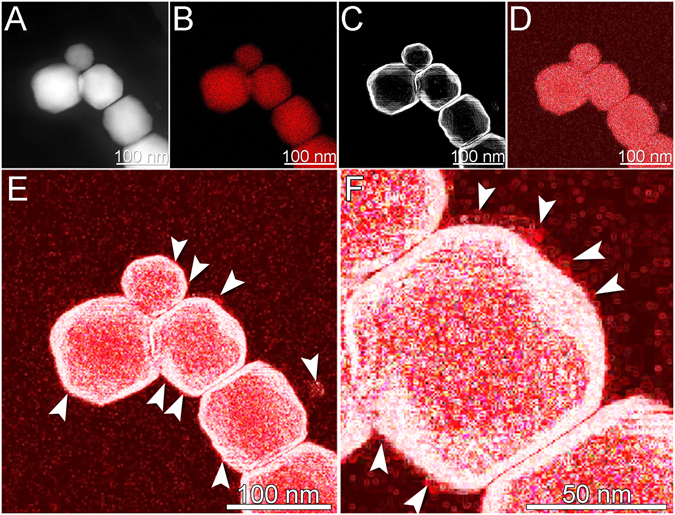
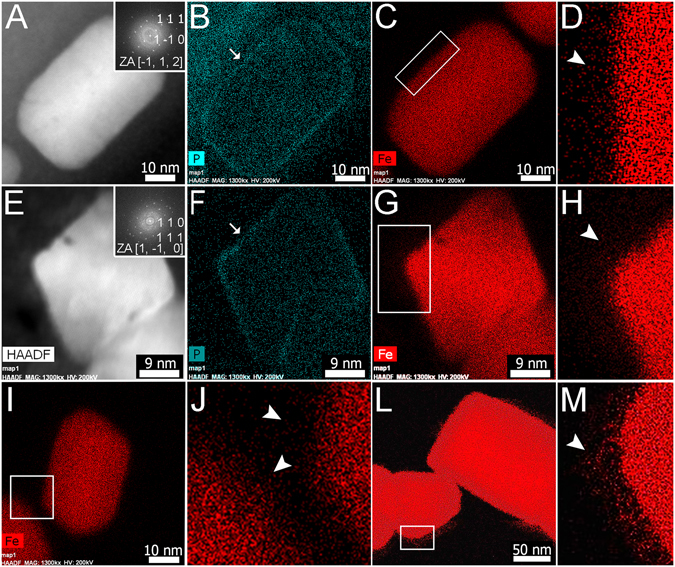
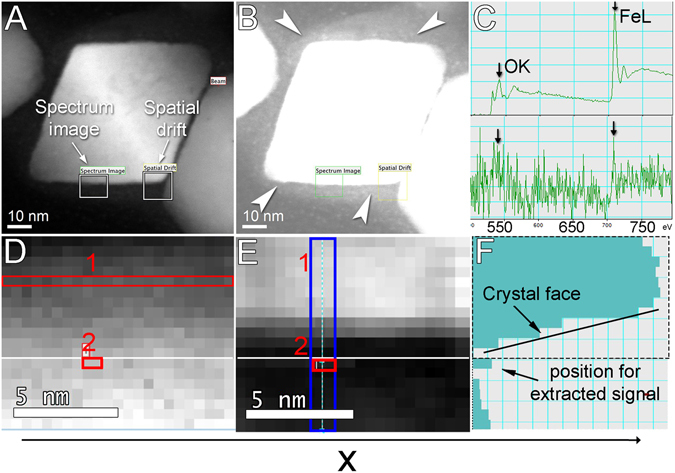
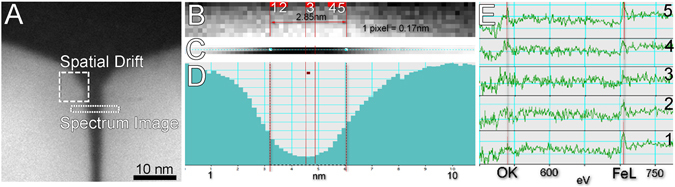
Many magnetotactic bacteria (MTB) biomineralize magnetite crystals that nucleate and grow inside intracellular membranous vesicles that originate from invaginations of the cytoplasmic membrane. The crystals together with their surrounding membranes are referred to magnetosomes. Magnetosome magnetite crystals nucleate and grow using iron transported inside the vesicle by specific proteins. Here we address the question: can iron transported inside MTB for the production of magnetite crystals be spatially mapped using electron microscopy? Cultured and uncultured MTB from brackish and freshwater lagoons were studied using analytical transmission electron microscopy in an attempt to answer this question. Scanning transmission electron microscopy was used at sub-nanometric resolution to determine the distribution of elements by implementing high sensitivity energy dispersive X-ray (EDS) mapping and electron energy loss spectroscopy (EELS). EDS mapping showed that magnetosomes are enmeshed in a magnetosomal matrix in which iron accumulates close to the magnetosome forming a continuous layer visually appearing as a corona. EELS, obtained at high spatial resolution, confirmed that iron was present close to and inside the lipid bilayer magnetosome membrane. This study provides important clues to magnetite formation in MTB through the discovery of a mechanism where iron ions accumulate prior to magnetite biomineralization.


Conflict of interest statement

The authors declare that they have no competing interests.

Figures

Figure 1
Figure 1
Transmission electron microscopy (TEM) images of purified Fe3O4 magnetosomes from Magnetofaba australis strain IT-1. (A) Linear chains of elongated cuboctahedral magnetosomes surrounded by what appears to be a continuous organic layer. (B–D) High magnification views of regions in A, showing the organic layer (the magnetosome membrane) of various thicknesses.
Figure 2
Figure 2
STEM-HAADF of thin-sections of a cryo-fixed cell from cultured Magnetofaba australis strain IT-1. (A) Low magnification image showing the cytoplasm and a Fe3O4 magnetosome. (B and D) show high magnification images of the Fe3O4 magnetosome. The selected regions in (B and D) are the masks used to extract the EDS spectra shown in (C and E), respectively. By comparing the relative intensities of Fe and Co in both spectra, we conclude that iron is more concentrated in the region near the magnetosome (C) than in the cytoplasm (E). It can be seen that, compared to Co, the Fe signal decreases as the distance from the magnetosomes increases.
Figure 3
Figure 3
EDS maps of cells of uncultured coccoid MTB from the Mediterranean Sea (A,B) and cultured Magnetofaba australis strain IT-1 (C,D). (A) Fe map of the uncultured coccus. (B) Corresponding C map of area in (A). (C) Fe map of the cultured M. australis strain IT-1 (D) Corresponding (C) map of area in (C). (E) High magnification superposition elemental map of Fe (red) and C (green) of M. australis strain IT-1. The green region that surrounds the magnetosome in (E) corresponds to the magnetosomal matrix. White arrows in (B and D) highlight the contour of the hole in the formvar lacey, and asterisk the position of one granule. (Jeol ARM microscope, Beam intensity 1 nA).
Figure 4
Figure 4
STEM images and EDS elemental maps of magnetosome chains from cells of cultured Magnetofaba australis strain IT-1. (A) HAADF image of a Fe3O4 magnetosome chain. (B) Fe map of the chain shown in (A). (C) Edge detection algorithm image of the STEM image shown in (A). (D) Edge detection algorithm image of the Fe map shown in (C). (E) Overlay image of the processed STEM (C) and the Fe map (D). (F) High magnification of the overlay image shown in (E). Arrows indicate regions of significant Fe accumulation around the magnetosome Fe3O4 crystal.
Figure 5
Figure 5
High resolution STEM imaging and EDS elemental maps of cells of cultured: Magnetovibrio blakemorei strain MV-1 cell (AD and I,J), Magnetofaba australis strain IT-1 (EH) and from uncultured coccoid MTB from the Mediterranean Sea (L,M). (A) STEM-HAADF image showing a prismatic Fe3O4 magnetosome observed edge-on. Inset shows fast Fourier transform (FFT) analysis of Fe3O4 with indexation. (B) P map of the region shown in (A). Arrow denotes the magnetosome membrane evidenced by the higher intensity of P due to the presence of phospholipids. (C) Fe map of the region shown in (A). (D) High magnification Fe map of the region shown in (C) showing the presence of Fe surrounding the magnetosome (at arrow). (E–H) same as (A) to (D) but for Mf. australis strain IT-1. (I) Fe map of Fe3O4 magnetosome from Mv. blakemorei. (J) Enlarged Fe map of the intermagnetosome region of cell of Mv. blakemorei inside (I). Note the diffuse Fe distribution surrounding magnetosomes (arrowheads). (L) Fe map of Fe3O4 magnetosome from a cell of the uncultured magnetotactic coccus from the Mediterranean Sea. (M) High magnification image of a region of the Fe map inside the rectangle in (L) showing Fe surrounding the magnetosome (arrowhead). (Beam intensity FEI Titan microscope 1.3 nA figures (AJ), Jeol ARM 1 nA figures (L and M).
Figure 6
Figure 6
Electron energy loss spectroscopy (EELS) of an isolated Fe3O4 magnetosome from Magnetofaba australis strain IT-1 analyzed with spectral imaging at high spatial resolution (dwell time 2 s, beam intensity 0.038 nA camera length 2 cm, pixel size 0.5 nm). (A) STEM image of a magnetosome Fe3O4 crystal showing areas used for the analysis and drift correction (white rectangles). (B) Contrast stretching of the same image shown in (A) highlighting the surrounding membrane (white arrows). (C) EELS spectra obtained by the addition of spectra contained in each pixel of the same scanning line in (D); top: Spectrum corresponding to horizontally elongated rectangle (line 1) showing characteristic edges (arrows) for O (540 eV) and Fe (710 eV); bottom: Spectrum corresponding to line 2 obtained by the addition of 2 pixels along the line showing characteristic edges (arrows) for O (540 eV) and Fe (710 eV). (D) Spectrum obtained from the region shown in the square box in (A). Each pixel corresponds to one spectrum (pixel size 0.5 nm × 0.5 nm). (E) STEM-HAADF thickness map or profile map of the square region shown in (A). The intensity of each pixel is proportional of the sample thickness. (F) Projection profile of the addition of two pixels along the X axis of the HAADF intensity contained in the blue rectangle in (E). From bottom of (C, D, E and F), we assume that: (1) position 2 is outside the crystal (D,E and F), (2) in position 2 there is Fe (bottom of C) and thus Fe (other than Fe3O4) is inside the magnetosome membrane vesicle.
Figure 7
Figure 7
EELS of adjacent Fe3O4 magnetosomes in a cell of an uncultured freshwater coccoid MTB from a pond in Strasbourg France. (A) STEM HAADF image of two contiguous Fe3O4 magnetosomes in a chain. Spectrum image acquisition region and spatial drift (dwell time 2 s, camera length 2 cm, pixel size 0.17 nm). (B) Spectrum image obtained in the region highlighted in (A). Each acquired pixel can be assigned to an individual spectrum shown in figure (E). To enhance the signal to noise ratio, the signal from two pixels was added to give spectra in (E). (C) HAADF image or morphological map of the first line of STEM image acquired simultaneously as the spectrum image. (D) Morphological profile of the region between two magnetosomes. (F) EELS signals obtained from positions 1, 2, 3, 4, and 5 in spectrum image show in (B). Fe signals were found in all spectra.

References

    1. Weiner S, Dove PM. An overview of biomineralization processes and the problem of the vital effect. Rev. in Mineral. Geochem. 2003;54:1–29. doi: 10.2113/0540001. - DOI
    1. Cappellen PV. Biomineralization and global biogeochemical cycles. Rev. in Mineral. Geochem. 2003;54:357–381. doi: 10.2113/0540357. - DOI
    1. Bazylinski DA, Frankel RB. Magnetosome formation in prokaryotes. Nature Rev. Microbiol. 2004;2:217–230. doi: 10.1038/nrmicro842. - DOI - PubMed
    1. Frankel RB, Bazylinski DA, Johnson MS, Taylor BL. Magneto-aerotaxis in marine coccoid bacteria. Biophys. J. 1997;73:994–1000. doi: 10.1016/S0006-3495(97)78132-3. - DOI - PMC - PubMed
    1. Lowenstam HA. Minerals formed by organisms. Science. 1981;211:1126–1131. doi: 10.1126/science.7008198. - DOI - PubMed

Publication types

MeSH terms